Download
1 / 16
160 likes | 277 Views
Targeting Coordinates, Timing, and Finder Charts for the LCROSS Centaur and SSC Impacts 10/2/09 Prepared by Anthony Colaprete . Final LCROSS Centaur and SSC target coordinates (Lat., Lon. in ME) Centaur: -84.675, 311.275 E SSC: -84.729, 310.64 E

E N D
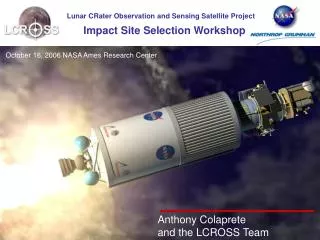
Targeting Coordinates, Timing, and Finder Charts for the LCROSS Centaur and SSC Impacts 10/2/09 Prepared by Anthony Colaprete
Final LCROSS Centaur and SSC target coordinates (Lat., Lon. in ME) • Centaur: -84.675, 311.275 E • SSC: -84.729, 310.64 E • Elevations (Assumed Lunar radius: 1737.4 km): • Centaur target elev: -3.82693 km • SSC target elev: -3.80909 km • Impact Times: • Centaur: 9 Oct 2009 11:31:30 UTC • SSC: 9 Oct 2009 11:35:45 UTC • Note: These are nominal impact positions and times. Actual impact times based on TCM results may differ (see next slide for uncertainties)
Centaur Impact indicated by Red circle SSC impact indicated by Blue circle
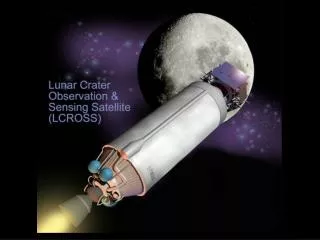
Impact site simulation Following are several simulations of the Centaur impact site made using LOLA data. The measuring rod is 3.5 km wide. Each color stripe is 0.5 km wide and separated by 0.5 km. The lowest colored stripe is colored red, followed by yellow, green, blue and violet. Included are images of the region as seen from California, Hawaii, and New Mexico. The measuring rods indicate Earth visibility beginning between 1.8 and 2 km. Also included are a perspective view showing the level at which ejecta meets sunlight, about 1 km across the 3.5 km measuring rod, as well as a nadir view . These images can be used freely but credit should be given to the NASA/Goddard Space Flight Center Scientific Visualization Studio and the LOLA Team.
California – 50 km NASA/Goddard Space Flight Center Scientific Visualization Studio and the LOLA Team
California – 100 km NASA/Goddard Space Flight Center Scientific Visualization Studio and the LOLA Team
Hawaii – 50 km NASA/Goddard Space Flight Center Scientific Visualization Studio and the LOLA Team
Hawaii – 100 km NASA/Goddard Space Flight Center Scientific Visualization Studio and the LOLA Team
New Mexico – 50 km NASA/Goddard Space Flight Center Scientific Visualization Studio and the LOLA Team
New Mexico – 100 km NASA/Goddard Space Flight Center Scientific Visualization Studio and the LOLA Team
Perspective view showing the level at which ejecta meets sunlight NASA/Goddard Space Flight Center Scientific Visualization Studio and the LOLA Team
Nadir view NASA/Goddard Space Flight Center Scientific Visualization Studio and the LOLA Team