Download
1 / 18
180 likes | 287 Views
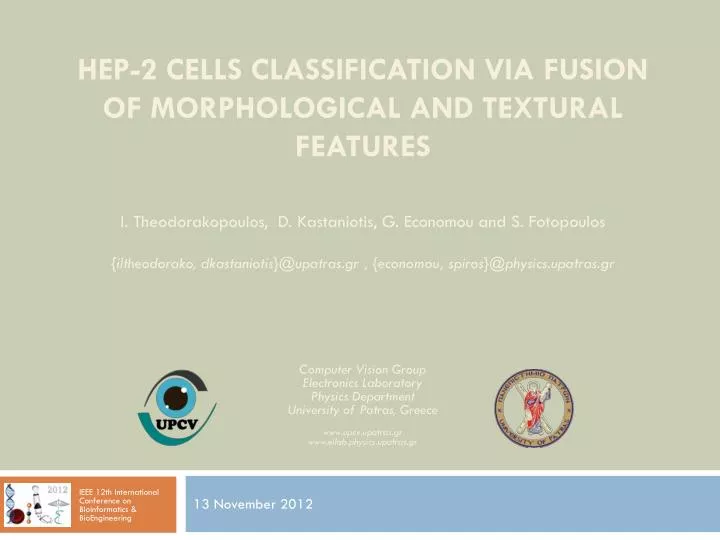
I. Theodorakopoulos, D. Kastaniotis , G. Economou and S. Fotopoulos { iltheodorako , dkastaniotis }@ upatras.gr , { economou , spiros }@ physics.upatras.gr. HEp-2 Cells Classification via fusion of morphological and textural features. Computer Vision Group Electronics Laboratory

E N D
I. Theodorakopoulos, D. Kastaniotis, G. Economou and S. Fotopoulos • {iltheodorako, dkastaniotis}@upatras.gr , {economou, spiros}@physics.upatras.gr HEp-2 Cells Classification via fusion of morphological and textural features Computer Vision Group Electronics Laboratory Physics Department University of Patras, Greece www.upcv.upatras.gr www.ellab.physics.upatras.gr 13 November 2012 • IEEE 12th International Conference on BioInformatics & BioEngineering
Motivation • The standard screening test for detection of autoimmune diseases is the indirect immunofluorescence (IIF) test. • Human autoantibodies (AABs) associated with various autoimmune conditions, are detected by specific fluorescence patterns on a human epithelial cell line (HEp-2). • Testing is performed manually but : • Requires highly-specialized personnel. • Time-consuming procedure. • Low standardization leads to high inter-laboratory variance.
Typical IIF Procedure • Input: • Single-Cell Images • Cell Contour • Fluorescence Intensity
Taxonomy • More than thirty different nuclear and cytoplasm patterns could be identified. • Can be grouped into six basic patterns:
Properties • Different staining patterns present variations both in: • Morphological characteristics • Shape complexity • Holes • Intensity peaks • Textural characteristics • Smooth Areas • Grainy Areas • In order to capture the unique properties of each pattern, incorporation of both morphological and textural descriptors seems reasonable.
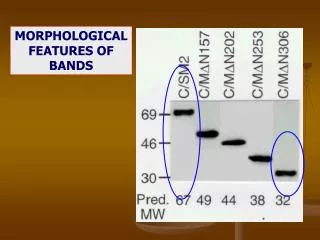
Morphological Features • Cell’s contour complexity • Threshold cell image into 9 levels equally spaced between intensity extremes. • Perform Connected Components Analysis on each binary image. • Discard blobs with area <1% of the mean area. • On each binary image, compute: • Number of detected blobs • Density of detected blobs • Mean solidity of the detected blobs • Concatenate all features to a 28-dimensional descriptor
Local Binary Patterns (LBPs) • A well-established textural descriptor. • The biggest part of textural information is encoded in the 58 uniform patterns. • LBPs are not rotation invariant. • A simple solution is to calculate the uniform LPBs histograms on 80 rotated instances of the cell image (4.5 deg intervals).
Classification • The 28 morphological features and the 58-bin LBPs descriptor are concatenated in a 86-Dimensional feature vector. • Classification is performed using non-linear SVMs with Gaussian kernel.
Evaluation • Lack of publicly available datasets. • Evaluation on the dataset of HEp-2 cell classification contest (hosted by ICPR 2012 conference) • 721 single-cell fluorescence images. • Manually segmented and annotated by specialists in order to provide ground truth. • Binary masks and fluorescence intensity are provided. • Approximately uniform distribution of patterns. • There are not reported results for comparison yet.
Results K-fold validation - Classification performance of the various feature sets for variable k Confusion Matrix for 10-fold validation procedure using morphological and textural features’ fusion
Thank You Acknowledgment This research has been co-financed by the European Union (European Social Fund – ESF) and Greek national funds through the Operational Program "Education and Lifelong Learning" of the National Strategic Reference Framework (NSRF) - Research Funding Program: Heracleitus II. Investing in knowledge society through the European Social Fund.