Download
1 / 42
420 likes | 428 Views
In this paper we discussed the basic memory structure and importance of memory forensic. Some major Linux memory analysis focused work was reviewed. Some leading tools were used in practical work to show most common and required techniques in an incident response. Different methods were introduced for live memory analysis, a details procedure and methodology was developed for the convenience of analysts.

E N D
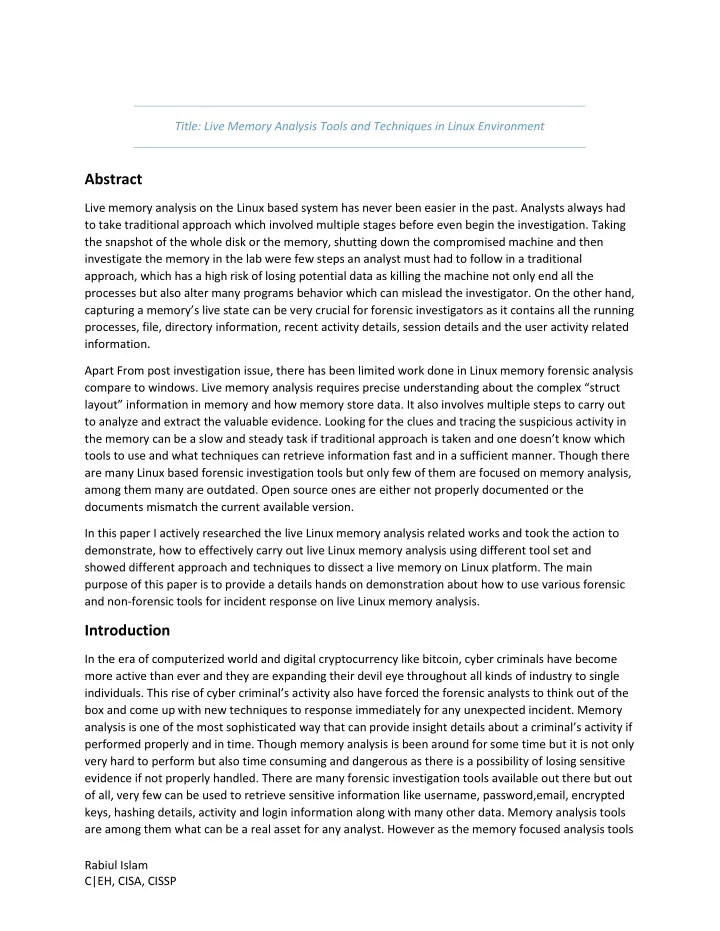
Title: Live Memory Analysis Tools and Techniques in Linux Environment Abstract Live memory analysis on the Linux based system has never been easier in the past. Analysts always had to take traditional approach which involved multiple stages before even begin the investigation. Taking the snapshot of the whole disk or the memory, shutting down the compromised machine and then investigate the memory in the lab were few steps an analyst must had to follow in a traditional approach, which has a high risk of losing potential data as killing the machine not only end all the processes but also alter many programs behavior which can mislead the investigator. On the other hand, capturing a memory’s live state can be very crucial for forensic investigators as it contains all the running processes, file, directory information, recent activity details, session details and the user activity related information. Apart From post investigation issue, there has been limited work done in Linux memory forensic analysis compare to windows. Live memory analysis requires precise understanding about the complex “struct layout” information in memory and how memory store data. It also involves multiple steps to carry out to analyze and extract the valuable evidence. Looking for the clues and tracing the suspicious activity in the memory can be a slow and steady task if traditional approach is taken and one doesn’t know which tools to use and what techniques can retrieve information fast and in a sufficient manner. Though there are many Linux based forensic investigation tools but only few of them are focused on memory analysis, among them many are outdated. Open source ones are either not properly documented or the documents mismatch the current available version. In this paper I actively researched the live Linux memory analysis related works and took the action to demonstrate, how to effectively carry out live Linux memory analysis using different tool set and showed different approach and techniques to dissect a live memory on Linux platform. The main purpose of this paper is to provide a details hands on demonstration about how to use various forensic and non-forensic tools for incident response on live Linux memory analysis. Introduction In the era of computerized world and digital cryptocurrency like bitcoin, cyber criminals have become more active than ever and they are expanding their devil eye throughout all kinds of industry to single individuals. This rise of cyber criminal’s activity also have forced the forensic analysts to think out of the box and come up with new techniques to response immediately for any unexpected incident. Memory analysis is one of the most sophisticated way that can provide insight details about a criminal’s activity if performed properly and in time. Though memory analysis is been around for some time but it is not only very hard to perform but also time consuming and dangerous as there is a possibility of losing sensitive evidence if not properly handled. There are many forensic investigation tools available out there but out of all, very few can be used to retrieve sensitive information like username, password,email, encrypted keys, hashing details, activity and login information along with many other data. Memory analysis tools are among them what can be a real asset for any analyst. However as the memory focused analysis tools Rabiul Islam C|EH, CISA, CISSP
are expanding their wings and integrating new plugins every day, so does the number of new analysts are increasing but many of them don’t know how to use these tools and use them for their own benefits. At first observation, many can make a mistake to think physical memory is randomly constructed wide range of data but that is not true at all. Physical memory is used to store all program’s activity and state in a much disciplined way. The developers take the following steps to ensure the structure of a memory: a.Employ logical construct (C struct) to gather relevant data into logical units - This represent abstract data types b.Struct is laid out in a memory in a consistent manner c.Generate codes to access various members of the struct Analyst must have access to abstract struct object to successfully extract vital information from the memory. For an open source operating system like Linux, it is very difficult to do that as struct layout and kernel version changes frequently. In a case like this, researchers tried to find a solution for the question that how memory analysis could be done in Linux in more automatic fashion? To make analysts life easier few open source projects were founded and many forensic professionals did intensive research to find a way to automate everything which is fast and efficient. Though open source foundations like volatility memory analysis framework and Rekall successfully found a way to use the information derived from debugging streams to analyze memory images from multiple versions of Linux based OS but many of them have limitations to guide an examiners to conduct their analysis effortlessly. This process not only requires many manual steps but also all the memory analysis framework has so many plugins and modules that it can be overwhelming for an investigator to choose between right tool for the right incident response that can lead to the right path to extract the right evidence. This situation has raised questions like: What is the right approach and methodology to perform live memory analysis without losing or altering valuable evidence? What tools and techniques to use for different incident response scenarios? In the past academic work, most researchers focused on particular issue to carry out Linux memory analysis and usage of tools only on disk analysis. In this research my prime goal is to address the obstacles on performing live Linux memory analysis, various tools and techniques focused on only live Linux memory analysis and shed light on details methodology to carry out an incident response. I have used an action based method to demonstrate various tools and techniques to perform my analysis. I started with LiME to capture the memory. After capturing the memory and creating the profile , I have used Volatile and Rekall Memory Analysis Framework to perform extensive analysis on the memory image to find out evidence of criminal activity .I have also used simple tool like cat, grep and photorec to demonstrate the techniques to perform quick investigation on live memory and retrieve valuable information. A cloud based (AWS ) Ubuntu 14.04 server with 1 GB memory was used during the practical work. Rabiul Islam C|EH, CISA, CISSP
The outcomes of the practical work provides a high level overview of how to handle the compromised system, capture a memory of a live system or running the analysis on the live memory instead of capturing it, usage of decomposer library for advanced binary analysis, how to use system map to generate a profile on any Linux based machine, how to extract system information, process memory , network information and perform rootkit analysis using volatility, how to create virtual environment to run live mode using Rekall , details comparison between volatility and rekall and some more techniques with non-forensic tools. Literature Review of Previous Work Socała and Cohen [1] stated, if the investigators want to extract any sensitive information from a live memory image, they must get their hands on abstract struct objects first, which the program handles from the physical memory. In order to achieve this, the analysts should have an exact model of the physical layout of the structs and their member’s data types, which is a difficult process, especially for Linux based OS. In most cases, investigators perform live triaging by copying and moving the necessary files to a remote host, likely configured to the targeted host, make the profile and then copy the profile to the target host. To make everyone’s life easier, the authors have developed a tool called Layout Expert which not only can calculate memory layout of critical kernel structures without any extra tools but also generate automatic profile. The generated profile can be used to diagnose the live memory via /proc/kcore device. The way Layout expert tool work is as follows: First it predicts the struct layout , after that it calculates a profile without installing the full compiler tool chain or contacting any external server. The Kernal sources are dissected into a PRE-AST which is later used to get rid of unnecessary code, macro expansions and struct definitions. On this stage, the new version of Pre-AST is being serialized using JSON and stored on the disk. This file can be shipped to live memory acquisition tool in the data files group. The final version of layout is bundled with the system.map to produce a profile for analysis framework. Case, Marziale and Richard [2] mentioned, in earlier days running a number of statically linked binaries and capturing the output of the commands ( ls,ps,lsof ,lsmod etc for Linux ) for later usage on the target machine was required for live forensics. Physical memory dump was also limited to only string searches. Linux releases new kernel versions often and it is quite difficult for analysts to model the required structure even if they have the complete source code. Without having a proper understanding of the data structure and algorithms of the original OS , it is not possible for the investigators to analyze everything on the physical memory dump. The authors tried to find a solution for this issue and developed a tool called Ramparser which allows live memory analysis tool to work with wide range of kernel versions automatically without relying on any specific kernel distributions. At the beginning Ramparser collects all the required structure offsets ( task_struct,mm_struct,file, dentry, Qstr, inet_sock, Sock, Socket ) to analyze the memory, then it gathers information according to the needs of its features and store them in a SQLite database. This database contains all the sensitive information about memory image that Ramparser can retrieve. Authors had successfully tested the tool on different distributions of Linux from 2.6.9 to 2.6.27 kernel versions. Wang et al., [3] proposed a methodology for live investigation by breaking it into multiple stages such as information gathering, analyzing it and creating a report. This method is applicable for the memory Rabiul Islam C|EH, CISA, CISSP
image. Live examination based on the physical memory works on the running host. An external media is linked to the targeted host but this will alter the behavior of the system and it could be difficult to confirm the validity of the evidence. It is very significant to enable the validation of live evidence. After procuring an image of memory, the raw data of the toolkit ought to be accessible for the third party assessor so that they can come to a conclusions about the validation of the live evidence. With this model, it is possible to reduce the impact of live evidence collection by executing the memory image collection task. In [4], Aljaedi et al. depicted the volatile memory strategies, because of fast increment in memory size, the analysts firmly prescribe the live reaction approach for securing of unpredictable proof. Through this procedure, the specialists can gather the data about live processes as well as about the cache and finished processes. Volatile memory examination turns into an imperative bit of examination since the physical memory could have vital information which analysts can't find on the hard drives. To get a decent hold of the occurrence, the volatile information accomplishment is the first step in the digital examination. Typically the examiner accumulates the volatile information through live reaction while the criminal may utilize different libraries to influence the system call, connect to the kernel and update the information. To explore the unstable information of target system, a memory image examination approach is also utilized. This approach may fill in as an alternative to live reaction. With administrative tools, the inspector can acquire all the unpredictable data in the memory including the live and ended processes data. S. Balogh, and M. Pondelik [5] proposed how to discover encryption keys from the memory dump, in Linux they utilized TruCrypt application that has AES encryption algorithm with XTS mode to procure image of the memory so they get everything except password. Investigators examine that the encryption keys is found in HEAP of the last process produced from the HEAP procedure by the TrueCrypt. They discovered PID and with PID last process, they additionally discovered address of pages in the memory dump which is the access process, so by using this technique it is possible to lessen the span of image since analysts don't need to take image of the full memory. All the keys are available in kernel memory since all the encoding and decoding forms are executed as kernel factor. So the TrueCrypt driver appoints the kernel mode memory and store all the keys as non- paged pool. The first restriction of this work is finding the location of the keys. Analysts need to install third party encryption packages on the target machine for various encryption packages. Second, if the memory contain any fraction of decomposition then the extracted keys might have some blunder and the final issue about this procedure is, the key can split through the memory in a consistent way. To properly configure the virtual machine to adopt the target OS settings, tools like LiveView and VFC are commonly used. Mariusz Burdach [6] presented various methods that can be used during an evidence collection phase from live memory for Linux based OS. First he started with running a network sniffer tool (tcpdump) to monitor the communication flows to and from a compromised machine. He pointed that it is very much possible to detect malicious activity by analyzing the captured data in raw format in the network. He also advised to build and copy the following tools to the external media (Such as CD-RW disc) : nc, dd, datecat, hunter, pcat, NetstatArproute, insmod, dmesg that would be mounted in the compromised Rabiul Islam C|EH, CISA, CISSP
system. In initial step, he suggests to take a picture of the compromised system’s screen before mounting the media. After that author started to collect information from cache tables (arp and routing tables), current / closed connections and port details, list of modules loaded into kernel memory, list of active processes and list of suspicious processes. A very useful method to detect any rootkit if it loaded into kernel memory by checking one of its task if it is hiding any open port. The author used gdb tool for advance analysis on kcore file. As an example of usage he compared and verified the system call address by looking for address of the sys_call_table from Symbol.map. Project Methodology a.Basic Idea: Before explaining the methodology, let me provide some basic idea of memory usage when any program is running. Once any program starts, the memory module divide into program segment and data segment part which consist of heap and stack. Program Segment Program Heap Stack Heap Bottom Data Segment Stack Pointer b.Methodology To obtain all the reliable and sensitive data from both segment we have used two main method. Both of the methods has sub steps and some benefits over each other. 1.Live Memory analysis after capturing it: In this method a memory was captured in lime format with .mem extension prior to analyze. The following methodology was taken step by step to analyze the memory without putting it into risk of losing any information. Memory acquisition Creating profile Reconnaissance Enumeration of running process Recovering memory mapped files and directories Analyzing active tasks details Investigating for rootkits 2.Live memory analysis without capturing the memory In this method no captured memory was used and no profile was created prior to analyzing the memory. Automatic profile detection Reconnaissance Rabiul Islam C|EH, CISA, CISSP
Enumeration of running process Recovering memory mapped files and directories Investigating for rootkits String search Detecting and Recovering hidden data 1.Memory acquisition: In this step the live state memory of the target machine was acquired 2.Creating profile: A profile is required to perform the memory analysis for volatility and rekall framework. To create the profile , Linux distribution, kernel version, cpu architecture information was retrieved, which was used to generate system map file by LiME and module.dwarf file by volatility. Later on both system map and module.dwarf file was used to create the compatible profile to carry out our analysis. However for rekall, we didn’t have to create any profile manually as rekall has a large collection of profiles for various operating systems with many kernel versions. 3.Reconnaissance: After creating the profile , we started our investigation slow to retrieve information like system and network information and got a technical understanding about the memory and the target machine. 4.Enumeration of running process On this step we enumerated the running processes, This step was very crucial to analyze the incident in depth and identify if any malicious activity is in progress. 5.Recovering memory mapped files and directories Retrieved the path of all files and directories. With this technique one can find many sensitive information along with further clue of what the target machine was compromised on the first place. 6.Investigating for rootkits This was the final stage to use all the possible techniques to identify any rootkits, infected files or any other malicious activity. 7.String search Some basic techniques was used to promptly get an understanding about the captured image and find valuable information in between lines using keyword search. 8.Detecting and Recovering hidden data On this step the full memory was dissected and all the data was recovered in full form including hidden data. c.Tools used Live Memory Analysis with Volatility Sub Tasks - - System Information Network Information Main Task Memory acquisition Profile Creation Analysis Tools/Plugins/ Files LiME System Map, module.dwarf Linux_cpuinfo Linux_arp Rabiul Islam C|EH, CISA, CISSP
Process Memory Rootkit Detection Live Memory Analysis with Rekall Live Memory Analysis Techniques with Non-forensic tools - Detecting and Recovering hidden data Linux_enumerate_files Linux_bash Linux_check_creds Linux_check_fop Linux_check_modules Linux_check_syscall Memory acquisition Profile Creation Analysis LinPmem Automatic pslist Describe(pslist) pstree session paxview arp banner check_afinfo check_creds check_proc_fops maps String Search Cat , Grep Photorec - d.Procedure I have taken the following procedure to perform the memory analysis. Rabiul Islam C|EH, CISA, CISSP
•Victim system is being identified •Image is being acquired Acquiring Image •Profile is created •Memory structures are parsed •Memory segments are identified Establish Context •Looked for suspicious activity like unlined processes, known malware, hook etc • Discovered interesting information like username, password, email • Reocvered and reviewed all files including hidden files Analysis Documentation Practical work Volatility Volatility is an open source framework focused in memory analysis for the purpose of forensic investigation, malware analysis and incident response. It is developed in python and supports all kinds of OS and have a number of plugins to perform normal to deep memory forensic investigation. It can also analyze a wide range of file formats including but not limited to VMware .vmem ,raw dumps, expert witness (EWF), hibernation files ,crash dumps, VirtualBox core dumps, VMware saved state and suspended files (.vmss/.vmsn), direct physical memory over Firewire and LiME (Linux Memory Extractor). Volatility works in a fast and efficient manner regardless of the size of the memory. Environment Setup To demonstrate the usage of volatility, I have setup an Ubuntu 14.04.5 server on AWS with a LEMP stack on it. The server has a live website running that is configured in a virtualhost with Nginx web server. It has a memory of 1 gb. Basically we are going to acquire the memory and dissect it using volatility. Rabiul Islam C|EH, CISA, CISSP
I did ssh to connect to the target server with my username and private key. I need to have full power on the server to perform all the tasks without having access limitation, so I decided to become root! #sudo su It is always a good idea to keep everything up to date before starting any serious work on the system, so I performed an update and upgrade: #sudo apt-get update #sudo apt-get upgrade Rabiul Islam C|EH, CISA, CISSP
To make sure our memory acquisition and analysis tool will work without any issue, we will need to install some third party dependencies. #sudo apt-get install build-essential Rabiul Islam C|EH, CISA, CISSP
#sudo apt-get install Linux-headers-`uname -r` #sudo apt-get install git python dwarfdump zip python-crypto I couldn’t find the distorm library directly from the Ubuntu official sources. So I pulled the repo from github and build that manually. Distorm is fast and easy to use decomposer library. It can return a binary structure upon giving an instruction which is very helpful for advanced binary code analysis. #git clone https://github.com/gdabah/distorm.git Rabiul Islam C|EH, CISA, CISSP
#cd distorm #python setup.py build Installing LiME Volatility doesn’t provide any memory acquisition tool but it recommends to use a LiME format to perform and get a better result. LiME is a LKM (Loadable Kernal Module) to acquire our target system’s RAM. It is possible to acquire the memory both to the file system and over the network. It avoids any kinds of interruption between user and kernel space processes during taking the snapshot of the memory. That’s why it is able to capture the memory in a live version and produce the exact copy including all the vital information on the memory without ending or disrupting any processes. We will need to build LiME according to our target’s kernel version. #git clone https://github.com/504ensicsLabs/LiME #cd LiME/src/ #make Rabiul Islam C|EH, CISA, CISSP
On the above screenshot if we have a look at the last line of the “make” output we can see the kernel version that we need to use. In my case it’slime-3.13.0-105-generic.ko. Now I am going to capture the system’s memory and acquire a copy of it on my current folder with lime format by loading the kernel module. After capturing the memory I have moved it to /tmp folder for safety reason. We will use this snapshot to perform our forensic analysis. #sudo insmod lime-3.13.0-105-generic.ko “path=ubuntu.mem format=lime” #sudo cp Ubuntu.mem /tmp Installing Volatility Now we have are going to install and configure the volatility tool. It’s better to get the updated version of the volatility directly from the official site. #git clone https://github.com/volatilityfoundation/volatility #cd volatility/tools/Linux/ #make clean Rabiul Islam C|EH, CISA, CISSP
#make It is time to locate our system map which provides details information to volatility about how memory analysis snapshot is structured. In our case(Ubuntu) we can find that in /boot/ so, #ls -al /boot/ System.map-3.13.0-105-generic is what we will need for our next step. Creating Volatility Profile It is important to create a profile to make volatility work properly and perform memory analysis. For any kind of memory analysis using volatility, we must be careful to build the profile for the system that we want to analyze but not the system where we want to analyze the memory. Volatility comes with a list of profile but in our case, we will make one manually as it is not available in the pre-defined list. We need to keep three things in mind to match the profile with our target system, which are: 1) Linux distribution 2) Exact kernel version 3) CPU architecture (32-bit, 64-bit, etc). We will select System.map-3.13.0-105-generic file as it matches our lime-3.13.0-105-generic.ko file. Our profile will require module.dwarf file made by Volatility and our System map, so I will simply zip them together. #cd ../../ Rabiul Islam C|EH, CISA, CISSP
#sudo zip volatility/plugins/overlays/Linux/Ubuntu140405.zip tools/Linux/module.dwarf /boot/System.map-3.13.0-105-generic Running Volatility Before we run the volatility, let’s find out if our profile has been created successfully and everything is in place. #python vol.py --info | grep Linux As we can see Volatility is printing the profile that we have created on earlier steps: LinuxUbuntu140405x64 – A Profile for Linux Ubuntu140405 x64 It indicates everything has been setup properly and we are good to start our memory analysis. Let’s have a look at the available plugins from volatility that we can use to perform our memory analysis. #python ./vol.py --info | grep -i Linux_ Rabiul Islam C|EH, CISA, CISSP
In this demonstration I am going to perform the analysis using various plugins to give an overview idea of their usage and outcomes. There are total seven main categories of plugins in volatility. 1.Processes 2.Process Memory 3.Kernel Memory and Objects 4.Rootkit Detection 5.Networking 6.System Information 7.Miscellaneous Each of the category has bunch of plugins that can be used to perform details analysis on the memory. These tool set provides insight details of the memory and can help an analyst to navigate through the memory , understand it’s pre and post compromised state along with performing very high level analysis. It doesn’t stop there, it also allow an investigator to gather all the required digital evidence to put together his case. We will run all the plugins against our saved memory snapshot located in /tmp. We will also need to define our profile before the plugin module name. Let’s start with something simple and get ourselves familiar with the plugins. System Information a.Linux_cpuinfo: It simply prints the target machine cpu details. Rabiul Islam C|EH, CISA, CISSP
#sudo python vol.py –f /tmp/ubuntu.mem –profile=LinuxUbuntu140405x64 Networking b.Linux_arp: This module simply prints the ARP table. It can be useful for an investigator to get some network related information. #sudo python vol.py –f /tmp/ubuntu.mem –profile=LinuxUbuntu140405x64 Linux_arp c.Linux_enumerate_files: This plugin simply enumerate all the files with their path details. This list of file details can be helpful to find any suspicious file on the system. #sudo python vol.py –f /tmp/ubuntu.mem –profile=LinuxUbuntu140405x64 Linux_enumerate_files Now, let’shave a look at some past history on our target machine’s memory. Process Memory: Rabiul Islam C|EH, CISA, CISSP
d.Linux_bash: This plugin allows us to see all the Bash commands that were ran prior to taking our snapshot. This can help an investigator to understand what the attacker was doing, which directories he was visiting, what files he was opening or if he was installing and malware remotely and so on. #sudo python vol.py –f /tmp/ubuntu.mem –profile=LinuxUbuntu140405x64 Linux_bash It would be also a good idea to look under the hood and see if we can find something fishy. Rootkit Detection e.Linux_check_creds: This module recognizes rootkits that have increased the authority to root level utilizing DKOM procedures. The obtaining of cred structures prompts an irregularity that Volatility can use to discover if any processes were given root level authority. In the typical workings of the kernel, each process gets a special cred structure and they are never shared or acquired. The Linux_check_creds module uses this by building a mapping of processes and their cred structures and after that reports any processes that is similar. On our memory, we have not got any pid that has similarity with any of our processes. That indicates it is rootkit free. #sudo python vol.py –f /tmp/ubuntu.mem –profile=LinuxUbuntu140405x64 Linux_check_creds Rabiul Islam C|EH, CISA, CISSP
f.Linux_check_fop: This plugin prints the lists of the /proc filesystem and all opened files and confirms that each part of each file_operations structure is in the right place and not hidden. From the screenshot below we can see, volatility couldn’t find any hooks placed by Average Coder. This confirms again that the system is not compromised with any rootkits. #sudo python vol.py –f /tmp/ubuntu.mem –profile=LinuxUbuntu140405x64 Linux_check_fop g.Linux_check_modules This plugin helps to discover rootkits that break themselves from the module list but not sysfs. We have never found a rootkit that really expels itself from sysfs, so on a live framework they are covered up from lsmod and /proc/modules, but can still be found beneath /sys/modules. #sudo python vol.py –f /tmp/Ubuntu.mem –profile=LinuxUbuntu140405x64 Linux_check_modules h.Linux_check_syscall This module also helps to identify if the system is compromised with rootkits. It lists the system call tables and checks for hooked functions. For 64-bit OS, it prints both the 32-bit and 64-bit table. In case a hooked function, it prints the "HOOKED" on the output, if not, it just shows the name of the system call function. In our case, we haven’t found any hooked function. Rabiul Islam C|EH, CISA, CISSP
#sudo python vol.py –f /tmp/Ubuntu.mem –profile=LinuxUbuntu140405x64 Linux_check_syscall Rabiul Islam C|EH, CISA, CISSP
Rekall: It a memory forensic and investigation framework consists of a set of tool. It is written in python and provides complete memory analysis solution to all major os including Windows, Linux and Mac. Rekall also provides memory acquisition tool for each platform. Overview of rekall: 1.Memory acquisition tool: Pmem MacPmem – For most recent OSX. WinPmem – For windows memory acquisition LinPmem – For Linux (ordinarily utilize/proc/kcore). 2.Live examination ability Automatically stack driver and access crude memory without taking a picture first. Used for triaging and gathering a full image Focus on flexible live memory investigation. 3.Wide collection for memory investigation profiles: AutoDetect the right profile 4.Focus on client encounter. Automates everything Provide an entire workplace with an easy to understand interface. Rabiul Islam C|EH, CISA, CISSP
Install/Setup Rekall: We will need to install some third party dependencies before we proceed with the installation of Rekall. # sudo apt-get install python-pip python-dev libssl-dev libncurses5-dev -y Let’s install and create our virtual world # pip install virtualenv # virtualenv /tmp/MyEnv Activate it # source /tmp/MyEnv/bin/activate # pip install pandas Rabiul Islam C|EH, CISA, CISSP
Once we are done with installing all libraries, we can go ahead and install rekall along with rekall-agent. # pip install rekall-agent rekall Install/Setup Linpmem All the memory acquisition tools provided by Rekall uses unified AFF4 imager framework to produce all the images in a similar way. Rekall can utilize all kernel components straightforwardly when performing live examination on all supported systems. Rekall moreover includes a plugin called aff4acquire which uses this physical memory access to get a physical memory image, in a comparable way to the standalone instruments. Memory procurement through Rekall is able to incorporate extra information which can only be reduced from live investigation (e.g. it too captures all mapped records) but it requires running Rekall (with bigger footprint and requires access to the profile repo). As we are on Linux, we are going to use Linpmem for our memory acquisition. However, in this demonstration we don’t need to use the snapshot as Rekall also provides live memory analysis without dumping it first. Rabiul Islam C|EH, CISA, CISSP
# wget https://github.com/google/rekall/releases/download/v1.5.1/linpmem-2.1.post4 Let’s give it right permission to work without any issue. # chmod +x linpmem-2.1.post4 # ./linpmem-2.1.post4 -o mem.aff4r The above command will take the snapshot and save it as mem.aff4r file on the current directory. We can perform our investigation using Rekall in multiple ways. a.Trough Rekall API which performs the analysis using OS APIs b.Perform analysis on the memory image after acquiring it from the target machine. c.Rekall-Live: We can erform our analysis directly on the physical memory instead of creating an image first. As we already have seen how to perform analysis on a captured memory with volatility, let’s use Rekall- Live mode to investigate our target machines memory. For rekall live memory analysis, we don’t need to create any profile as it will automatically detect the kernel version and load the required profile to work with. Rabiul Islam C|EH, CISA, CISSP
Rekall has wide range of plugins supporting all major operating systems including Linux, windows and OSX. It has six major categories of plugins: 1.Filesystems These plugins are focused on filesystems only. It has six major plugins supporting various file systems including NTFS, MFT, 2.General These are common plugins that can be used regardless of Operating system. There are 29 plugins in this category to the date. They can be used for various purpose like dumping the image, exporting, building index, searching with specific pid id, session or process details etc. 3.Response: These set of plugins are particularly for incident responders. There are total 15 plugins under this category. These plugins use the API to fetch live system state in a timely fashion. All of these plugins can be used with --live Memory or the --live API mode 4.Linux There are total 38 plugins focused on only Linux operating systems. 5.OSX Plugins focused on OSX based operating system. 6.Windows Plugins focused on windows operating system. In our following demonstration we are going to show techniques related to Linux , General and Response plugins category. Rabiul Islam C|EH, CISA, CISSP
Rekall- Live #rekall - -live a.Pslist It gathers active tasks by using the task_struct->task list. It does not print any swapper process. If the DTB column is empty, the item is most likely a kernel thread. Structured ouput describe(pslist) In general ‘describe’ describes the output of any plugin. In this particular case, it is providing a details view of the pslist. pstree It prints a parent/child relationship tree by running the task_struct.sibling and task_struct.children members. Rabiul Islam C|EH, CISA, CISSP
session paxview arp It simply provides the arp table details. Rabiul Islam C|EH, CISA, CISSP
banner It prints the os version details. check_afinfo The plugin distinguishes the area of each function pointer of diverse network protocol. If found inside the kernel or a stacked module, rekall provides details data as well as its kernel-space address. If malware powerfully distributes memory and duplicates code there to handle these functions, the Module column will show up as Obscure. We can see we have so many module column that is unknown. Rabiul Islam C|EH, CISA, CISSP
check_creds This plugin finds out if any process is sharing credential structures. Credentials are dealt with inside through the task_struct->cred member. Likely due to apathy or a poor endeavor at remaining stealth, a few rootkits basically reuse the cred member of tasks that have the specified credentials (most frequently ID 0: root). This plugin reports the area of the cred part of each task. When this structure is being reused, it show more than one line of yield with the same cred address. check_proc_fops It goes through the file operations pointers of each open file within the proc filesystem. Many rootkits hook these operations to hide the process. To detect if any operation pointer is hooked, rekall checks that the pointer stays inside the kernel image or any known module. If a pointer is found outside of these, then it reports with details. Rabiul Islam C|EH, CISA, CISSP
maps It provides process maps. In this section, I am going to use several Linux based simple tools to analyze our Linux memory that we obtained with LiME. Cat stands of concatenate. It’s a very useful and widely used command in Linux environment. It allows the system admin to view contain of file, concatenate files, create single or multiple files, and redirect output in terminal or files. We are going to use cat command and tell it to find all the strings in our memory image file and save everything in a text file named dictionary. # cat Ubuntu.mem | strings > dictionary.txt If we open the dictionary.txt file, we can see full of text, some binary and some raw texts. Here the question is what we are looking for and how this can help us to analyze the memory. Let’s imagine a scenario where we don’t have any clue about the target machine and we need to response to the incident live and fast. With this techniques, we can quickly find out more about the memory , relevant information os the OS that it was running on and what it was being used for. Not only that, this simple Rabiul Islam C|EH, CISA, CISSP
technique can help us to find out many sensitive information like username, passwords , email, social security number and so on. # vi dictionary.txt If we look closely at the dictionary.txt file, we can see there is a theme name ,WP, wp-content, phpmyadmin and some plugin directory urls. This indicates that someone was running a wordpress site on our target machine. Let’s try to find more relevant information. Let us use cat command again but this time, we are also going to use grep tool to find a single word “wordpress” within our memory and get a filtered output on the terminal instead of getting all the text from the memory. Rabiul Islam C|EH, CISA, CISSP
# cat ubuntu.mem | strings | grep “wordpress” Now this provides us more details and accurate information including cookie details, server and site details, the root directory of the website , form structure, server users and group. Let us use the keyword “username” and see if we can find anything interesting. # cat ubuntu.mem | strings | grep “username” From the above screenshot above, if we look closely on the same line as “envato_username”, we cann see “rabiulis”, this could be interesting. Let’s use the keyword “rabiul” and examine the output. # cat ubuntu.mem | strings | grep “rabiul” Rabiul Islam C|EH, CISA, CISSP
It shows “rabiul” was used as an username at some point on our target machine but that is not probably valid. However, it also show us the email address: ri.sumon@hotmail.com . These techniques can help us to build a dictionary of username and password along with understanding the memory better at an initial stage. It is always a good idea to carry out a dictionary attack rather than bruteforce to save our time and work efficiently. Now though the above tools are techniques are very easy to apply and find out sensitive information quickly but we can not look for all the files separately ( unless we divide them manually ) or look for photos and other formats of files easily. Photorec is one of the most frequent used tool to recover lost / deleted files in Linux. As we are on Ubuntu, we are going to install testdisk library for photorec. On my machine, it is already installed. #sudo apt-get install testdisk Now, we will simply run the following command to start our analysis on the memory. # photorec ubuntu.mem [Proceed ] Rabiul Islam C|EH, CISA, CISSP
It will show the name and size of our memory to confirm our selection. We will select “proceed” and click enter. [File Opt] As our memory image is a single image file and without any partition, it is printing “unknown”. Let’s click on [File opt] to review all the options. Rabiul Islam C|EH, CISA, CISSP
[ Quit ] We will choose all the options to recover as many file types as possible. We will also select “Quit” to return to the previous menu and proceed to the next step. [Other ] As our memory file isn’t a common used file type, we will select “other” option to start our analysis. Directory selection One last thing we need to do is point the directory where we want to save all of the output files. Rabiul Islam C|EH, CISA, CISSP
It takes some time to recover all the files. We can see photorec was able to recover 9294 files and saved them at our pointed directory. We will select “Quit” and navigate to the output directory to review the recovered files. All the directories with “recup” prefix are created by photorec. Let’s open one of them and have a look what it found for us. # cd recup_dir.1 # ls – l We can see it has found many format of files including .c,.h,.java,.txt,.jpg,.xml Now this makes our life lot easier and we can easily go through all of these files , sort them our and investigate further for sensitive information, malwares , machine architecture, used applications, images and so on. Rabiul Islam C|EH, CISA, CISSP
Let’s a have a peak of one of the random file. # vi f1275108.txt Rabiul Islam C|EH, CISA, CISSP
Outcomes/ Results/ Findings Features Volatility Rekall cat & grep Photorec API Access Live Memory Analysis Need to create a profile Yes No No No No Can work without profile Automatic profile detection No Yes No Yes Yes No x Yes x x Profile Collection Need to create profile manually Does not need a profile Profile repository holds all the profile- stored as JSON data files. Profile repository currently has 600 Linux profiles 2000 windows profiles 50 OSX profiles. No x x Need to capture the memory Yes Yes Yes Yes Kernel version is important Can analyze the memory for Processes Process Memory Yes No Yes No No Yes Yes Yes No No Yes Yes Yes No No Kernel Memory and Objects Rootkit Detection Networking System Information Can do keyword search Yes No Yes No No Yes Yes Yes Yes Yes Yes Yes Yes No No Yes Yes Yes Yes Yes Yes Yes Yes Yes No Can recover all files Yes No Yes No Yes Can recover hidden files Yes No Yes Yes Yes Rabiul Islam C|EH, CISA, CISSP
Overall Speed Fast Slow Fast Fast Medium Automatic Report No No No No No None of the memory analysis tool provides details automatic report. On windows version many tool provides automatic report and neat graphs to give an overview understanding about the analysis. Linux memory analysis tool has still room to grow. Both volatility and rekall has a wide range of plugins. Both of them can perform memory analysis on captured memory but only rekall can perform memory analysis on a live running machine without capturing the memory first. Also rekall has a benefit of using API that allows it to see OS related stuffs very easily. All of tools that were used during practical work, allowed us to learn new techniques on Linux memory analysis from scratch, I was able to perform Linux memory analysis thoroughly and showed techniques like how to a.Capture memory using third party tool b.Create profile according to kernel version c.Analyze the memory for processes (Both active and ended) d.Analyze for process memory, kernel memory and object. e.Extract information like cpu version, arp tables f.Find previous activity on the target machine g.Analyze to detect rootkit h.Find details path of all the files i.Perform string search to find specific thing on raw image j.Recover all the files including hidden ones I was able to detect malwares on a machine which thought to be a clean machine , recover username, password , emails get a clear pic On the other hand, neither volatility nor rekall can do keyword search or recover the files directly, which can be easily achieved by cat , grep and photorec recovery tool. Discussion We have used third party tool LiME to capture memory for volatility analysis and LinPmem for rekall. There are many other third party tools to capture memory as well. Even though volatility supports many formats of the memory snapshot but it highly recommend to use LiME and rekall recommend LinPmem. This narrows down the option to capture the memory with different tools , on the other hand there are too many tools to capture memory and it is hard to say which ones are the best to capture the memory more accurately in it’s live state without killing or manipulating any process. In this regard, volatility should have it’s own tool to capture the memory. To create the profile one need to have the system.map file . Linux system can have more than one system.map file and it can be sometime confusing for the analyst to choose the right one. Sometime, Rabiul Islam C|EH, CISA, CISSP
the right one might won’t be there as if the target machine hasn’t been updated for a while and LiME failed to build or if any dependencies are missing. This can cost valuable time and if we look at the table on the previous section, we can see volatility always require a profile to analyze the memory. Creating a profile can be time consuming as it also requires prior knowledge about the target machine and the target machine needs to have various third party plugins installed to use volatility to create the profile. This can not only delay the incident response but also there is always a possibility to make changes on the system during acquiring memory and that is a major concern as it starts up a process and add new data on the memory. The same thing happen while performing live memory analysis without capturing the memory image. This newly added data could override the original data which is vital for the investigation. Another related problem is when an analyst capturing the data, the new data is also getting written by the memory and therefore the analyst is actually mixing both the new and old data together. Like we saw, after I ran the LiME for the first time and analyzed that with volatility, no rootkit was found but later on I performed the memory analysis live on the same target machine without any major changes but it was able to quickly detect rootkits. This clearly points our Rekall has benefits over volatility but on the other hand, rekall’s live api based plugins are limited that can run without a profile. However, rekall also has live memory analysis mode that can auto detect a profile from it’s large collection of profile repository. Even though the techniques shown above were for demonstration purpose, it is highly recommended to avoid any case where there is a chance to make major changes on the target machine. For the first time it can create a confusion on the analysts mind and make it essential for them to differentiate between old and new data. Analysts should make themselves familiarize with the footprint of the memory acquisition tool and eliminate that data quickly instead of wasting valuable time on finding what is relevant and what is not when the situation arise. It is also very important for an analyst to keep in mind that in no cost, it is possible to revert back to original state of the memory once something is been performed on that, even if someone tries to reboot and reload all the programs as memory uses different parts of it every time we start a program, so definitely the investigation scenario after a crime occurred won’t be identical after someone uses the machine for other purposes. Volatility has different mother category for plugins that specifically point out which plugins are for what purpose . Like network analysis, rootkit detetction etc but rekall doesn’t have any specific sub category for all the plugins except filesystem and major OS. This can make it difficult for an analyst to find the required plugins in a short time when it matters the most. One of the major dilemma for an analyst is to confirm if the evidence what he/she has collected from the compromised system is authentic or not. The main reason of this dilemma is whether to trust the OS or not as there is always a possibility that an attacker can alter/ erase or insert the data into the memory what he/ she wants an analyst to see or not to see. The only way to identify is to have a details understanding about the memory structure and always use their own tool instead of relying on publicly available and easily modifiable tools. Though volatility and rekall are open source but they are dependable as they have official repository to get the original code. In the practical work, I had shown how to extract all the information from raw memory in binary or text format and save it in a dictionary.txt file using cat. I also showed how to recover hidden data and different file types separately using photorec. These extraction procedure is fast but the data is too Rabiul Islam C|EH, CISA, CISSP
much that it can be overwhelming for the analyst and sometime an investigator can completely be clueless about from where to start his/ her analysis or verify the findings , if a particular finding is related to the last occurred crime scene or it has happened long before in a different state. It is also very hard to say the source of the file sometime as an advanced attacker can always leave some clues in purpose and mislead an analyst. It is very important for an investigator to know the difference between something made up and original clues. All these above downside doesn’t make the tools or techniques any less significant but they are real facts that an analyst has to face in everyday crime scene. This discussion section provided a clear overview about the limitations of the tools and techniques to create an awareness for analysts so they can be prepared to face any of the situation mentioned above. Conclusion All of us admit live memory forensic on Linux is something not perfect and easy to perform. Analysts are developing new tools and techniques often to make the investigation procedure much smoother as the new technology is emerging. The need of memory forensic has risen to a very high level and it is not possible to discredit that anyhow as attackers are finding their ways to exploit the revolving technology always. There are still many works that can be done on live memory forensic. In this paper I discussed the basic memory structure and importance of memory forensic. Some major Linux memory analysis focused work was reviewed. Some leading tools were used in practical work to show most common and required techniques in an incident response. Different methods were introduced for live memory analysis, a details procedure and methodology was developed for the convenience of analysts. A comparison was made between different tools and their features, strength and weakness were identified and listed in a table. I also did a brief discussion about the details findings, limitation of different approach of various tools and what to expect in a real life scenario and how to overcome those challenges to perform a safe investigation. Many researchers and analysts believer attackers are focusing toward memory more than ever as they can easily execute malicious code there without getting traced back and volatile memory also a safe choice to prevent analysts from performing any reverse engineering and explore sensitive information about the attack method performed by the malicious attacker. Many analyst don’t focus on memory analysis or used the dead box traditional approach. The analysts must also adapt to the new techniques and tools related to live memory forensic as the memory focused attack are on rise. This paper explores various techniques with existing tools to encourage analysts to focus more on live memory analysis and new comers to view the forensic analysis from a new perspective in the field of cybercrime and forensic investigation. Rabiul Islam C|EH, CISA, CISSP
References: [Literature Reivew] 1.Automatic profile generation for live Linux Memory analysis 2.Dynamic recreation of kernel data structures for live forensics 3.L. Wang, R. Zhang., and S. Zhang, “A model of computer live forensics based on physical memory analysis,” In IEEE Information Science and Engineering (ICISE), 2009 1st International Conference on, (2009), December, pp. 4647-4649. 4.A. Aljaedi., D. Lindskog, P. Zavarsky, R. Ruhl, and F. Almari,, “Comparative Analysis of Volatile Memory Forensics: Live Response vs. Memory Imaging,” In IEEE Privacy, security, risk and trust (passat), 2011 ieee third international conference on and 2011 ieee 5.S. Balogh, and M. Pondelik, “Capturing encryption keys for digital analysis,” In IEEE Intelligent Data Acquisition and Advanced Computing Systems (IDAACS), 2011 IEEE 6th International Conference on, vol. 2, (2011), September, pp. 759-763. 6.Forensic Analysis of a Live Linux System, Pt. 1 and 2 7.Rekall plugins: http://www.rekall-forensic.com/documentation-1/rekall-documentation/plugins 8.Rekall memory analysis framework: https://holdmybeersecurity.com/2017/07/29/rekall- memory-analysis-framework-for-windows-Linux-and-mac-osx/ 9.Rekall memory forensic cheatsheet: https://digital-forensics.sans.org/media/rekall-memory- forensics-cheatsheet.pdf 10.Scalabel memory analysis using Rekall and GRR: https://www.dfrws.org/sites/default/files/session- files/pres_using_grr_and_rekall_for_scalable_memory_analysis.pdf 11.Linux memory dump with rekall: https://isc.sans.edu/diary/Linux+Memory+Dump+with+Rekall/17775 12.Memory image forensic analysis using Volatility tool in kali Linux: https://singhgurjot.wordpress.com/2015/09/02/memory-image-forensic-analysis-using- volatility-tool-in-kali-Linux/ 13.Volatility guideline: https://github.com/volatilityfoundation/volatility/wiki/Linux#acquiring- memory 14.Linux memory analysis with volatility: http://dfir.org/research/omfw.pdf 15.Volatility description : https://tools.kali.org/forensics/volatility 16.Volatility Linux command reference: https://github.com/volatilityfoundation/volatility/wiki/Linux-Command- Reference#Linux_check_syscall 17.Methodology of memory analysis and optimization in embedded system: https://www.esat.kuleuven.be/cosic/publications/article-683.pdf 18.Techniques and tools for recovering and analyzing data from volatile memory: https://www.sans.org/reading-room/whitepapers/forensics/techniques-tools-recovering- analyzing-data-volatile-memory-33049 Rabiul Islam C|EH, CISA, CISSP