Download
1 / 5
50 likes | 124 Views
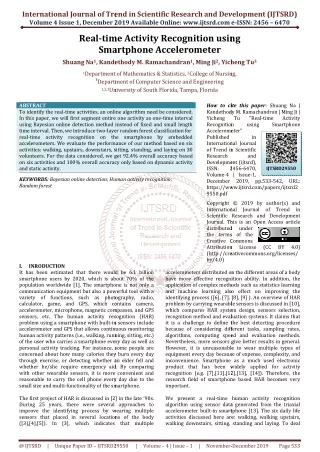
Traffic sign recognition is one of the most important research topics for enabling autonomous vehicle driving systems. In order to be deployed in driving environments, intelligent transport system must be able to recognize and respond to exceptional road conditions such as traffic signs, highway work zones and imminent road works automatically. In this paper, Real time Myanmar Traffic Sign Recognition System RMTSRS is proposed. The incoming video stream is fed into computer vision. Then each incoming frames are segmented using color threshold method for traffic sign detection. A Histogram of Oriented Gradients HOG technique is used to extract the features from the segmented traffic sign and then RMTSRS classifies traffic sign types using Support Vector Machine SVM . The system achieves classification accuracy up to 98 . Myint Tun | Thida Lwin "Real-Time Myanmar Traffic Sign Recognition System using HOG and SVM" Published in International Journal of Trend in Scientific Research and Development (ijtsrd), ISSN: 2456-6470, Volume-3 | Issue-5 , August 2019, URL: https://www.ijtsrd.com/papers/ijtsrd27929.pdf Paper URL: https://www.ijtsrd.com/computer-science/real-time-computing/27929/real-time-myanmar-traffic-sign-recognition-system-using-hog-and-svm/myint-tun<br>

E N D
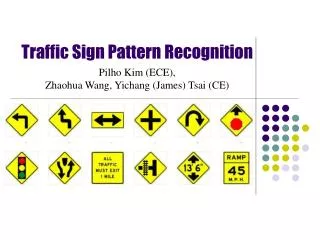
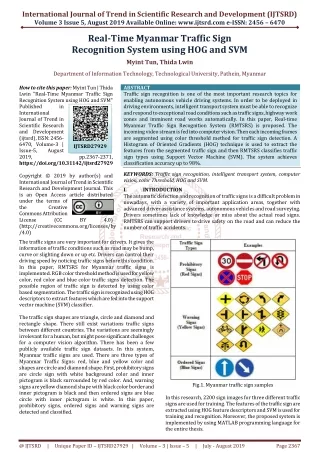
International Journal of Trend in Scientific Research and Development (IJTSRD) Volume 3 Issue 5, August 2019 Available Online: www.ijtsrd.com e-ISSN: 2456 – 6470 Real-Time Myanmar Traffic Sign Recognition System using HOG and SVM Myint Tun, Thida Lwin Department of Information Technology, Technological University, Pathein, Myanmar How to cite this paper: Myint Tun | Thida Lwin "Real-Time Myanmar Traffic Sign Recognition System using HOG and SVM" Published in International Journal of Trend in Scientific Research and Development (ijtsrd), ISSN: 2456- 6470, Volume-3 | Issue-5, August 2019, https://doi.org/10.31142/ijtsrd27929 Copyright © 2019 by author(s) and International Journal of Trend in Scientific Research and Development Journal. This is an Open Access article distributed under the terms of the Creative Commons Attribution License (CC (http://creativecommons.org/licenses/by /4.0) The traffic signs are very important for drivers. It gives the information of traffic conditions such as road may be bump, curve or slighting down or up etc. Drivers can control their driving speed by noticing traffic signs before this condition. In this paper, RMTSRS for Myanmar traffic signs is implemented. RGB color threshold method is used for yellow color, red color and blue color traffic signs detection. The possible region of traffic sign is detected by using color based segmentation. The traffic sign is recognized using HOG descriptors to extract features which are fed into the support vector machine (SVM) classifier. The traffic sign shapes are triangle, circle and diamond and rectangle shape. There still exist variations traffic signs between different countries. The variations are seemingly irrelevant for a human, but might pose significant challenges for a computer vision algorithm. There has been a few publicly available traffic sign datasets. In this system, Myanmar traffic signs are used. There are three types of Myanmar Traffic Signs: red, blue and yellow color and shapes are circle and diamond shape. First, prohibitory signs are circle sign with white background color and inner pictogram is black surrounded by red color. And, warning signs are yellow diamond shape with black color border and inner pictogram is black and then ordered signs are blue circle with inner pictogram is white. In this paper, prohibitory signs, ordered signs and warning signs are detected and classified. ABSTRACT Traffic sign recognition is one of the most important research topics for enabling autonomous vehicle driving systems. In order to be deployed in driving environments, intelligent transport system must be able to recognize and respond to exceptional road conditions such as traffic signs, highway work zones and imminent road works automatically. In this paper, Real-time Myanmar Traffic Sign Recognition System (RMTSRS) is proposed. The incoming video stream is fed into computer vision. Then each incoming frames are segmented using color threshold method for traffic sign detection. A Histogram of Oriented Gradients (HOG) technique is used to extract the features from the segmented traffic sign and then RMTSRS classifies traffic sign types using Support Vector Machine (SVM). The system achieves classification accuracy up to 98%. KEYWORDS: Traffic sign recognition, intelligent transport system, computer vision, color Threshold, HOG and SVM. I. INTRODUCTION The automatic detection and recognition of traffic signs is a difficult problem in nowadays, with a variety of important application areas, together with advanced driver assistance systems, autonomous vehicles and road surveying. Drivers sometimes lack of knowledge or miss about the actual road signs. RMTSRS can support drivers to drive safety on the road and can reduce the number of traffic accidents. IJTSRD27929 pp.2367-2371, BY 4.0) Fig.1. Myanmar traffic sign samples In this research, 2200 sign images for three different traffic signs are used for training. The features of the traffic sign are extracted using HOG feature descriptors and SVM is used for training and recognition. Moreover, the proposed system is implemented by using MATLAB programming language for the entire thesis. @ IJTSRD | Unique Paper ID – IJTSRD27929 | Volume – 3 | Issue – 5 | July - August 2019 Page 2367
International Journal of Trend in Scientific Research and Development (IJTSRD) @ www.ijtsrd.com eISSN: 2456-6470 II. Vavili Andrey and Kang Hyun Jo [1] proposed the detection and recognition algorithm for road signs of different category. As color and shape of traffic symbol provides vital information, they used the RGB color space to detect the symbol. Again to fight with changing conditions due to lighting and weather such as dark illumination, rainy and foggy weather, two restriction rules are used. First rule is bounding constraints for each color component which provides good detection result in images in good lighting condition. Second rule is using normalized color information and allows sign detection in dark images. Shape of information sign is different from the shape of warning and restricting sign. So the recognition process used here depends upon the shape of sign. Sign candidate is extracted from image and classified it as circle or triangle using background shape histograms. Then inner part of the mask is converted into binary mask and template matching algorithm is used for final recognition. Particularly in this paper, author tries to find out the inner meaningful part with the help of template matching. The researcher applied their proposed algorithm for lane limit detection to consider as new Region of Interest and used a thresholding on each of HSV component. Then they used a closed morphology operation and bounding box characteristic (height, width, area) for all potential regions [2]. Gunjan, C. and Dhotre, M. R. [3] presented a methodology using both color and shape information for road sign detection and recognition system. The detection is obtained through color segmentation using HSV color space and the shape properties of the road signs using Hough Transform. In recognition phase, the regions of interest are represented using Histogram of Oriented Gradients descriptors and are fed into trained SVMs in order to be recognized and finally the driver is alerted by providing voice indication of the recognized sign. Zakir,et al. [4] focused on detailed analysis of the performance on six color spaces: CIELab, YCbCr, YIQ, CYMK, RGB and HSV in color based segmentation or detection of road signs. Experiments were carried out to determine the best value ranges of individual color space components when used in conjunction with segmenting red, green and blue road signs under varying illumination and environmental conditions. Results indicate thatthe most robust segmentation performance is obtainedwhen HSV colour space is used. Woong-Jae Won, SungmoonJeong, and Minho Lee [5] proposed new preprocessing method for detecting traffic symbol based on visual salience map model. As the traffic symbols have dominant color contrast against environment, color information with center surround difference normalization is used as an input feature extraction to reduce the noise influence as well as intensify the color characteristics. Edge feature map is used to reflect the shape characteristics of traffic symbol. The weighted sum of color feature map and edge feature map finally constructs traffic symbol saliency map. The system detects candidate regions as maximally stable external regions (MSERs), which offers robustness to the various lightning conditions. Recognition is based on cascade of support vector machine (SVM) classifiers that were trained using histogram oriented gradient (HOG) features. Firstly, two way integration method including both methods derived by task and methods RELATED WORKS derived by data is used for segmentation, which improves accuracy of detection. And then edge extraction and morphological operations are used to obtain enclosed area. The shape of enclosed area is determined by the circularity and central double cross shape measurement in order to detect the prohibition signs. Romdhane et al. [6] calculated HOG features and used SVM classifier for recognition traffic signs. They applied the Lucas-Kanade tracker to find the traffic sign in the next frame. In this work, they combined Gabor features, local binary patterns and histogram of oriented gradients within a support vector machine classification framework. III. BACKGROUND THEORY RMTSRS has two phases: detection and recognition. In traffic sign detection, each incoming frame is fed into computer vision and segmented using RGB thresholding method and applied morphological operation. If a traffic sign is detected, it is bounded by a rectangular box. To extract features from the detected traffic sign, HOG feature descriptor is used. And then the extracted features are fed into the SVM classifier. In this system, ordered signs, warning signs and prohibitory signs are detected and classified. A.Viola-Jones Object Detection Framework The Viola–Jones object detection framework is the first object detection framework to provide competitive object detection rates in real-time proposed in 2001 by Paul Viola and Michael Jones. To detect vision based object in real time, this algorithm is used. B.Color Segmentation using Threshold Method Image segmentation is the process of separating or grouping an image into different parts. Color segmentation is used to generate an image with foreground pixels and background pixels using threshold ranges or algorithms about color information such as red, green and blue and so on. Color thresholding is used to divide pixels of an image into object pixels and background pixels. A pixel is called object pixel if its color is close enough to a reference color, if not it will be background pixel [7]. In this process, thresholding based on both RGB color method detects yellow color, blue color, and red color traffic sign in the frame. For describing an image, RGB (Red, Green, Blue) basic color space is commonly used. RGB is three dimensional in its nature whose values vary from 0 to 255. Pure red value is represented by (255,0,0), pure green value by (0,255,0) and pure blue value by (0,0,255). Each frame element is classified according to its red, green, blue color. A pixel color is considered as red, yellow or blue using the threshold values. Therefore, color segmentation algorithms have the ability to modify or manipulate the color values expressed by an image. It is applied to filter out image regions that have color characteristics similar to the color found in one of the specific colors known to the system. The threshold values used for color segmentation on RGB color space are shown in the following table. Table 1 RGB threshold values @ IJTSRD | Unique Paper ID – IJTSRD27929 | Volume – 3 | Issue – 5 | July - August 2019 Page 2368
International Journal of Trend in Scientific Research and Development (IJTSRD) @ www.ijtsrd.com eISSN: 2456-6470 C.HOG Feature Extraction In order to recognize the types of traffic sign, many methods have been proposed for obtaining the feature vectors of ROI. In this work, HOG feature descriptors is used to get feature vectors for training SVM. HOG feature vectors are calculated for each candidate region. The HOG features are computed on a dense grid of cells using local contrast normalization on overlapping blocks. Each block, in turn, is divided into non overlapping cells. The gradient orientation and magnitude are computed for each pixel. A histogram of these orientations is formed for each cell. The magnitude of the gradient is used as a vote weight. The gradient magnitude and orientation is given by Where: ||x-y||2 is the squared Euclidean distance between the two feature vectors. σ is the free parameter. SVM is designed to solve a binary classification problem. However, for a road sign inventory problem, which is a multiple classification problem, accomplished through combinations of binary classification problems. There are two ways to do that: one vs. one or one vs. all. Finally, a SVM will be trained for each class, and SVMs of all classes are combined to form a multiclass SVM. IV. DESIGN OF THE PROPOSED SYSTEM The design of the proposed system is shown in Figure The incoming video stream is fed into the computer vision. Then each frame is segmented to separate foreground pixels and background pixels using threshold ranges. After segmentation, closed morphology operation and bounding box characteristics (height, width, area) are used for all potential regions. Then the traffic sign is detected and if it is found, it is bounded by a rectangle and then cropped from incoming frame. After getting the detected traffic sign, its features are extracted using HOG feature descriptor. Then the feature vector is fed to SVM classifier. In SVM, it matches between the features of the detected sign and the traffic signs stored in the database. Finally, the recognized traffic sign is shown. classification is Where G(x, y) is gradient magnitude, α(x, y) is gradient direction, Gx(x, y) is horizontal gradient, and G y(x, y) is vertical gradient. A nine-bin histogram of unsigned pixel orientations weighted by magnitude is created for each cell. These histograms are normalized over each overlapping block. The components of the feature vector are the values from the histogram of eachnormalized cell.image divided into cells and an example HOG block that consists of four cells. The size N of the HOG feature vector is computed using: Where R is the region, M is the cell size, B is the number of cells per block, and H is the number of histogram per cell. In this proposed method, each potential traffic sign region is normalized to 80×80 pixels. The HOG features are extracted from each one of the local region. To compute HOG feature, a candidate image is divided into cells with size 8 × 8 pixels and blocks with size 2 × 2. A histogram of gradient orientation with nine bins will be generated for each cell. In the end, a feature vector will represent the HOG feature of the candidate region. D.Support Vector Machine (SVM) SVM is a supervised machine learning algorithm which can be used for both classification or regression analysis.SVMs are used to extend our study of classifiers for TSR. The algorithm attempts to separate the positive examples of negative examples. The basic concept of SVM is to transform the input vectors to a higher dimensional space by a nonlinear transform, and then an optical hyperplane that separates the data, can be found. This hyperplane should have the best generalization capability. In many cases, the data cannot be separated by a linear function. The use of a kernel function becomes essential in these cases.Three admissible kernel functions are Polynomial kernel of degree h Gaussian radial basis function kernel Sigmoid kernel Gaussian radial basis function kernel for training and classification will make prediction accuracy highest. The form of kernel function is as follows: Fig.2.The Flow Chart of the Proposed System @ IJTSRD | Unique Paper ID – IJTSRD27929 | Volume – 3 | Issue – 5 | July - August 2019 Page 2369
International Journal of Trend in Scientific Research and Development (IJTSRD) @ www.ijtsrd.com eISSN: 2456-6470 V. In this paper, incoming video stream that is tested in this experimental is detected whether it contains traffic sign of not. If it detects traffic sign, feature extraction and Classification processes are performed. For the three types of sign, 20 times for each type are tested in the experiment. The 220 Myanmar traffic sign images are trained according to color groups consisting of red, yellow and blue. All trained images are taken using smart phone and it consists of all variety of traffic signs of warning sign, prohibitory sign, and ordered sign. In this experiment, RMTSRS detects the incoming video stream. A traffic sign is detected and so it is segmented to separate foreground pixels and background pixels using color ranges. In color segmentation, thresholding, closed morphology operation and bounding box are applied to find the region of interest in the stream. The color information of traffic signs in this stream is blue. Images obtained by using threshold ranges for color segmentation is shown in Figure 3. EXPERIMENTAL RESULT AND DISCUSSION After detecting the traffic sign, the detected traffic sign is cropped from the frame and it is resized to 80×80 pixels for recognizing types of traffic sign. From the resized sign, the features are extracted HOG feature descriptor. That features are fed into the SVM classifier in order to classify the sign. Finally, the SVM shows the recognized traffic sign. The resized image and HOG featured images are illustrated as shown in Figure 6. (a) (b) Fig.6. (a) Resized Image (b) HOG featured image The proposed system for traffic sign recognition attains a classification accuracy of 98%. Fig.3. Traffic sign obtained by using color segmentation Then, closed morphology operation and bounding box characteristic are used to get only traffic sign region. Figure 4 shows the detected traffic sign after morphology operation. Fig.4. Result of detected traffic sign Then, the candidate sign is detected and bounded by a rectangle. Figure 5 shows the final detection results by the proposed detection method. Fig.9. Recognition Result VI. In this paper, RMTSRS for Myanmar traffic sign (red, yellow and blue color) is proposed. In this proposed system, a very simple and accurate detection method is used. And SVM classifies the detected signs with accurate feature extraction algorithm. The experimental results indicate that the proposed system is strong against non-uniform illuminations of traffic signs. The proposed recognition system can be extended to detect and recognize the road signs in complex background scenario by using high definition video camera. CONCLUSIONS Fig.5. Final DetectionResult @ IJTSRD | Unique Paper ID – IJTSRD27929 | Volume – 3 | Issue – 5 | July - August 2019 Page 2370
International Journal of Trend in Scientific Research and Development (IJTSRD) @ www.ijtsrd.com eISSN: 2456-6470 REFERENCES [1]V. Andrey and J. Kang-Hyun.Automatic detection and recognition of traffic symbols using geometric structure analysis.in Proc. SICE-ICASE Int. Joint Conf, pages 1451–1456, and 2006. Comparative Computer Graphics and Imaging, February 2010. Study”, International Conference [5]Woong-Jae Won, SungmoonJeong, and Minho Lee, Road traffic sign saliency map model, in Proc. Image and Vision Computing, New Zealand, pages 91–96, 2007. [2]Romdhane, N.B., Mliki, H. and Hammami, M., 2016, June. An improved traffic signs recognition and tracking method for driver assistance system. In Computer and Information Science (ICIS), 2016 IEEE/ACIS 15th International Conference on (pp. 1-6). IEEE. [6]Romdhane, N.B., Mliki, H. and Hammami, M., 2016, June. An improved traffic signs recognition and tracking method for driver assistance system. In Computer and Information Science (ICIS), 2016 IEEE/ACIS 15th International Conference on (pp. 1-6). IEEE. [3]G. Chandiramani and M. R. Dhotre, “Vision Based Road Sign Detection and Recognition”, International Journal of Scientific Engineering and Research, Vol. 3, No. 6, June 2015. [7]T. Surinwarangkoon, S. Nitsuwat and E. J. Moore, “Traffic Sign Recognition System for Roadside Images in Poor Condition”, International Journal of Machine Learning and Computing, vol. 3, No. 1, February 2013. [4]U. Zakir, A. N. J. Leonce and E. A. Edirisinghe, “Road Sign Segmentation Based on Colour Spaces: A @ IJTSRD | Unique Paper ID – IJTSRD27929 | Volume – 3 | Issue – 5 | July - August 2019 Page 2371