Download
1 / 8
80 likes | 87 Views
This research was conducted aimed at 1 Knowing the quality of products at Uncle K Restaurants, 2 Knowing the quality of services at Uncle Restaurants, 3 Knowing the influence of product quality on customer satisfaction at Uncle K Restaurants, 4 Knowing the influence of service quality on customer satisfaction at Uncle K Restaurant, 5 Knowing simultaneously simultaneously the influence of product quality and service quality on customer satisfaction at Uncle K. Restaurant. This research is a quantitative descriptive method that uses numbers, starting from data collection, interpretation of the data, and the appearance of the results. The population in this study was consumers of Uncle K Restaurant during the study. The size of the research sample taken as many as 80 people is determined by the sample technique used in this study, namely, random sampling simple random sample sampling technique is named so because in taking the sample, researchers mix the subjects in the population so that all subjects were considered the same and data were collected using a Likert scale questionnaire that had 5 alternative answers. The results of this study indicate that 1 Product quality has a positive effect on customer satisfaction at Uncle K Restaurant, 2 Service quality has a positive effect on customer satisfaction at Uncle K Restaurant, 3 There is a positive influence between product quality and service quality to customer satisfaction in Uncle K Report with a correlation coefficient R of 0.728 and a coefficient of determination R 2 of 0.529. This means that 52.9 of customer satisfaction in Uncle K Restaurant are influenced by product quality and service quality, while the other 47.1 is determined. Robinson Nainggolan | Marasi Rustiani Hotmaida | Arisman Parhusip "Effect of Product Quality and Service Quality toward Customer Satisfaction (Case Study at K UNCLE Restaurant at PT. Benua Penta Global)" Published in International Journal of Trend in Scientific Research and Development (ijtsrd), ISSN: 2456-6470, Volume-3 | Issue-6 , October 2019, URL: https://www.ijtsrd.com/papers/ijtsrd29303.pdf Paper URL: https://www.ijtsrd.com/management/randd-management/29303/effect-of-product-quality-and-service-quality-toward-customer-satisfaction--case-study-at-k-uncle-restaurant-at-pt-benua-penta-global/robinson-nainggolan<br>

E N D
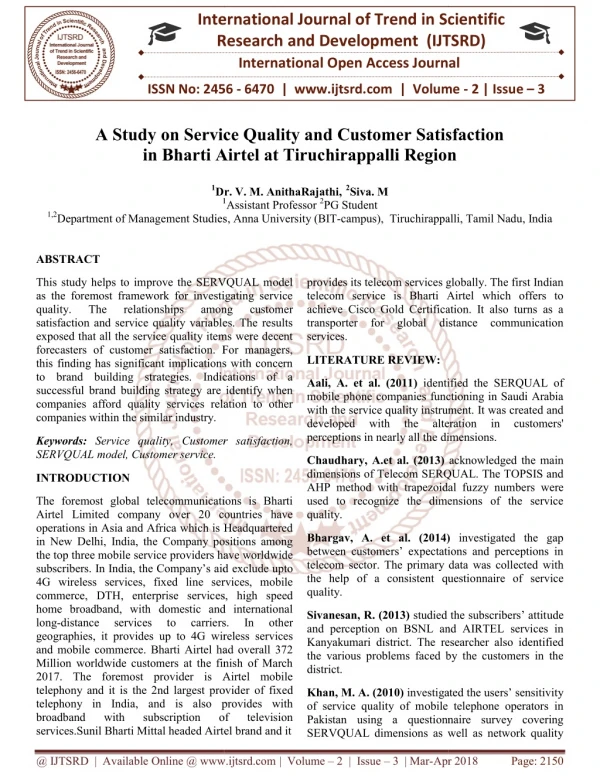
International Journal of Trend in Scientific Research and Development (IJTSRD) Volume 3 Issue 6, October 2019 Available Online: www.ijtsrd.com e-ISSN: 2456 – 6470 Effect of Product Quality and Service Quality toward Customer Satisfaction (Case Study at K UNCLE Restaurant at PT. Benua Penta Global) Robinson Nainggolan, Marasi Rustiani Hotmaida, Arisman Parhusip Sekolah Tinggi Ilmu Ekonomi LMII, Indonesia ABSTRACT This research was conducted aimed at: (1) Knowing the quality of products at Uncle K Restaurants, (2) Knowing the quality of services at Uncle Restaurants, (3) Knowing the influence of product quality on customer satisfaction at Uncle K Restaurants, (4) Knowing the influence of service quality on customer satisfaction at Uncle K Restaurant, (5) Knowing simultaneously (simultaneously) the influence of product quality and service quality on customer satisfaction at Uncle K. Restaurant. This research is a quantitative descriptive method that uses numbers, starting from data collection, interpretation of the data, and the appearance of the results. The population in this study was consumers of Uncle K Restaurant during the study. The size of the research sample taken as many as 80 people is determined by the sample technique used in this study, namely, random sampling (simple random sample) sampling technique is named so because in taking the sample, researchers "mix" the subjects in the population so that all subjects were considered the same and data were collected using a Likert scale questionnaire that had 5 alternative answers. The results of this study indicate that: (1) Product quality has a positive effect on customer satisfaction at Uncle K Restaurant, (2) Service quality has a positive effect on customer satisfaction at Uncle K Restaurant, (3) There is a positive influence between product quality and service quality to customer satisfaction in Uncle K Report with a correlation coefficient (R) of 0.728 and a coefficient of determination (R 2) of 0.529. This means that 52.9% of customer satisfaction in Uncle K Restaurant are influenced by product quality and service quality, while the other 47.1 % is determined. KEYWORDS: product quality, service quality, and customer satisfaction 1.Background In the current era of globalization, the business world is developing very rapidly, one of which is a business in the culinary field. A business in the field of food is one of the promising businesses because food is one of the basic human needs. Indonesia, with a large population, has diverse styles and behaviors, in general, it has a pragmatic nature, wants to be fast, practical, and comfortable. In a competition where companies must prioritize their respective advantages and strive to satisfy customers, one of them pay attention to the desires and needs of its customers. Product quality has generally been accepted as one of the fundamental elements of the overall consumer experience in restaurants. Product quality is all predetermined provisions related to product quality characteristics needed to satisfy the desires and expectations of consumers. In addition to product quality, service quality is also a factor influencing customer satisfaction. According to Zeithaml et. Al, 1990 in the book Fajar Laksana, 2017, which states that service quality can be defined as: "the extent of discrepancy between customers' expectations or desires perceptions". Service quality must begin with customer needs and end with customer satisfaction and positive perceptions of service quality as those who buy and consume How to cite this paper: Robinson Nainggolan | Marasi Rustiani Hotmaida | Arisman Parhusip "Effect of Product Quality and Service Quality toward Customer Satisfaction (Case Study at K UNCLE Restaurant at PT. Benua Penta Global)" Published in International Journal of Trend in Scientific Research and Development (ijtsrd), ISSN: 2456- 6470, Volume-3 | Issue-6, October 2019, pp.1186- 1193, URL: https://www.ijtsrd.com/papers/ijtsrd29 303.pdf Copyright © 2019 by author(s) and International Journal of Trend in Scientific Research and Development Journal. This is an Open Access article distributed under the terms of the Creative Commons Attribution License (CC (http://creativecommons.org/licenses/by /4.0) IJTSRD29303 BY 4.0) products / services, consumers who judge the level of service quality of a company. Uncle K Restaurant is one of the restaurants owned by PT Benua Penta Global located on Jl. KH Zainul Arifin. No, 7 Hulu, Medan Polonia, Kota Medan, North Sumatra precisely at SUN PLAZA, which is located on the 4th floor. And has a branch of Uncle K restaurant at Center Point. 2.Formulation of the problem How much influence does product quality and service quality together on customer satisfaction at the UNCLE K restaurant in PT Benua Penta Global Medan? 3.Research purposes Based on the background and the formulation of the problem above, the research objectives are as follows:To find out how much influence the quality of products and service quality together with customer satisfaction at the UNCLE K restaurant in PT Benua Penta Global Medan. 4.Product quality According to Lila Bismala, 2012, emphasized that quality can be interpreted in many different contexts and perceptions and tends to keep on changing. quality will be and their @ IJTSRD | Unique Paper ID – IJTSRD29303 | Volume – 3 | Issue – 6 | September - October 2019 Page 1186
International Journal of Trend in Scientific Research and Development (IJTSRD) @ www.ijtsrd.com eISSN: 2456-6470 perceived according to different individuals in general, quality will be related to customer satisfaction. According to David Garvin in the book Fajar Laksana, 2017, including in that dimension include: A.Function (Performance). The function here refers to the character of the core product which includes measurable attributes. The function of some products is usually based on the subjective preferences of the grill which are basically general (universal). B.Features (Features ). Can be in the form of additional products from a core product that can add value to a product. The features of a product are usually measured subjectively by each individual (in this case consumers) which shows the differences in the quality of a product / service. Thus, the development of the quality of a product requires the character of flexibility in order to adjust to market demand. C.Reliability. This dimension is related to the emergence of the possibility of a product experiencing a state of non-functioning in a period. The reliability of a product that signifies the level of quality is very meaningful for consumers in choosing a product. This makes it even more important considering the amount of replacement and maintenance costs that must be incurred if a product that is considered reliable is damaged. D.Suitability (Conformance). This dimension that relates to the quality of an item is the conformity of the product to the standards in the industry. The suitability of a product in the service industry is measured and from the level of accuracy and completion time, including the calculation of errors that occur, delays that cannot be anticipated and some other errors. E.Product Age / Durability. Measuring the durability of a product includes economic and technical aspects, the durability of a product is defined as a number of uses obtained by someone before experiencing a decrease in. F.Service (Service Ability). Service capability can also be referred to as speed, competence, usability, and product is to improve. This dimension shows that consumers not only pay attention to the decline in product quality, but also the time before the product is stored, service scheduling, communication processes and staff, frequency of service repairs will damage the product, and other services. G.Aesthetics (Asthestics). Is the most subjective measurement dimension. The aesthetics of a product are seen through how a product is heard by consumers, how it looks outside a taste or smell. H.The quality of Perceived (Perceived Quality). Consumers do not always have complete information about the attributes of products and services. However, usually consumers have information about the product indirectly, for example through brands, names, and producing countries. Product resilience for example, can be very critical in measuring product quality. 5.Service quality According to Lewis & Booms, 1983, in the book Fandy Tjiptono, 2017, states the quality of service is "a measure of how good the level of service provided is able to match customer expectations". Based on this definition, service quality is determined by the company's ability to meet the needs and desires of customers in accordance with customer expectations. In other words, the main factors affecting service quality are the services that are expected by customers (excepted service) and the perception of the services (perceived service). According to Parasuman, Zeithaml, and Berry, 1985 in the book Fandy Tjiptono, 2017, found that there are 5 dimensions that determine service quality. The five main dimensions include: A.Reliability (Reliability) is the company's ability to provide appropriate services are presented accurately and reliably. Performance must be in accordance with customer expectations which means timeliness, the same service for all customers without errors, sympathetic attitude and with high accuracy. B.Responsiveness (Responsiveness) namely a willingness to help and provide a fast and accurate service to customers, with clear information delivery. C.Assurance and Assurance, namely knowledge, politeness and the ability of company employees to grow the trust of customers to the company which consists of several communication, credibility, security, competition and manners. D.Empathy (Empathy) is to give sincere and individual or personal attention given to customers by trying to understand consumer desires. E.Physical Evidence (Tangibles), namely the company's ability to demonstrate its existence to external parties. What is intended is that the company's appearance, capabilities and physical infrastructure and the state of the surrounding environment are tangible evidence and services provided. 6.Customer's satisfaction Kotler and Keller, 2012, stated that consumer satisfaction is a feeling of pleasure or disappointment with someone who appears after comparing the performance (results) of products thought to performance (results) expected. If performance is below expectations, consumers are not satisfied. If performance meets expectations, consumers are satisfied. If performance exceeds expectations, consumers are very satisfied or happy.affect consumer satisfaction, according to Fandy Tjiptono and Gregorius Candra, 2011 in Donni Priansa June, 2017 are as follows: A.Product. Good product services and meet the tastes and expectations of consumers. Products can create customer satisfaction. The basis for evaluating the service of this product includes: type of product quality or product quality and product inventory. B.Price. Price is a part that is attached to a product that reflects how big the quality of the product is. The basis for evaluating components including: @ IJTSRD | Unique Paper ID – IJTSRD29303 | Volume – 3 | Issue – 6 | September - October 2019 Page 1187
International Journal of Trend in Scientific Research and Development (IJTSRD) @ www.ijtsrd.com eISSN: 2456-6470 prices includes the level of prices and compatibility with the product sale value, variations or price choices for the product. C.Promotion. The basis of promotional research regarding company, product and service information in an effort to communicate the benefits of these products and services to target consumers. Research in this case includes advertising of products and services, discounting goods and giving gifts. D.Place. The place is part of the company's attributes in the form of company and consumer location. Evaluation of location attributes includes company location, speed, accuracy and transportation. E.Employee Services. Employee services are services provided by employees in an effort to meet the needs and desires of consumers in an effort to satisfy consumers. The basic assessment in this case employee service includes: politeness, friendliness, speed, and accuracy. F.Amenities. The facility is part of the company's attributes in the form of an intermediary to support the smooth operation of the company dealing with consumers. Basis of assessment includes the arrangement of goods, place of storage of goods, restrooms, and places of worship. G.Atmosphere. The atmosphere is a supporting factor, because if the company is impressive then consumers get their own satisfaction. Basis of assessment includes air circulation, comfort, and safety. 7.Prior Research 1.Oldy Ardhana, 2010, entitled "Analysis of the Effect of Service Quality, Price, and Location on Customer Satisfaction (Study at Caesar's Workshop Semarang)". 8.A framework for Thinking In research that uses more than one variable, the compilation of thinking framework must be made so that people can easily understand the thought flow that has been raised by the researcher. Product Quality X1 Customer Satisfacti Service Quality X2 Premise According to Melva Sitanggang and Togu Harlen Lbn Raja, 2011 , the premise is the basis of logic / basic thoughts that form a process of reasoning based on logic that seeks to connect two different propositions to draw a conclusion. The premise can also be said as a statement that supports the hypothesis which is associated with previous research that has a relationship with research that is being done by someone. In the research, the premise is used as a basis for conclusions based on the results of previous studies, namely: Premise 1 Oldy Ardhana, 2010, stated that the quality of service under study proved that service quality had a positive effect on customer satisfaction of 58.4 % from the results of Adjusted R Square of 0. 584. Premise 2 Kartika Nur Rahmawati, 2017, stated that the quality of products and services together had a positive influence on customer satisfaction by 60.80%. Premise 3 Abdul Basith, 2014, stated in his research that there was a positive influence between product quality on customer satisfaction with value (p 0.05) and service quality on customer satisfaction with value (p> 0.05). Premise 4 Rina Sukmawati, 2017, stated in her research that there was a positive influence of the product quality and service quality variables together with consumer satisfaction by 72% with a calculated value of 83,089. Premise 5 Bayou Hadyanto, et al, 2007, stated in his research that there is product quality and service quality has a positive effect on customer satisfaction by 54.8% of the results of Adjusted R Square of 0. 548. Premise 6 Donor Guarantee Septiani, 2018 stated in his research that product quality and service quality simultaneously had a positive effect on customer satisfaction, with a calculated F value of 46%. Premise 7 Elfin Bahar & Herman Sjaharuddin, 2015, stated in his research that Product Quality and Service Quality affect Consumer Satisfaction at McDonald's Aladdin Makasar with 80 respondents. 2.Kartika Nur Rahmawati, 2017 entitled The Effect of Products and Services on Consumer Satisfaction in the Klaten Noble Shop. 3.Abdul Basith, 2014, entitled Effect of Product Quality and Service Quality, Customer Satisfaction and Customer Loyalita on De'Pans Pancake and Waffle in the city of Malang. 4.Rina Sukmawati, 2017 entitled The Effect of Product Quality, Price, and Service on Consumer Satisfaction of Garden Café Cooperatives of Yogyakarta State University Student Cooperatives. 5.Bayou Hadyanto, et al, 2007 entitled Analysis of the Effect of Products and Service Quality on Consumer Satisfaction in Puri Mediterania Semarang Housing. 6.Donor Guarantee Septiani, 2018 entitled The Effect of Product Quality and Service Quality on Consumer Satisfaction in Waroeng Jeans Jalan P. Antasari, Samarinda City. 7.Elfin Bahar & Herman Sjaharuddin, 2015, stated in his research that Product Quality and Service Quality affect Consumer Satisfaction at McDonald's Aladdin Makasar. @ IJTSRD | Unique Paper ID – IJTSRD29303 | Volume – 3 | Issue – 6 | September - October 2019 Page 1188
International Journal of Trend in Scientific Research and Development (IJTSRD) @ www.ijtsrd.com eISSN: 2456-6470 9.Hypothesis The hypothesis originate from the Greek language: Hupo which means temporary and thesis, which means statement or theory, so that the hypothesis can be interpreted as a temporary statement that must be verified (Melva Sitanggang and Togu Harlen Lbn. Raja, 2011). 1.Product quality (X 1) has a positive effect on customer satisfaction (Y) at PT Benua Penta Global. 2.Quality of service (X 2) has a positive effect on customer satisfaction (Y) at PT Benua Penta Global. 3.Product quality (X 1) and service quality (X 2) together have a positive effect on customer satisfaction (Y) at PT Benua Penta Global. 10.Research methods 10.1.Research Sites This research was conducted in one of the restaurants owned by PT Benua Penta Global, Uncle K restaurant located on Jl.KH Zainul Arifin. No, 7 Hulu, Medan Polonia, Medan City, North Sumatra precisely at SUN PLAZA, which is located on the 4th floor. 10.2.Types and Sources of Data In this study the data used are primary data and secondary data collected using research instruments in the form of questionnaires / questionnaires, interviews, documentation and observation. The research instrument is a tool used in the context of collecting data obtained from its source and representing existing research objects and relating to the root cause. In this study used through quantitative descriptive methods that use numbers, ranging from data collection, interpretation of the data, as well as the appearance of the results. Likewise, the understanding will study conclusions would be better if accompanied by tables, graphs, charts, images, or other display (Suharsimi Arikunto, 2017). 11.Research Results and Discussion 11.1.Test Validity 10.2.1.Primary Data Sources. Primary data is data obtained directly through interviews with owners or managers, and information collected from answers to information through a questionnaire filled out by visitors to PT Benua Penta Global. 10.2.2.Secondary Data Sources. Data is obtained from the bibliography through several journals, books and articles taken from the internet to get what is needed by the researcher. 10.3.Population and Samples According to Nanang Martono, 2010 in Melva Sitanggang, 2011 said that the population is the whole object or subject that is in an area and meets certain requirements relating to the research problem or the whole unit or individual within the scope to be examined. The population in this study are consumers who come to the UNCLE K restaurant owned by PT Benua Penta Global that are randomly met to be used as a sample to meet the number found. The population in this study is every consumer who is buying / eating at the UNCLE K restaurant during July to August 2019 as many 800 people. According to Melva Sitanggang and Togu Harlen Lbn. Raja, 2011 states that the sample departs from the population, which is the unit of analysis in conducting research for someone in solving research problems that are happening in the field. Suharsimi Arikunto, 2017, asserted that if the number of respondents is less than 100 people, then all samples will be taken, whereas if the number of respondents is more than 100 people, then sampling is 10% - 15% and 20% -25% or more. Based on the formula the sample in this study was 10% of the total population, then 800 x 10% = 80, so the number of samples in this study were as many as 80 respondents. Item-Total Statistics Scale Variance if Item Deleted 110,678 108,489 108,489 108,489 108,489 108,489 109.122 109.122 110,178 110,178 111,511 108,489 108,489 108,489 109.122 111,067 109,611 109,611 109,611 109,611 Scale Mean if Item Deleted 109.7000 109,6000 109,6000 109,6000 109,6000 109,6000 109.7000 109.7000 109,8000 109,8000 109,8000 109,6000 109,6000 109,6000 109.7000 109,8000 109.5000 109.5000 109.5000 109.5000 Corrected Item- Total Correlation .711 .938 .938 .938 .938 .938 .858 .858 .775 .775 648 .938 .938 .938 .858 .690 .890 .890 .890 .890 Cronbach's Alpha if Item Deleted .985 .983 .983 .983 .983 .983 984 984 984 984 .985 .983 .983 .983 984 .985 984 984 984 984 K. Products K. Products K. Products K. Products K. Products K. Service K. Service K. Service K. Service K. Service K. Service K. Service K. Service K. Service K. Service K. Customers K. Customers K. Customers K. Customers K. Customers @ IJTSRD | Unique Paper ID – IJTSRD29303 | Volume – 3 | Issue – 6 | September - October 2019 Page 1189
International Journal of Trend in Scientific Research and Development (IJTSRD) @ www.ijtsrd.com eISSN: 2456-6470 K. Customers K. Customers K. Customers K. Customers K. Customers 109,6000 109.7000 109.7000 109.5000 109.5000 110,711 111,344 111,344 109,611 109,611 .724 649 649 .890 .890 984 .985 .985 984 984 Based on the terterter table shows that the results of the correlation coefficient of all items with a total score above 0.6, so that all items can be declared valid. 11.2.Reliability Cronbach's Alpha N of Items .946 According to Nunnally, 1994 in the book Imam Ghozali, 2016 based on the reliability test between product quality and service quality variables to customer satisfaction in accordance with the table below with a Cronbach's Alpha value of 0.946. It can be concluded that the Cronbach's Alpha greater than 0 , 70 (0.946> 0.70) then item questionnaire in this study revealed reliable. 11.3.Classical Assumption Test 11.3.1.Normality Test 25 By looking at the normal p-plot graph display on SPSS 16 data it can be concluded that the data spreads around the diagonal line and follows the direction of the diagonal line, so in this study the regression model fulfills the normality assumption. 11.3.2.Multicollinearity Test. Coefficients a Unstandardized Coefficients Coefficients B Std. Error Beta (Constant) 16,849 3,425 Product quality .392 .138 252 Service quality .470 .73 574 customer satisfaction Based on the data processing results in the table above, it can be seen that the tolerance value of all independent variables is greater than the accuracy value of 0.10 and the VIF value of all independent variables is smaller than the accuracy of 10 (VIF ≤ 10). Therefore, the data in this study are said to have no multicollinearity. 11.3.3.Heteroscedasticity Test. Standardized Collinearity Statistics Model t Sig. Tolerance VIF 4,919 2,844 6,476 .000 .006 .000 1 .778 .778 1,286 1,286 From the picture above, it is known that there are no regular patterns, and the points spread above and below the number 0 on the Y axis, so there is no heteroscedasticity. @ IJTSRD | Unique Paper ID – IJTSRD29303 | Volume – 3 | Issue – 6 | September - October 2019 Page 1190
International Journal of Trend in Scientific Research and Development (IJTSRD) @ www.ijtsrd.com eISSN: 2456-6470 11.4. Results of the Multiple Regression Equations Coefficients a Unstandardized Coefficients Standardized Coefficients B Std. Error 16,849 3,425 .392 .138 .470 .73 Model t Sig. Beta (Constant) Product quality Quality P elayanan 4,919 .000 2,844 .006 6,476 .000 1 252 574 Y = a + B 1 X 1 + B 2 X 2 Based on the results of the ship's 16 program output on the coefficients describing the regression equation: Y = 16,849 + 0,392+ 0,470 Where: a: The constant number of Unstandardized Coefficients is 16,849. B 1: The first regression coefficient number at X 1 (Product Quality) is 0.392. B 2: The second regression coefficient number at X 2 (Service Quality) is 0.470 11.5. Hypothesis Test 11.5.1.Effect of Product Quality on Customer Satisfaction Coefficients a Unstandardized Coefficients Standardized Coefficients B Std. Error 16,849 3,425 .392 .138 .470 .73 Model T Sig. Beta (Constant) Product quality Quality P elayanan 4,919 .000 2,844 .006 6,476 .000 1 252 574 Based on the output of the 16th spss program on coefficients on the first regression coefficient the price variable shows the result of count 2.844 > 1.658, it can be said that the product quality variable has a positive and partially significant effect on consumer satisfaction on Uncle K. Restaurants. This means, on the quality of the product Ha rejected and Ho accepted. 11.5.2.Effect of Service Quality on Customer Satisfaction Coefficients a Unstandardized Coefficients Standardized Coefficients B Std. Error (Constant) 16,849 3,425 Product quality .392 .138 Quality P elayanan .470 .73 Based on the outputs of the SPSS 16 program on the coefficients on the first regression coefficient the price variable shows the results of tcount 6.476 > 1.658 , it can be said that the service quality variable has a positive and partially significant effect on consumer satisfaction at Uncle K. Restaurants. This means, on the quality of the product Ha rejected and Ho accepted. 11.5.3.Effect of Product Quality and Service Quality on Customer Satisfaction n Model Sum of Squares df Regression 424,063 Residual 376,925 77 Total 800,987 79 Based on the outputs of the SPSS 16 program in the ANNOVA table, the F-count value of 43, 315 > 3.00 so that H0 is rejected and H1 is accepted , then the product quality and service quality together are positive and significant to customer satisfaction at Uncle K Restaurant . . 11.6. Coefficient of Determination Summary Model b Model R R Square Adjusted R Square Std. Error of the Estimate 1 .728 a .529 .517 From the above table the numbers of determination (R 2) of 0.529 indicates that the quality of the product (X 1) and quality of service (X 2) effect on customer satisfaction 52.9%, while the remaining 47.1% can be explained by other factors that are not examined in this study. Model T Sig. Beta 4,919 .000 2,844 .006 6,476 .000 1 252 574 Mean Square 212,031 4,895 F Sig. 2 43,315 .000 a 1 2.21249 @ IJTSRD | Unique Paper ID – IJTSRD29303 | Volume – 3 | Issue – 6 | September - October 2019 Page 1191
International Journal of Trend in Scientific Research and Development (IJTSRD) @ www.ijtsrd.com eISSN: 2456-6470 12.Analysis and Evaluation 12.1.Effect of Product Quality (X 1) on Customer Satisfaction (Y) From the hypothesis test found that product quality has a significant influence on customer satisfaction in Uncle K Restaurants. This shows that the quality of the product determined greatly determines customer satisfaction at Uncle k Restaurants, which is marked by a t count of 2.844 with a significant level of 0.006 0.5. From these results indicate that product quality has a positive effect on customer satisfaction at Uncle K restaurants in 0.392 and if increased by 39.2%. Based on the description above, it can be seen that the quality of the products available at Uncle K Restaurant has given a good perception from customers, this can be seen by the significant influence of product quality to customer satisfaction. 12.2.Effect of Service Quality (X 2) on Customer Satisfaction (Y) From the hypothesis test found that service quality has a significant effect on customer satisfaction at Uncle K. Restaurant This shows that the quality of the product determined greatly determines customer satisfaction at the Uncle k Restaurant, which is marked by t arithmetic of 6.4 76 with a significant level 0,000 > 0.05. From these results indicate that the quality of service has a positive effect on customer satisfaction at Uncle K Restaurant by 0.470 and if increased by 47.0%. Based on the description above, it can be seen that the quality of the products available at Uncle K Restaurant has given a good perception from customers, this can be seen by the significant influence of service quality to customer satisfaction. 13.Conclusions Based on the results of data processing that has been done in this study, then in this chapter the author can draw conclusions about the study "The Effect of Product Quality and Service Quality on Customer Satisfaction in the Uncle K Restaurant at PT. The Global Penta Continent "is as follows: 1.From the analysis results obtained t count with sig t < alpha (0.006 <0.05) or a significance level of 0.006 which means that hypothesis 1 is suspected to have an influence on product quality on customer satisfaction at Uncle K Restaurant accepted. This indicates that the value of the coefficient of the quality of the product (X 1 ) amounted to 0,392, which means 39 , 2 %. Means by increasing the quality of the products provided, it will also increase customer satisfaction. 2.From the research results obtained t count with sign t alpha (0,000 0.05) or a significance level of 0,000 which means hypothesis 2 is suspected to have an influence on the service quality on customer satisfaction at Uncle K. Restaurant. This shows that the quality coefficient product (X 1) of 0.470, which means 47.0%. Means increasing the quality of services undertaken Uncle K Restaurant, the more increase customer satisfaction as well. 3.From the analysis of the research obtained F count <alpha (0,000 <0 , 05 ) which means that hypothesis 3 is suspected to have an influence on product quality and service quality on customer satisfaction at Uncle K Restaurant simultaneously acceptable. The test results of R 2 in this study was 0.529. That is 52 , 9 % variable customer satisfaction is influenced by the variable quality of the product (X 1) and quality of service (X 2), while the rest influenced by other variables not included in this study. Means of increasing the quality of the products provided and improving the quality of services performed, customer satisfaction will also increase. 14.Suggestions 1.It is expected that the Uncle K Medan Restaurant must maintain the quality of its products in terms of function, features, reliability, etc. so that the quality of the products provided at Uncle K Medan Restaurant can still attract and maintain customer satisfaction. 2.Party Uncle K Restaurant expected more attention to the factor of quality of service by way of set policy company serving customers in terms of physical evidence, reliability, responsiveness, assurance, empathy, and so that the quality of services provided Restaurant Uncle K can increase customer satisfaction. REFERENCES [1]Alma, Buchari. 2018. Marketing Management and Marketing Services. Revised Cv. Alfabeta. edition. Bandung: [2]Arikunto, Suharsimi. 2017. Research Procedure for a practical approach. Revised edition of Printed Matter. 14. Jakarta: Rineka Cipta. [3]Basith, Abdul, et al. 2014. The Effect of Product Quality and Service Quality on Customer Satisfaction and Customer Loyalty (Survey on De'Pans Pancake and Waffle Customers in Malang City). Journal of Business Administration Vol. 11 No. June 1, 2014. [4]Bismala, Management. First printing. Medan: Prime Publishing. Lila. 2012. Production Operations [5]Ghozali, Imam. 2016. Application of Mulitivariete Analysis. 8th edition. Semarang: Diponegoro University Publisher Agency [6]June, Priansa Donni. 2017. Consumer Behavior in Contemporary Business Competition. Prints to 1. Bandung Cv. Alfabeta. [7]Kotler, Philip and Gary Armstrong. 2012. Principles of marketing. Issue 13 volumes 1. Jakarta: Erlangga. [8]Like, Dawn. 2017. Marketing Management. Printing. 2: Education 1. Yogyakarta: Graha Science. [9]Lorita, Gita 2013. Scription ”Analysis of Performance Levels and Importance (Marketing Mix of Services at MBC Restaurants)". Indonesian education university. [10]Mulyono, Bayu, Hadyanto, et al 2007. Analysis of the Effect of Product Quality and Service Quality on Consumer Satisfaction (Case Study at Puri Mediterania Semarang Housing). Journal of Management & Organizational Studies Vol. 4 No. July 2, 2007. [11]Motung, Pamela, et al, 2015. Influence of Product Quality, Service Quality and Price Perception on Customer Satisfaction in Kawan Baru Restaurant. Periodical Journal of Scientific Efficiency Vol.15 No. 05 2015. [12]Oldy, Ardhana. 2010. Thesis "Analysis of the Influence of service quality, price, and location on customer satisfaction (study at a caesarean section in Semarang)" @ IJTSRD | Unique Paper ID – IJTSRD29303 | Volume – 3 | Issue – 6 | September - October 2019 Page 1192
International Journal of Trend in Scientific Research and Development (IJTSRD) @ www.ijtsrd.com eISSN: 2456-6470 [17]Sukmawati, Rina 2017. Thesis "Effect of Product Quality, Price, and Service on Consumer Satisfaction of Garden Cafes at Yogyakarta State University Student Cooperative". Economic Education Study Program, Faculty of Economics. Yogyakarta State University 2017. Faculty Semarang. of Economics. Diponegoro University [13]Rahmawati Kartikan Nur 2017. Thesis “The Effect of Product Quality and Services on Consumer Satisfaction (Study of the Klaten Nobility Restaurant)". Food Engineering Education Study Program. Yogyakarta State University. [18]Sugiyono, 2018. Educational Research Methods. 12th print. Bandung: Alfabeta. [14]Simamora, Bilson. 2013. Strategic Marketing. Print. 3: Edisike 1. South Tangerang: Open University. [19]Syaharuddin, Herman and Bahari, Arfiani 2015. Effect of Product Quality and Service Quality on Consumer Satisfaction and Repurchase Interest. Journal Organization and Management Vol. 3 Pg.14-34 Sep 2015. [15]Sitanggang, Melva. And Harlen Lbn. Raja Togu. Research Method. First printing. Medan: CV. Indah Karunia Jaya. of [16]Sulistyaningrum, Utami 2014. Thesis “The Effect of Product and Service Satisfaction (tappanyaki express restaurant chef study)." Food Engineering Education Yogyakarta State University. [20]Tjiptono, Fandy. 2017. Service Management. Second Edition. Yogyakarta: Andi Quality on Consumer [21]Winarti, Tias & Ibrahim, Mariaty 2017. Effect of Product Quality and Service Satisfaction. FISIP Journal Vol. 4 No. October 2, 2017. Study Program. Quality on Consumer @ IJTSRD | Unique Paper ID – IJTSRD29303 | Volume – 3 | Issue – 6 | September - October 2019 Page 1193