Download
1 / 6
60 likes | 67 Views
International trade plays an important role in the development of economy as a whole. India is the 19th largest exporter with a share of 1.7 to the total global trade and 10th largest importer with share of 2.65 to the global merchandise trade, according to the WTO ranking for the year 2018. International trade enables the countries to widen the scope of marketing for its output. Exports of goods and services of a nation provide better employment opportunities to the people and higher standard of living of home as well as host countries. Exports lead to increase the efficiency on the national output and productivity of factors of production. Export of a country may become a growth driver of national economy. Expansion of foreign trade may bring variety of benefits to the people and economy of the country. Dr. S Senthil | Dr. S Kowsalya "An Analysis on Indiau2019s Foreign Trade" Published in International Journal of Trend in Scientific Research and Development (ijtsrd), ISSN: 2456-6470, Volume-4 | Issue-3 , April 2020, URL: https://www.ijtsrd.com/papers/ijtsrd30785.pdf Paper Url :https://www.ijtsrd.com/economics/international-economics/30785/an-analysis-on-indiau2019s-foreign-trade/dr-s-senthil<br>

E N D
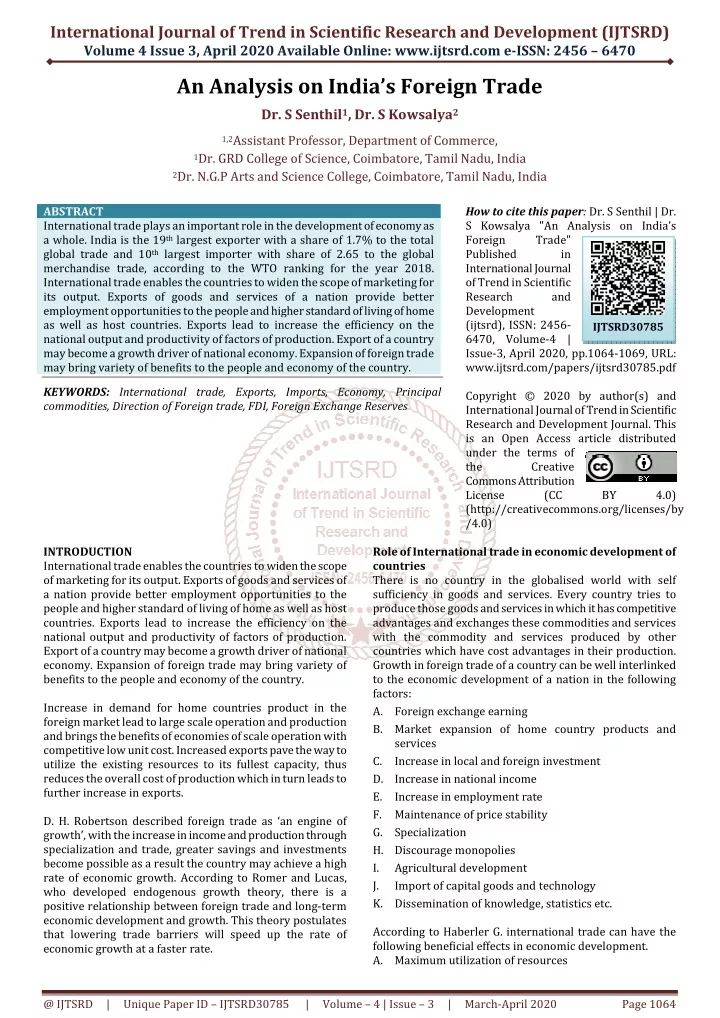
International Journal of Trend in Scientific Research and Development (IJTSRD) Volume 4 Issue 3, April 2020 Available Online: www.ijtsrd.com e-ISSN: 2456 – 6470 An Analysis on India’s Foreign Trade Dr. S Senthil1, Dr. S Kowsalya2 1,2Assistant Professor, Department of Commerce, 1Dr. GRD College of Science, Coimbatore, Tamil Nadu, India 2Dr. N.G.P Arts and Science College, Coimbatore, Tamil Nadu, India ABSTRACT International trade plays an important role in the development of economy as a whole. India is the 19th largest exporter with a share of 1.7% to the total global trade and 10th largest importer with share of 2.65 to the global merchandise trade, according to the WTO ranking for the year 2018. International trade enables the countries to widen the scope of marketing for its output. Exports of goods and services of a nation provide better employment opportunities to the people and higher standard of living of home as well as host countries. Exports lead to increase the efficiency on the national output and productivity of factors of production. Export of a country may become a growth driver of national economy. Expansion of foreign trade may bring variety of benefits to the people and economy of the country. KEYWORDS: International trade, Exports, Imports, Economy, Principal commodities, Direction of Foreign trade, FDI, Foreign Exchange Reserves How to cite this paper: Dr. S Senthil | Dr. S Kowsalya "An Analysis on India’s Foreign Trade" Published in International Journal of Trend in Scientific Research and Development (ijtsrd), ISSN: 2456- 6470, Volume-4 | Issue-3, April 2020, pp.1064-1069, URL: www.ijtsrd.com/papers/ijtsrd30785.pdf Copyright © 2020 by author(s) and International Journal of Trend in Scientific Research and Development Journal. This is an Open Access article distributed under the terms of the Creative Commons Attribution License (CC (http://creativecommons.org/licenses/by /4.0) Role of International trade in economic development of countries There is no country in the globalised world with self sufficiency in goods and services. Every country tries to produce those goods and services in which it has competitive advantages and exchanges these commodities and services with the commodity and services produced by other countries which have cost advantages in their production. Growth in foreign trade of a country can be well interlinked to the economic development of a nation in the following factors: A.Foreign exchange earning B.Market expansion of home country products and services C.Increase in local and foreign investment D.Increase in national income E.Increase in employment rate F.Maintenance of price stability G.Specialization H.Discourage monopolies I. Agricultural development J. Import of capital goods and technology K.Dissemination of knowledge, statistics etc. According to Haberler G. international trade can have the following beneficial effects in economic development. A.Maximum utilization of resources IJTSRD30785 BY 4.0) INTRODUCTION International trade enables the countries to widen the scope of marketing for its output. Exports of goods and services of a nation provide better employment opportunities to the people and higher standard of living of home as well as host countries. Exports lead to increase the efficiency on the national output and productivity of factors of production. Export of a country may become a growth driver of national economy. Expansion of foreign trade may bring variety of benefits to the people and economy of the country. Increase in demand for home countries product in the foreign market lead to large scale operation and production and brings the benefits of economies of scale operation with competitive low unit cost. Increased exports pave the way to utilize the existing resources to its fullest capacity, thus reduces the overall cost of production which in turn leads to further increase in exports. D. H. Robertson described foreign trade as ‘an engine of growth’, with the increase in income and production through specialization and trade, greater savings and investments become possible as a result the country may achieve a high rate of economic growth. According to Romer and Lucas, who developed endogenous growth theory, there is a positive relationship between foreign trade and long-term economic development and growth. This theory postulates that lowering trade barriers will speed up the rate of economic growth at a faster rate. @ IJTSRD | Unique Paper ID – IJTSRD30785 | Volume – 4 | Issue – 3 | March-April 2020 Page 1064
International Journal of Trend in Scientific Research and Development (IJTSRD) @ www.ijtsrd.com eISSN: 2456-6470 B.Division of labour and specialization C. Transmission of knowledge D.Capital and technology inflow E.Stimulating domestic demand F.Promoting competition. India’s Foreign Trade Through secular growth over the last three financial years, following the major downturn in the face of the global slowdown, merchandise exports for the year 2018-19(P) reached USD 330.07 Billion, the highest ever, surpassing the earlier peak of USD 314.4 Billion achieved in 2013-14. This has been achieved in a challenging global environment. The following growth drivers have shaped merchandise exports growth: ?Engineering Goods rose from USD 78,695.69 million in 2017-18 to USD 83,704.54 million in 2018-19, a growth of 6.36%. ?Petroleum Products rose from USD 37,465.10 million in 2017-18 to USD 47,954.54 million in 2018-19, a growth of 28%. ?Organic & Inorganic Chemicals rose from USD 18,508.48 million in 2017-18 to USD 22,573.87 million in 2018-19, a growth of 21.97%. ? Drugs & Pharmaceuticals rose from USD 17,282.81 million in 2017-18 to USD 19,188.46 million in 2018-19, a growth of 11.03%. ?Cotton Yarn/Fabs./made-ups, Handloom Products etc., rose from USD 10,260.38 million to USD 11,206.44 million in 2018-19, a growth of 9.22%. Analysis and interpretations India’s Foreign Trade from 2009-10 to 2018-19 (in Rupees – Billions) Exports Oil Non-Oil Total 2009-10 1329.0 7126.4 8455.3 2010-11 1887.8 9541.4 11429.2 4822.8 12011.9 16834.7 2011-12 2679.1 11980.5 14659.6 7430.8 16023.9 23454.6 2012-13 3308.2 13035.0 16343.2 8918.7 17772.9 26691.6 2013-14 3832.5 15217.6 19050.1 9978.9 17175.5 27154.3 2014-15 3460.8 15503.6 18964.5 8428.7 18942.1 27370.9 2015-16 1996.4 15167.5 17163.8 5405.1 19498.0 24903.1 2016-17 2115.1 16379.3 18494.3 5832.2 19944.6 25776.8 2017-18 2414.4 17150.8 19565.1 7003.2 23007.1 30010.3 2018-19 3259.3 19818.0 23077.2 9862.8 26084.0 35946.8 Source: Directorate General of Commercial Intelligence and Statistics, Kolkata. The above table shows the export and import performance of oil and non-oil items from the year 2009-10 to 2018-19. It is evident from the table that export of oil items rose from 1329.0 billion rupees in 2009-10 to 3259.3 billion rupees in 2018-19. Exports of non-oil items also showed a development of nearly 250% i.e from 7126.4 billion rupees in 2009-2010 to Rs. 19818.0 billion in 2018-19. Both oil and non-oil items of exports together showed a tremendous growth (around 275%) during the study period i.e it is increased from Rs. 8455.3 billion in 2009-10 to Rs. 23077.2 billion in 2018-19. Imports of oil items have increased from Rs. 4116.5 billion in 2009-10 to Rs. 9862.8 billion in 2018-19, showing a growth of more than 200%. Non –oil items are also showing an increase of Rs. 26084.0 billion in 2018-19 from Rs. 9520.9 billion in 2009- 10. Import of both oil and non-oil items are showing an increasing trend continuously form Rs. 13637.4 billion in 2009-10 to Rs. 35946.8 billion in 2018-19. During the study period, though both exports and imports are overwhelmingly increased trade deficit (negative balance) has also increased from Rs. 5182.0 billion to Rs. 12869.5 billion in 2018-19. ?Electronic Goods rose from USD 6,393.12 million in 2017-18 to USD 8,880.96 million in 2018-19, a growth of 38.91%. ?Plastic & Linoleum rose from USD 6,851.12 million in 2017-18 to USD 8,609.08 million in 2018-19, a growth of 25.66%. Objectives of the study This study is focusing on fulfilling the following objectives. 1.To study the India’s trade performance 2.To analyze the principal commodities of exports and imports in India’s foreign trade 3.To understand the direction of foreign trade, Balance of Payment ad FDI inflows. Period of the study For the purpose of analysis and interpretation, secondary data related to India’s foreign trade has been collected for a period of ten years from 2009-10 to 2018-19. Methodology of Study Foreign trade of a nation is macro level topic which includes the flow of goods and services across national boundaries. Therefore it is very difficult to collect data from primary sources. This research work is carried out entirely based on secondary sources of data collected from various sources such as website of world Trade Organization (WTO), Database web portal of Directorate General of Commercial Intelligence and Statistics, Kolkata, Data base of Reserve Bank of India (RBI), various journals, Articles and web-links. Imports Non-Oil 9520.9 Year Trade Balance Oil Total 13637.4 4116.5 -5182.0 -5405.5 -8795.0 -10348.4 -8104.2 -8406.4 -7739.2 -7282.4 -10445.2 -12869.5 @ IJTSRD | Unique Paper ID – IJTSRD30785 | Volume – 4 | Issue – 3 | March-April 2020 Page 1065
International Journal of Trend in Scientific Research and Development (IJTSRD) @ www.ijtsrd.com eISSN: 2456-6470 Exports of Principal commodities form 2010-2011 to 2018-2019 (in billion rupees) S. No 1 Products 2010-11 2011-12 2012-13 2013-14 2014-15 2015-16 2016-17 2017-18 2018-19 Tea 33.54 40.79 47.19 48.73 41.71 47.19 49.06 53.97 58.28 2 Coffee 30.10 45.35 47.11 47.99 49.73 51.23 56.46 62.45 57.22 3 Rice 115.86 241.09 338.58 470.87 480.28 378.00 384.43 503.08 539.90 4 Other cereals 36.48 54.93 81.81 71.78 52.62 15.89 14.26 16.04 24.27 5 Tobacco 39.85 40.06 50.30 61.34 58.69 64.48 64.24 60.22 68.58 6 Spices 78.87 131.03 151.77 151.46 148.48 163.74 191.11 200.85 232.18 7 Cashew 28.19 43.90 40.67 50.95 55.66 50.25 52.79 59.45 45.79 8 Oil Meals 110.70 117.96 165.20 170.70 81.29 34.84 54.10 70.43 105.77 9 Oil seeds 46.44 82.07 74.51 78.30 106.37 81.37 91.04 75.73 80.82 10 Fruits & Vegetables Cereal preparations & miscellaneous processed items Marine Products Meat, dairy & poultry products Iron Ore Mica, Coal & Other Ores, Minerals including processed minerals Leather & leather products Ceramic products & glassware Gems & Jewellery 65.84 82.81 97.74 136.51 131.75 141.38 164.52 162.03 177.34 11 26.54 38.58 49.92 69.69 76.88 85.46 85.20 91.32 108.78 12 119.17 165.85 188.41 306.27 336.88 311.83 395.94 476.46 476.63 13 104.60 151.47 206.88 321.66 329.67 299.91 292.81 297.30 305.30 14 221.98 221.51 89.85 94.81 32.11 12.89 102.91 94.88 92.65 15 168.94 175.48 207.26 242.81 238.56 236.10 239.83 243.42 297.08 16 174.18 224.57 259.96 338.22 368.43 353.61 346.51 340.84 359.34 17 39.42 50.35 62.91 78.31 100.52 111.73 124.49 137.39 185.57 18 1927.95 2219.51 2342.08 2503.53 2522.08 2584.25 2909.03 2678.33 2814.08 19 Drugs & Pharmaceuticals Organic & Inorganic Chemicals Engineering Goods 476.62 630.21 784.88 904.15 943.50 1105.34 1125.47 1114.09 1339.44 20 374.18 546.15 624.48 744.77 762.59 768.04 827.31 1028.10 1344.21 21 2290.84 2871.70 3219.19 3876.87 4470.48 3965.42 4505.92 5073.15 5840.92 22 Electronic Goods Cotton Yarn/Fabs./made- ups, Handloom Products etc. Man-made Yarn/Fabs./made-ups etc. RMG of all Textiles Jute Mfg. including Floor Covering Carpet Handicrafts excl. handmade carpet Petroleum Products 384.81 435.08 449.35 475.58 382.63 389.34 399.80 412.20 619.08 23 346.72 430.73 525.44 670.99 659.11 661.29 661.60 661.41 783.71 24 194.78 242.95 246.79 313.95 322.55 305.50 305.59 311.08 348.17 25 529.20 657.06 704.55 907.18 1029.43 1110.11 1164.59 1076.44 1127.01 26 20.92 22.26 21.24 23.15 21.23 36.90 20.80 21.59 22.74 27 47.04 44.10 59.48 71.27 83.18 94.39 99.92 92.15 103.75 28 34.63 47.61 53.77 91.30 84.26 107.34 129.17 117.54 128.52 29 1887.79 2679.15 3308.19 3832.48 3460.82 1985.76 2115.09 2414.35 3258.63 30 Plastic & Linoleum 194.37 271.94 304.65 372.71 350.86 376.72 388.70 441.64 602.21 31 Other Commodities 1278.68 1653.37 1539.03 1521.75 1182.09 1213.95 1131.66 1177.21 1528.67 Total Exports 11429.22 14659.59 16343.18 19050.11 18964.45 17144.24 18494.34 19565.15 23076.63 Source: Directorate General of Commercial Intelligence and Statistics, Kolkata The above table expressed the principal commodities exported from India during 2009-10 to 2018-19. It is very clear from the above table that among the thirty one principal commodities exported, the following commodities are ranked as top ten items according to their respective values. They are: Engineering goods, Petroleum products, Gems and Jewellery, Organic and inorganic Chemicals, Drugs and Pharmaceuticals, RMG Textiles, Cotton yarn/Fabrics/Made-ups etc., electronic goods, Plastic and Linoleum and Rice which are ranked as top ten items from 1 to 10 respectively. The time series data showed that all items which are tabulated in the above table has been increasing continuously from the year 2009-2010 to 2018-19 except very few items. @ IJTSRD | Unique Paper ID – IJTSRD30785 | Volume – 4 | Issue – 3 | March-April 2020 Page 1066
International Journal of Trend in Scientific Research and Development (IJTSRD) @ www.ijtsrd.com eISSN: 2456-6470 Imports of Principal Commodities from 2010-2011 to 2018-19 (in billion rupees) S. No 1 2 3 4 5 Products 2010-11 2011-12 2012-13 2013-14 2014-15 2015-16 2016-17 2017-18 2018-19 Cotton Raw & Waste Vegetable Oil Pulses Fruits & vegetables Pulp and Waste paper Textile yarn Fabric, made-up articles Fertilisers, Crude & manufactured Sulphur & Unroasted Iron Pyrites Metaliferrous ores & other minerals Coal, Coke & Briquettes, etc. Petroleum, Crude & products Wood & Wood products Leather & leather products Organic & Inorganic Chemicals 15 Dyeing/tanning/colouring mtrls. Artificial resins, plastic materials, 6.22 259.20 75.12 39.96 28.31 10.59 389.09 94.48 50.53 34.52 24.67 535.62 133.45 67.73 40.57 23.76 440.38 110.37 83.42 46.48 31.02 648.90 170.63 101.82 57.81 25.63 686.30 256.09 118.65 62.65 63.39 730.39 285.23 119.65 65.37 63.07 749.96 187.49 134.89 74.42 43.83 690.24 80.35 150.27 91.86 6 50.13 68.56 78.43 91.21 103.40 112.02 100.79 118.43 133.03 7 8 315.33 10.99 533.11 22.86 477.22 17.39 381.57 11.05 452.95 17.50 523.45 14.22 337.06 8.79 346.54 10.68 520.95 15.28 9 294.92 388.78 497.50 507.92 568.91 474.47 415.54 586.31 528.51 10 11 12 13 14 446.70 4822.82 7430.75 8918.71 9978.85 8428.74 5400.69 5832.17 7003.21 9862.60 168.95 240.78 276.57 309.81 334.13 29.01 34.48 40.26 49.84 61.48 613.46 801.15 913.38 1056.63 1134.94 1081.93 1112.96 1330.00 1665.43 72.85 101.06 118.12 146.35 149.37 835.96 925.38 991.31 1089.06 875.05 1057.53 1476.41 1829.86 330.27 63.22 328.17 62.74 388.50 65.04 428.41 73.97 146.83 153.07 186.10 225.38 16 357.91 423.40 543.53 632.61 737.28 770.59 802.27 933.84 1096.29 etc. 17 18 Chemical material & products Newsprint Pearls, precious & Semi-precious stones Iron & Steel Non-ferrous metals Machine tools Machinery, electrical & non- electrical Transport equipment Project goods Professional instrument, Optical goods, etc. Electronic goods Medcnl. & Pharmaceutical products Gold Silver Other Commodities Total Imports 174.21 37.41 218.02 49.38 264.51 43.75 295.12 53.95 324.24 51.28 337.26 52.70 360.59 57.00 429.44 50.07 539.33 68.54 19 1541.37 1343.74 1231.68 1442.93 1379.68 1314.10 1594.64 2209.66 1888.81 20 21 22 665.16 297.95 134.98 874.82 402.90 190.60 963.10 491.76 202.44 765.87 535.85 184.99 997.53 657.18 191.88 979.48 635.84 180.56 783.88 661.93 203.47 942.06 825.84 226.80 1234.96 1030.34 324.90 23 1190.50 1586.21 1673.89 1639.08 1712.30 1928.19 1908.06 2208.28 2778.99 24 25 678.92 279.96 897.34 422.21 1158.33 1169.14 1125.21 1170.02 1523.37 1465.09 1735.21 356.59 274.42 222.12 180.16 139.15 133.92 166.18 26 126.56 172.22 204.37 217.66 227.26 235.66 258.69 306.50 362.84 27 1272.98 1633.27 1790.42 1958.96 2254.44 2619.50 2811.97 3322.01 3881.21 28 191.49 248.43 297.36 316.61 332.11 355.66 335.02 353.30 444.29 29 30 31 1847.42 2699.01 2921.53 1662.43 2106.58 2068.65 1844.39 2170.72 2294.49 89.53 247.04 107.97 269.74 276.86 714.36 1009.36 1375.39 1506.03 1424.23 1615.05 1696.17 1504.53 1495.53 16834.67 23454.63 26691.62 27154.34 27370.87 24859.27 2577675 30010.33 35943.73 Source: Directorate General of Commercial Intelligence and Statistics, Kolkata 244.35 123.29 207.25 261.89 The above table exhibits the principal commodities which were imported to India from rest of the world from 2009-10 to 2018- 19. According to the chronologically tabulated data for the study period, it can be inferred that there are nearly thirty one commodities were being imported. Based on the current year (2018-19) rupee value of each commodity imported into India, it is found that the following goods are ranked top ten. Accordingly, Petroleum, Crude & products (Rs. 9862.60 billion), Electronic goods (Rs.3881.21 billion) and Machinery, Electrical and non-electrical goods (Rs. 2778.99 billion) have got the first three positions, followed by gold (2294.49) and Pearls, Precious and Semi-precious Stones (1888.81). The next top ranked items are Coal, Coke& briquettes (Rs. 1829.86 billion), Transport equipments (Rs. 1735.21 billion), Organic and Inorganic Chemicals (Rs. 1665.43 billion), Iron and Steel (Rs. 1234.96 billion) and Artificial Resins, Plastic materials (Rs. 106.29 billion) etc. On an overall basis the above tabulated thirty one items were progressing every year except very few items during the study period. Direction of Foreign Trade – Exports (in Rs. billions) S. No 1 O E C D Countries 3802.12 4965.19 5596.88 6592.03 2 O P E C 2178.44 2461.90 3132.23 3371.61 3 Eastern Europe 123.75 149.97 205.20 214.66 Developing Countries 5 Others 37.55 20.72 21.65 41.83 6 Unspecified 652.29 764.57 289.71 683.68 7 Total 11429.22 14659.59 16343.18 19050.11 Source: Directorate General of Commercial Intelligence and Statistics, Kolkata Products 2010-11 2011-12 2012-13 2013-14 2014-15 2015-16 2016-17 2017-18 2018-19 6682.41 3444.79 208.80 6599.10 3025.70 158.28 7005.20 3029.67 189.06 7709.81 2855.90 195.75 8959.50 3405.16 245.39 4 4635.07 6297.24 7097.51 8146.30 8365.65 7202.72 8090.39 8632.29 10250.35 9.92 252.89 18964.45 15.90 162.14 17163.84 14.46 165.55 18494.34 14.78 156.62 19565.15 13.11 203.12 23076.63 @ IJTSRD | Unique Paper ID – IJTSRD30785 | Volume – 4 | Issue – 3 | March-April 2020 Page 1067
International Journal of Trend in Scientific Research and Development (IJTSRD) @ www.ijtsrd.com eISSN: 2456-6470 Direction of foreign trade –exports revealed the India’s trade relationship with the rest of the other nations in the world. For the purpose these various countries are grouped as OECD Countries, OPEC Countries, Eastern Europe, Developing countries Others and Unspecified. Among these grouped countries India’s export to Developing countries significantly increased from Rs. 4635.07 billion in 2009-10 to Rs. 10250.35 billion in 2018-19 and is topped among them. The second top ranked group countries is OECD Countries to which exports increased from Rs. 3802.12billion in 2010-2011 to Rs. 8959.50 billion in 2018-19 showing a growth of nearly 250%. OPEC group secured third place in this direction followed by Eastern Europe, Others and Unspecified. Direction of Foreign Trade – Imports (in Rs. billions) S. No 1 O E C D Countries 5157.03 7087.75 7702.31 6973.70 2 O P E C 5201.49 7624.71 9406.79 9837.14 3 Eastern Europe 259.16 405.17 431.94 468.58 Developing Countries 5 Others 5.06 16.41 9.31 20.91 6 Unspecified 196.20 50.19 104.70 247.41 7 Total 16834.67 23454.63 26691.62 27154.34 Source: Directorate General of Commercial Intelligence and Statistics, Kolkata Direction of foreign trade Imports shows the various source countries from which India imported the goods for the purpose of consumption and re-exports. Among the specified groups, India uses Developing countries as its major sources of imports (Rs. 15596.20 in 2018-19), and showed a continuous increase from Rs. 6015.72 billion in 2010-11 to Rs. 15596.20 billion in 2018- 19. OECD Countries and OPEC countries are ranked as second and third major sources for India’s imports followed by Eastern Europe. Others & Unspecified countries played least role in India’s import since the share of these countries are very lower to the total imports. India’s Overall Balance of Payments from 2009-2010 to 2018-2019 (in Rs. Billions) Current Account Capital Account Credit Debit Net Credit Debit 2009-10 16379.17 18176.16 -1796.99 16400.01 13959.52 2010-11 20328.93 22525.47 -2196.54 22900.45 19988.78 2011-12 25359.97 29119.70 -3759.73 22896.39 19706.10 2012-13 28865.83 33661.93 -4796.10 25656.56 20799.22 2013-14 33449.16 35320.52 -1871.36 30924.03 28025.84 2014-15 34122.58 35755.71 -1633.13 33679.31 28203.81 2015-16 32819.82 34257.44 -1437.62 33360.13 30696.74 2016-17 35024.95 35994.11 -969.16 36934.01 34490.65 2017-18 38181.56 41322.82 -3141.26 41487.32 35596.13 2018-19 45032.07 49034.35 -4002.27 37928.62 34094.59 Source: Handbook of Statistics on Indian Economy, RBI. The above able examine the overall balance of payment of India from 2009-10 to 2018-19. The table consolidated both Debit and Credit of the Current Account and Capital Account figures after taking into consideration of Errors and Omissions. During the entire study periods, Current account showed negative balance of payment but Capital account revealed net positive balance of payment for the period of study from Rs. 244.48 billion to Rs. 3834.03 billion in 2018-19. Overall balance of payment recorded a growth of Rs. 2808.16 billion in 2017-18 from Rs. 642.36 billion in 2009-10. But the low capital account balance 2018-19 revealed a negative balance of Rs. 202.04 billion. Foreign Investment Inflows from 2009-10 to 2018-19 (US$ millions) Gross inflows/ Gross Investments Disinvestment to India 2009-10 37746 4637 33109 2010-11 36047 7018 29029 2011-12 46552 13599 32952 2012-13 34298 7345 26953 2013-14 36047 5284 30763 2014-15 45147 9864 35283 2015-16 55559 10652 44907 2016-17 60220 18005 42215 2017-18 60974 21544 39431 2018-19 62001 18699 43302 Source: Handbook of Statistics on Indian Economy, RBI Products 2010-11 2011-12 2012-13 2013-14 2014-15 2015-16 2016-17 2017-18 2018-19 7361.11 8361.38 470.38 7191.38 5879.77 463.83 7328.85 6205.85 625.11 8169.89 7048.29 832.94 10121.89 9554.72 660.63 4 6015.72 8270.40 9036.57 9606.61 10694.85 10781.48 11116.82 13359.86 15596.20 19.70 463.44 27370.87 17.34 569.26 24903.06 8.55 491.57 25776.75 6.34 593.01 30010.33 4.07 6.21 35943.73 Errors and Omissions Credit Debit 49.52 50.64 -49.13 71.50 0.00 115.60 145.78 0.00 49.63 115.92 67.25 130.37 27.96 95.42 25.50 57.37 122.49 64.26 40.83 74.63 Overall Balance 642.36 594.51 685.03 207.02 960.54 3779.25 1158.30 1442.34 2808.16 -202.04 Year Net Net -1.13 120.62 -115.60 145.78 -66.29 -63.12 -67.46 -31.87 58.23 -33.80 2440.48 2911.67 3190.29 4857.34 2898.19 5475.50 2663.38 2443.37 5891.19 3834.03 Repatriation/ Direct Investment Net Portfolio Investment 32396 30293 17170 26891 4822 42205 -4130 7612 22115 -618 Year FDI by India Net FDI Total 15143 17195 10892 7134 9199 4031 8886 6603 9144 12590 17966 11834 22061 19819 21564 31251 36021 35612 30286 30712 50362 42127 39231 46711 26386 73456 31891 43224 52401 30094 @ IJTSRD | Unique Paper ID – IJTSRD30785 | Volume – 4 | Issue – 3 | March-April 2020 Page 1068
International Journal of Trend in Scientific Research and Development (IJTSRD) @ www.ijtsrd.com eISSN: 2456-6470 In this table the researcher tries to bring various components under foreign investment inflows. Gross inflows or Gross investments increased from US$ 37746 million in 2009-10 to US$ 62001 million in 2018-19. The component, repatriation or disinvestment increased from US$ 4637 million in 2009-10 to US$ 18699 million showing a mixed growth variations during the study period. Direct investment to India showed an increase of US$ 10193 from the base year 2009-10. From the initial study period, FDI made by India have been showing decreasing trend continuously (from US$ 15143 million in 2009-10 to US$ 9144 million in 2018-19) and it increased to US$ 12590 million in 2018-19. Net portfolio investment exhibited the mixed growth during the study period. The total foreign investment inflows increased then and there and it is stagnant. The year 2014-15 showed a good growth of US$ 73456 million of total foreign investment inflows and reduced to US$ 30094 million in 2018-19. Foreign Exchange Reserves from 2009-10 to 2018-19 (US$ millions) End of the Financial Year Drawing rights) 2009-10 5006 17986 2010-11 4569 22972 2011-12 4469 27023 2012-13 4328 25692 2013-14 4464 21567 2014-15 3985 19038 2015-16 1502 20115 2016-17 1447 19869 2017-18 1540 21484 2018-19 1457 23071 Source: Handbook of Statistics on Indian Economy, RBI The foreign exchange reserves along with its components are exhibited in the above table from 2009-10 to 2018-19. It includes Special Drawing Rights (SDR), Gold and Foreign Currency Assets. It is evident from the above table that SDR reserves decreased form US$ 5006 million in 2009-10 to US$ 1457 million in 2018-19. Gold reserve increased from US$ 17986 million to US$ 23071 million in 2018-19. Foreign currency assets were increasing during the study period from US$ 254685 million in 2009- 10 to US$ 385357 billion in 2018-19 showing an increase of US$ 130672 million from the base year. India’s total foreign exchange reserves showed a steady increase year on year basis except in 2012-13. Total Forex reserves have revealed a rise of US$ 133814 million from 279057 in 2009-10 to US$ 412871 billion in 2018-19. The present position of India’s foreign exchange reserves are at satisfactory level amidst of global slowdown among the fast developing countries. Conclusion Indian economy is not only characterized by it GDP alone but also by its international trade with the rest of the world. From the above analysis it can be well understood by everyone that India’s foreign trade performance showed a good show off during the last ten years and so. Indian economy is assumed to be emerging market economy and to be the great player in the international trade market. As per the WTO current ranking for the year 2018, India is in the 19th largest exporter (With the share of 1.7%) and 10th largest importer (with a share of 2.6%) of merchandise trade in the world. REFERENCES [1]Kaur, Amandeep (2012), “Pattern of India’s Foreign Trade in pre and post reform era: An Empirical Investigation” International Journal of Advancements in Research & Technology, Vol. 1, Issue 5, October 2012, Pg. 1-30. SDR (Special Foreign Currency Assets 254685 274330 260069 259726 276359 317324 336104 346319 399442 385357 Reserve Tranche Position 1380 2947 2836 2301 1834 1292 2456 2321 2079 2986 Gold Total 279057 304818 294398 292046 304223 341638 360176 369955 424545 412871 [6]Agarwal, Himanshu (2017), Export-Led-Growth: A Strategic Approach to India’s Economic Development, International Journal of Trade & Commerce-IIARTC, Vol. 6(1), Pg. 129-144. [7]Highlight of the Foreign Trade Policy (2015-2020), Ministry of Commerce and Industry, Govt. of India. [8]Mahajan, V. S. (2011), “Economic Reform & Liberalisation” Deep and Deep Publication, New Delhi. [9]Bhat. T. P. (2011), “Structural Changes in India’s Foreign Trade” Institute for studies in Industrial Development, New Delhi Analytical Study of Foreign Trade Performance in India Nazaquat Husain – 518 - UGC (Ministry of HRD, Govt. of India) Approved Journal in Social Science. [10]Annual report 2018-19, published by Dept. of Commerce. NEWSPAPER [1]The Economic Times. [2]The Times of India. [3]The Business Standards. WEBSITES [1]www.commerce.nic.in. [2]www.wikipedia.org. [3]www.tradingeconomics.com. [4]www.dgciskol.nic.in. [5]www.rbi.org [6]www.eximatlasindia.com. [7]www.dgft.gov.in [2]Annual Report on Foreign Trade (2016-17), Ministry of Commerce & Industry, Government of India. [3]Belay, Seyoum (2009), “Export-Import: Theory, Practices and Procedure” Routledge publication, New York. [4]Prasad, H. A. C. (2012), “Emerging Global Economic Situation: Its Impact on India’s Trade and some policy Issues” Working Paper No. 1/2012-DEA, Department of Economic Affairs, Govt. of India. [5]Human Development report 2018, Narendhar, Retrieved 21 March 2017. @ IJTSRD | Unique Paper ID – IJTSRD30785 | Volume – 4 | Issue – 3 | March-April 2020 Page 1069