Download
1 / 4
70 likes | 115 Views
SPSS, standing for Statistical Package for the Social Sciences, is a powerful, user friendly software package for the manipulation and statistical analysis of data. The package is particularly useful for students and researchers in psychology, sociology, psychiatry, and other behavioral sciences, containing as it does an extensive range of both univariate and multivariate procedures much used in these disciplines. This paper intends to support teacher teaching forecasting based on sample dataset teach.sav.SPSS background algorithm used crosstabulation Pearson chi square algorithm for data significant. Tech.sav was downloaded from Google and was analyzed and viewed. It used IBM SPSS statistics version 23 and PYTHON version 3.7. San San Nwe | Myint Myint Yee | Aung Cho "Teaching Data Analysis using SPSS" Published in International Journal of Trend in Scientific Research and Development (ijtsrd), ISSN: 2456-6470, Volume-3 | Issue-5 , August 2019, URL: https://www.ijtsrd.com/papers/ijtsrd26739.pdf Paper URL: https://www.ijtsrd.com/computer-science/data-miining/26739/teaching-data-analysis-using-spss/san-san-nwe<br>

E N D
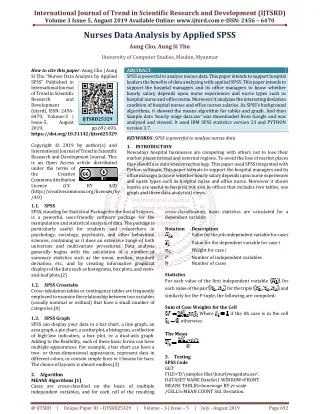
International Journal of Trend in Scientific Research and Development (IJTSRD) Volume 3 Issue 5, August 2019 Available Online: www.ijtsrd.com e-ISSN: 2456 – 6470 Teaching Data Analysis using SPSS San San Nwe, Myint Myint Yee, Aung Cho University of Computer Studies, Maubin, Myanmar How to cite this paper: San San Nwe | Myint Myint Yee | Aung Cho "Teaching Data Analysis using SPSS" Published in International Journal of Trend in Scientific Research and Development (ijtsrd), ISSN: 2456- 6470, Volume-3 | Issue-5, August 2019, pp.1752-1755, https://doi.org/10.31142/ijtsrd26739 Copyright © 2019 by author(s) and International Journal of Trend in Scientific Research and Development Journal. This is an Open Access article distributed under the terms of the Creative Commons Attribution License (CC (http://creativecommons.org/licenses/by /4.0) They should know teaching techniques are Fipped Classroom (Iverting you class), Design Thinking (Case Method), Self_Learning, Gamificaiton, Social Media, Free Online Learning Tools. The teacher needs to know about teaching style are .Although it is not the teacher’s job to entertain students, it is vital to engage them in the learning process. Selecting a style that addresses the needs of diverse students at different learning levels begins with a personal inventory—a self-evaluation—of the teacher’s strengths and weaknesses. As they develop their teaching styles and integrate them with effective classroom management skills, teachers will learn what works best for their personalities and curriculum. Our guide encapsulates today’s different teaching styles and helps teachers identify the style that’s right for them and their students. Browse through the article or use these links to jump to your desired destination. Teaching style are the Authority, or lecture style, The Demonstrator or coach style, The Facilitator or activity style, The Delegator, or group style, The Hybrid or blended style. 1.1 SPSS. Business, education, and all fields of science have come to rely heavily on the computer. This dependence has become so great that it is no longer possible to understand social and health science research without substantial knowledge of statistics and without at least some rudimentary understanding of statistical software. The number and types of statistical software packages that are available continue to ABSTRACT SPSS, standing for Statistical Package for the Social Sciences, is a powerful, user-friendly software package for the manipulation and statistical analysis of data. The package is particularly useful for students and researchers in psychology, sociology, psychiatry, and other behavioral sciences, containing as it does an extensive range of both univariate and multivariate procedures much used in these disciplines. This paper intends to support teacher teaching forecasting based on sample dataset teach.sav.SPSS background algorithm used crosstabulation Pearson chi-square algorithm for data significant. Tech.sav was downloaded from Google and was analyzed and viewed. It used IBM SPSS statistics version 23 and PYTHON version 3.7. KEYWORDS: SPSS, Crosstabulation, Data mining 1.INTRODUCTION Education, as with other industries, has evolved in leaps and bounds in recent years. Traditional pedagogical techniques, based on a teacher explaining a topic and students taking notes, may still be useful on occasion, but education today revolves more around encouraging the student to awaken their curiosity and desire to learn. A number of different teaching techniques have emerged due to this change in education. Many of these teaching techniques are not actually new! The use of technology in the classroom has simply given education a new lease of life allowing us to approach old ideas in new ways. IJTSRD26739 BY 4.0) grow each year. In this book we have chosen to work with SPSS, or the Statistical Package for the Social Sciences. SPSS was chosen because of its popularity within both academic and business circles, making it the most widely used package of its type. SPSS is also a versatile package that allows many different types transformations, and forms of output - in short, it will more than adequately serve purposes.[2] 1.2 SPSS Crosstabs Crosstab is widely used in survey results to find out interrelationships and interactions between variables . Crosstab construction and analysis is usually done through various statistical packages. Statistical package widely used to build Crosstabs. SPSS is also used for Crosstab Analysis. 1.3 Chi_Square Test The Chi-square test is intended to test how likely it is that an observed distribution is due to chance. It is also called a "goodness of fit" statistic, because it measures how well the observed distribution of data fits with the distribution that is expected if the variables are independent. 1.4 SPSS Graph This tutorial will show you how to use SPSS version 12.0 to create bar graphs, histograms, Tukey box plots, line graphs, and scatter plots. It also includes information on editing the graphs, and printing selected parts of the output.[4] of analyses, data @ IJTSRD | Unique Paper ID – IJTSRD26739 | Volume – 3 | Issue – 5 | July - August 2019 Page 1752
International Journal of Trend in Scientific Research and Development (IJTSRD) @ www.ijtsrd.com eISSN: 2456-6470 Table.1 Calculate Crosstab for teachers and lectures Q5 Count Total more than 10 hrs/week 5 to 10 hrs/week less than 5 hrs/week 97 22 49 15 55 17 23 12 224 66 Q2 full professor associate prof assistant prof other Total 14 10 10 23 57 133 74 82 58 347 2.Algorithm The notation and statistics refer to bivariate subtables defined by a row variable X and a column variable Y, unless specified otherwise. By default, CROSSTABS deletes cases with missing values on a table-by-table specified otherwise. By default, CROSSTABS deletes cases with missing values on a table-by-table basis. Valid N Percent Q2 * Q5 347 96.1% Q2 * Q26 348 96.4% Cases Missing Total N 14 13 Percent 3.9% 3.6% N Percent 100.0% 100.0% 361 361 3.Testing. 3.1 Data Analysis view: As a result for table 2 and graph 1 is show row Q2 is type of teachers and Q5 is mean hours of their lectures. This graph show other teacher most lecture and then assistant professor is more than associate professor and full professor lectures less than other teachers in per week. You can know that higher rank is less lectures hours. So rank is relationship with lectures hours indirectly. @ IJTSRD | Unique Paper ID – IJTSRD26739 | Volume – 3 | Issue – 5 | July - August 2019 Page 1753
International Journal of Trend in Scientific Research and Development (IJTSRD) @ www.ijtsrd.com eISSN: 2456-6470 Graph1 .Teachers & Lectures Relatiaon Graph Table.3 Crosstab calculation for teachers and use technology. Q26 Total I use technology in my classroom I don't use technology in my classroom 86 53 65 34 238 Graph2. Teacher & Use Technology Graph Q2 full professor associate prof assistant prof other Total 45 19 17 29 110 131 72 82 63 348 3.2 AS a result below graph 2 show teachers and they technology used. Q2 is teachers and Q26 is used technology.This graph show full professor more use technology than other teachers. So other teachers need to be trained how to use technology aid teaching methods and that are more efficient in teaching and learning lessons for students. So rank is relationship with using technology directly. Data Analysis View: @ IJTSRD | Unique Paper ID – IJTSRD26739 | Volume – 3 | Issue – 5 | July - August 2019 Page 1754
International Journal of Trend in Scientific Research and Development (IJTSRD) @ www.ijtsrd.com eISSN: 2456-6470 Table4. Chi-Square Tests Value 11.913a 11.930 .330 348 df 3 3 1 Asymptotic Significance (2-sided) .008 .008 .566 Pearson Chi-Square Likelihood Ratio Linear-by-Linear Association N of Valid Cases a. 0 cells (0.0%) have expected count less than 5. The minimum expected count is 19.91. Table5. Chi-Square Tests Value Pearson Chi-Square 30.977a Likelihood Ratio 26.900 Linear-by-Linear Association 19.038 Association N of Valid Cases 347 a. 0 cells (0.0%) have expected count less than 5. The minimum expected count is 9.53. Data Analysis view: Table 4 and Table 5 show calculate with Chi_square methods for teachers & lecture time and teacher & used technology. As a calculation this paper understood person Chi_Square method is significant for used variables and most efficient of teach.sav dataset. 4.Conclusion SPSS is data analysis tools are valuable in social science, education, business, marketing, sale and other factcors field in used easily to decision and find data analysis. It is very good presentation with graph .This paper show teacher take lecture time, use technology with teacher rank. The rector can know what teacher to take their work and how to teach their students with background algorithm crosstabulation Pearson chi-square algorithm for data significant. So SPSS software is useful for data analysis. df 6 6 1 Asymptotic Significance (2-sided) .000 .000 .000 3.3 REFERENCES [1]IBM SPSS Statisti s 24 Algorithms pdf book [book style] [2]Using SPSS to Understand Research and Data Analysis [Daniel Arkkelin/Valparaiso University] [3]handbook of statistical analyses using SPSS / Sabine, Landau, Brian S. Everitt, ISBN 1-58488-369-3 [book style] [4]SPSS For Dummies®, 2nd Edition, ISBN: 978-0-470- 48764-8 [book style] [5]SPSS for Social Scientists Robert L. Miller, Ciaran Acton,Deirdre A. Fullerton and John Maltby, ISBN 0– 333–92286–7 [book style]). used [6]Data Mining Concept and Techniques By Jiawei Han and Micheline Kamber. @ IJTSRD | Unique Paper ID – IJTSRD26739 | Volume – 3 | Issue – 5 | July - August 2019 Page 1755