Download
1 / 8
80 likes | 85 Views
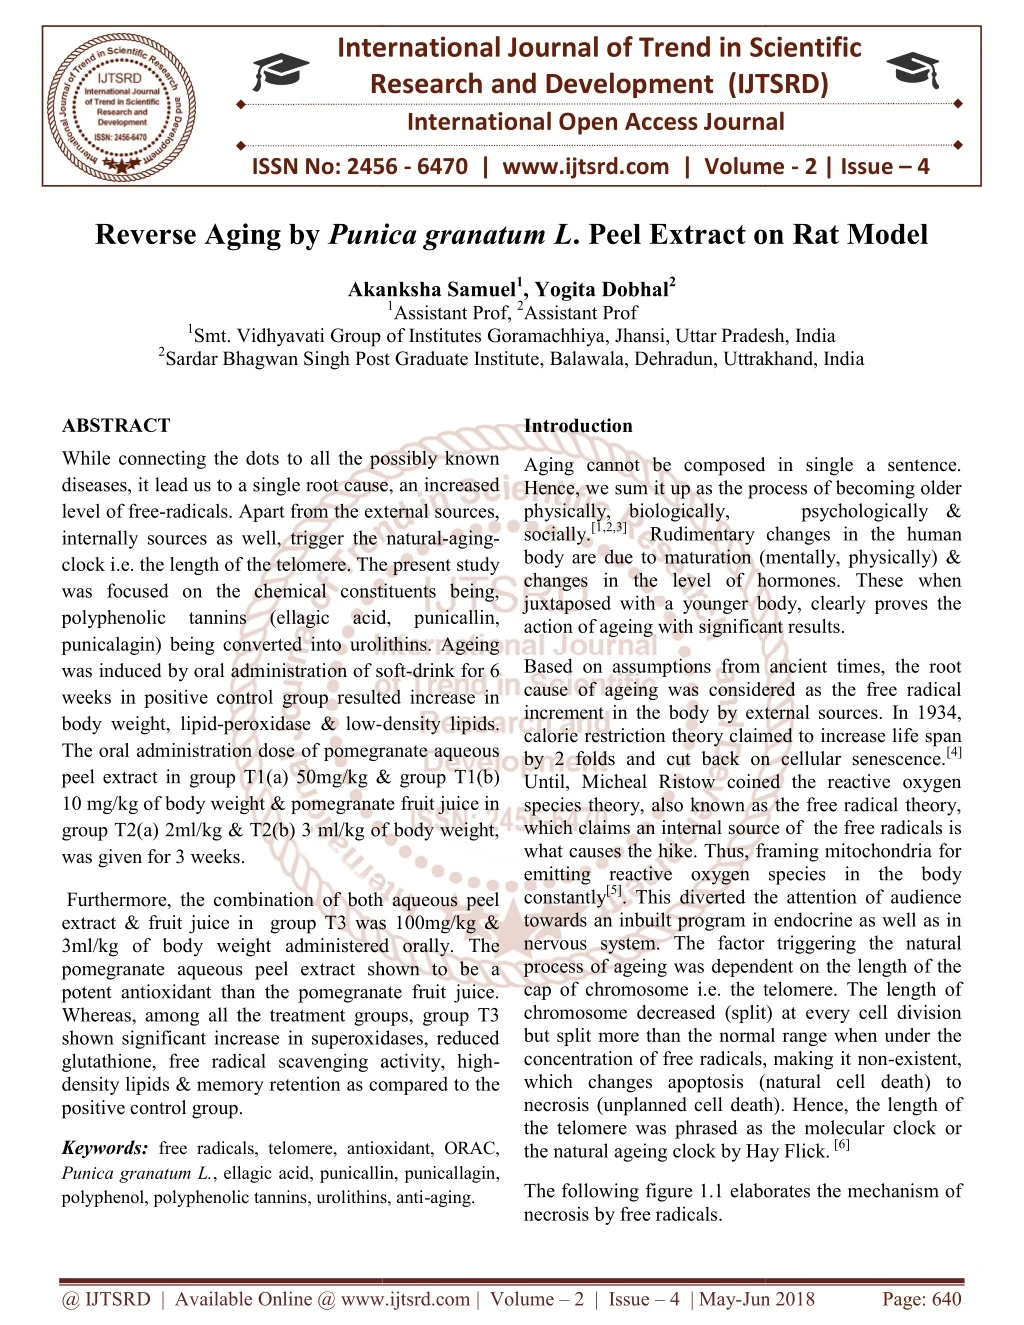
While connecting the dots to all the possibly known diseases, it lead us to a single root cause, an increased level of free radicals. Apart from the external sources, internally sources as well, trigger the natural aging clock i.e. the length of the telomere. The present study was focused on the chemical constituents being, polyphenolic tannins ellagic acid, punicallin, punicalagin being converted into urolithins. Ageing was induced by oral administration of soft drink for 6 weeks in positive control group resulted increase in body weight, lipid peroxidase and low density lipids. The oral administration dose of pomegranate aqueous peel extract in group T1 a 50mg kg and group T1 b 10 mg kg of body weight and pomegranate fruit juice in group T2 a 2ml kg and T2 b 3 ml kg of body weight, was given for 3 weeks. Furthermore, the combination of both aqueous peel extract and fruit juice in group T3 was 100mg kg and 3ml kg of body weight administered orally. The pomegranate aqueous peel extract shown to be a potent antioxidant than the pomegranate fruit juice. Whereas, among all the treatment groups, group T3 shown significant increase in superoxidases, reduced glutathione, free radical scavenging activity, high density lipids and memory retention as compared to the positive control group. Akanksha Samuel | Yogita Dobhal "Reverse Aging by Punica granatum L. Peel Extract on Rat Model" Published in International Journal of Trend in Scientific Research and Development (ijtsrd), ISSN: 2456-6470, Volume-2 | Issue-4 , June 2018, URL: https://www.ijtsrd.com/papers/ijtsrd12999.pdf Paper URL: http://www.ijtsrd.com/pharmacy/pharmacology-/12999/reverse-aging-by-punica-granatum-l-peel-extract-on-rat-model/akanksha-samuel<br>

E N D
International Research Research and Development (IJTSRD) International Open Access Journal Punica granatum L. Peel Extract on Rat Model . Peel Extract on Rat Model International Journal of Trend in Scientific Scientific (IJTSRD) International Open Access Journal ISSN No: 2456 ISSN No: 2456 - 6470 | www.ijtsrd.com | Volume 6470 | www.ijtsrd.com | Volume - 2 | Issue – 4 Reverse Aging by Punica granatum L Akanksha Samuel Akanksha Samuel1, Yogita Dobhal2 1Assistant Prof, 2Assistant Prof Vidhyavati Group of Institutes Goramachhiya, Jhansi, Uttar Pradesh, India Sardar Bhagwan Singh Post Graduate Institute, Balawala, Dehradun, Uttrakhand, India 1Smt. Vidhyavati Group of Institutes 2Sardar Bhagwan Singh Post G Goramachhiya, Jhansi, Uttar Pradesh, India , Balawala, Dehradun, Uttrakhand, India ABSTRACT Introduction While connecting the dots to all the possibly known diseases, it lead us to a single root cause, an increased level of free-radicals. Apart from the external sources, internally sources as well, trigger the natural clock i.e. the length of the telomere. The present study was focused on the chemical constituents being, polyphenolic tannins (ellagic acid, punicallin, punicalagin) being converted into urolithins. Ageing was induced by oral administration of soft weeks in positive control group resulted increase in body weight, lipid-peroxidase & low- The oral administration dose of pomegranate aqueous peel extract ingroup T1(a) 50mg/kg & group T1(b) 10 mg/kg of body weight & pomegranate fruit juice in group T2(a) 2ml/kg & T2(b) 3 ml/kg of body weight, was given for 3 weeks. While connecting the dots to all the possibly known diseases, it lead us to a single root cause, an increased radicals. Apart from the external sources, ging cannot be composed in single a sentence. Hence, we sum it up as the process of becoming older physically, biologically, psychologically & Rudimentary changes in the human body are due to maturation (mentally, physically) & s in the level of hormones. These when juxtaposed with a younger body, clearly proves the Aging cannot be composed in single a sentence. Hence, we sum it up as the process of becoming older physically, biologically, psychologically & socially.[1,2,3] Rudimentary changes in the human body are due to maturation (mentally, physically) & changes in the level of hormones. These when juxtaposed with a younger body, clearly proves the action of ageing with significant results. action of ageing with significant results. the natural-aging- clock i.e. the length of the telomere. The present study was focused on the chemical constituents being, polyphenolic tannins (ellagic acid, punicallin, punicalagin) being converted into urolithins. Ageing Based on assumptions from ancient times, the root cause of ageing was considered as the free radical increment in the body by external sources. In 1934, calorie restriction theory claimed to increase life span by 2 folds and cut back on cellular senescence. Until, Micheal Ristow coined the reactive oxygen species theory, also known as the free radical theory, which claims an internal source of the free radicals is what causes the hike. Thus, framing mitochondria for emitting reactive oxygen species in the body constantly[5]. This diverted the attention of audience towards an inbuilt program in endocrine as well as in nervous system. The factor triggering the natural process of ageing was dependent on the length of the cap of chromosome i.e. the telomere. The length of chromosome decreased (split) at every cell division but split more than the normal range when under the concentration of free radicals, making it non which changes apoptosis (natural cell death) to necrosis (unplanned cell death). Hence, the length of the telomere was phrased as the molecular clock or the natural ageing clock by Hay Flick. the natural ageing clock by Hay Flick. [6] Based on assumptions from ancient times, the root cause of ageing was considered as the free radical by external sources. In 1934, calorie restriction theory claimed to increase life span by 2 folds and cut back on cellular senescence.[4] Until, Micheal Ristow coined the reactive oxygen species theory, also known as the free radical theory, n internal source of the free radicals is what causes the hike. Thus, framing mitochondria for emitting reactive oxygen species in the body . This diverted the attention of audience towards an inbuilt program in endocrine as well as in s system. The factor triggering the natural process of ageing was dependent on the length of the cap of chromosome i.e. the telomere. The length of chromosome decreased (split) at every cell division but split more than the normal range when under the entration of free radicals, making it non-existent, which changes apoptosis (natural cell death) to necrosis (unplanned cell death). Hence, the length of the telomere was phrased as the molecular clock or on of soft-drink for 6 weeks in positive control group resulted increase in -density lipids. The oral administration dose of pomegranate aqueous group T1(a) 50mg/kg & group T1(b) pomegranate fruit juice in group T2(a) 2ml/kg & T2(b) 3 ml/kg of body weight, Furthermore, the combination of both aqueous peel extract & fruit juice in group T3 was 100mg/kg & 3ml/kg of body weight administered orally. The pomegranate aqueous peel extract shown to be a potent antioxidant than the pomegranate fruit juice. Whereas, among all the treatment groups, group T3 shown significant increase in superoxidases, reduced glutathione, free radical scavenging activity, high density lipids & memory retention as compared to the positive control group. Furthermore, the combination of both aqueous peel group T3 was 100mg/kg & 3ml/kg of body weight administered orally. The nate aqueous peel extract shown to be a potent antioxidant than the pomegranate fruit juice. Whereas, among all the treatment groups, group T3 shown significant increase in superoxidases, reduced glutathione, free radical scavenging activity, high- lipids & memory retention as compared to the Keywords: free radicals, telomere, antioxidant, ORAC, Punica granatum L., ellagic acid, punicallin, punicallagin, polyphenol, polyphenolic tannins, urolithins, anti polyphenol, polyphenolic tannins, urolithins, anti-aging. free radicals, telomere, antioxidant, ORAC, , ellagic acid, punicallin, punicallagin, The following figure 1.1 elaborates the mechanism of necrosis by free radicals. lowing figure 1.1 elaborates the mechanism of @ IJTSRD | Available Online @ www.ijtsrd.com @ IJTSRD | Available Online @ www.ijtsrd.com | Volume – 2 | Issue – 4 | May-Jun 2018 Jun 2018 Page: 640
International Journal of Trend in Scientific Research and Development (IJTSRD) ISSN: 24 International Journal of Trend in Scientific Research and Development (IJTSRD) ISSN: 24 International Journal of Trend in Scientific Research and Development (IJTSRD) ISSN: 2456-6470 Conical flask, Glass rod, Pipette, Volumetric flask, Conical flask, Glass rod, Pipette, Volumetric flask, Beaker; Borosil. Methods: Preparation & extraction of plant material: Punica L., of Lythraceae family, was collected without authentification as its exclusive to India & Iran. The extraction of fruit juice (PJ) was done by cold press method. The arils, or the small grains of the fruit was removed carefully, collected and crushed with manual pressure. No machines were used to extract the fruit juice. This fruit juice was stored in a sealed bottle below room temperature i.e. in the fridge. The stock was renewed weekly. The second extract was the fruit peel extract (PPE). The peels collected from the fruits used for first extract were dried at room temperature, as the sun light damages the polyphenolic content. The dried peels were then crushed in a mortar pestle and the remaining coarse particles were grind in an electric grinder. The fine powder obtained was then passed through sieves (no specific number) to remove the waste products that can’t be used for further extraction process. The powder was weighed 20gms per 1L water and 10ml ethanol (to prevent fermentation) for maceration process. The solution was placed in a conical flask with a magnetic bead, mouth covered with aluminum foil, over a magnetic stirrer. The solution is stirred for over 6 hours per batch at a constant speed of 500- 1000rpm. Per batch was filtered using a muslin cloth, and the liquid obtained was evaporated in a china dish, over a water bath for days, to obtain the desired consistency of the product. The final product was stored in a dark, vacuum sealed bottle to prevent hampering the antioxidant property. (Percentage yield Preparation & extraction of plant material: granatum L., of Lythraceae family, was collected without authentification as its exclusive to India & Iran. The extraction of fruit juice (PJ) was done by cold press method. The arils, or the small grains of the fruit was removed carefully, collected and crushed with manual pressure. No machines were used to extract the fruit juice. This fruit juice was stored in a sealed bottle below room temperature i.e. in the fridge. The stock was renewed weekly. The second extract was the fruit peel extract (PPE). The peels collected from the fruits used for first extract were dried at room temperature, as the sun light damages the polyphenolic content. The dried peels were then crushed in a mortar pestle and the remaining coarse particles were grind in an electric grinder. T powder obtained was then passed through sieves (no specific number) to remove the waste products that can’t be used for further extraction process. The powder was weighed 20gms per 1L water and 10ml ethanol (to prevent fermentation) for maceration process. The solution was placed in a conical flask with a magnetic bead, mouth covered with aluminum foil, over a magnetic stirrer. The solution is stirred for over 6 hours per batch at a constant speed of 500 1000rpm. Per batch was filtered using a musli and the liquid obtained was evaporated in a china dish, over a water bath for days, to obtain the desired consistency of the product. The final product was stored in a dark, vacuum sealed bottle to prevent hampering the antioxidant property. (Perc was 19.77%) Figure 1.1- mechanism of oxidative cellular damage mechanism of oxidative cellular damage Antioxidants play a major role in quenching the free radicals with ions and make them stable. Thus lowering the reactive oxygen species content in the body. According to the ORAC score (Oxygen radical absorption capacity) provided by the NIA (national institute of aging) at NIH (national institute of health), pomegranate tops the charts of high ORAC score in fruits/vegetables & other food sources.[7] plays vital role in inducing apoptosis in cancer cells, reduce skin ageing, heart disease, mood disorder, immune system, eye problems as well as memory loss issues.[8] The objective of this study is to evaluate the reverse-aging property of Punica granatum extract. The study consists of inducing aging artificially by external sources such as carbonated soft drinks & treating it with the help of antioxidant sources, juxtaposing with the naturally aged and younger models. Antioxidants play a major role in quenching the free radicals with ions and make them stable. Thus ecies content in the body. According to the ORAC score (Oxygen radical absorption capacity) provided by the NIA (national institute of aging) at NIH (national institute of health), pomegranate tops the charts of high ORAC score in [7] Antioxidants plays vital role in inducing apoptosis in cancer cells, reduce skin ageing, heart disease, mood disorder, immune system, eye problems as well as memory loss The objective of this study is to evaluate the Punica granatum L. peel extract. The study consists of inducing aging artificially by external sources such as carbonated soft drinks & treating it with the help of antioxidant sources, juxtaposing with the naturally aged and Materials and Methods Materials: Chemicals & Reagents: DPPH, DTNB, HCL, Epinephrine bitartrate, Reduced glutathione, Thio barbituric acid, Trichloro hydrochloride; Rankem. Ellagic acid; Sigma Aldrich. HDL kit, Urea kit; Erba. Pot.Hydrogen phosphate; Merck. Sodium bicarbonate, Sodium dihydrogen ortho phosphate; CDH. Blood withdrawal capillary, Centrifuge tubes, Eppendorf, Micropipette tips; Himedia. DPPH, DTNB, HCL, Animals: Epinephrine bitartrate, Reduced glutathione, Thio barbituric acid, Trichloro hydrochloride; Rankem. Ellagic acid; Sigma Aldrich. acetic acetic acid, acid, Tris Tris Wistar albino rats of body weight 150-250gm & 6 months of age, of either sex were provided by the institutional animal house and the off springs (2 weeks old) were divided into similar age groups for were housed in standard polypropylene cages and maintained under controlled room temperature (22±2°C) & humidity (55±5%) with 12:12 hour light and dark cycle. Every animal was provided with a commercially available rat pellet Wistar albino rats of body weight 150 months of age, of either sex were provided by the institutional animal house and the off springs (2 weeks old) were divided into similar age groups for the study. The animals were housed in standard polypropylene cages and maintained under controlled room temperature (22±2°C) & humidity (55±5%) with 12:12 hour light and dark cycle. Every animal was provided with a commercially available rat pellet diet and water ad libitum. Th CPCSEA (committee for the purpose of control and supervision of experimental animals) of Govt. of India were followed & prior permission was granted from were followed & prior permission was granted from gen phosphate; Merck. Sodium bicarbonate, Sodium dihydrogen ortho phosphate; CDH. Blood withdrawal capillary, Centrifuge tubes, Eppendorf, Micropipette tips; Equipments: Analytical balance; Shimadzu. Hot air oven; Narang scientifics. Electric water bath; Remi motors. Centrifuge machine; Shimadzu. Spectrophotometer, Micropipette, Auto analyzer, Measuring cylinder, Micropipette, Auto analyzer, Measuring cylinder, Analytical balance; Shimadzu. Hot air oven; Narang . The guidelines of the r bath; Remi motors. CPCSEA (committee for the purpose of control and supervision of experimental animals) of Govt. of India Centrifuge machine; Shimadzu. Spectrophotometer, @ IJTSRD | Available Online @ www.ijtsrd.com | Volume @ IJTSRD | Available Online @ www.ijtsrd.com | Volume – 2 | Issue – 4 | May-Jun 2018 Jun 2018 Page: 641
International Journal of Trend in Scientific Research and Development (IJTSRD) ISSN: 2456-6470 the Institutional Animal Ethics committee for conducting the animal Registration-no. IAEC/273/CPCSEA/SBS/003/2016- 2017 Phytochemical analysis: Total phenolic content (TPC) measured by Folin-Ciocalteau method (El- falleh et al., 2012) & total antioxidant capacity (TAC) was measured by Prieto et al., (1999). experimental studies. Experimental design/ protocol: Biological & physical parameters: All the parameters were measured at the end of 1st, 2nd & 3rd week, including the 0th day. Parameters include estimation of reduced glutathione(GSH)[9], estimation of lipid profile as high density lipoproteins (HDL)[10] & low density lipoproteins (LDL)[10], antioxidant activity assay or free radical scavenging activity; FRS (by DPPH; C18H12N5O6, M=394.33) as per the procedure by Barros et al (2007), estimation of body weight & memory retention (Morris water maze apparatus)[11] and lastly, estimation of superoxide dismutase (SOD)[12] Animals were divided into 5 main groups with 2 sub- groups each of 2 specific groups. As per the protocol the dose was orally administered for 3 weeks disease induction & 3 weeks disease treatment, while number of animals in each group was minimum 5. Group-I was the normal control group, which was administered saline orally. Then comes Group-II which is positive control group, administered only with soft drink, 1-2ml as their daily fluid needs. Now, Group-III is divided in two different doses i.e. T1(a) 50mg/kg & T1(b) 100mg/kg PPE by body weight. These groups were administered with soft drinks for first 3 weeks, to induce aging & then administered with specific doses as per groups for another 3 weeks. In Group-IV the soft drink is is administered the first 3 weeks & later PJ is administered, dividing the group in to two sub-groups i.e. T2(a) 2ml/kg & T2(b) 3ml/kg. Then the last group, Group-V; T3 is a combination of T1(a) & T2(a) doses. The group was administered with soft drink for the first 3 weeks like the other groups & then treated with 2ml/kg+50mg/kg by body weight of the model. Statistical analysis: Data obtained was presented as the statistical significance of difference between means, calculated by ANOVA followed by Dunett’s test (post hoc test). Values were expressed as Mean ±SEM ** P<0.001, *P<0.01, n=5 in each group. Results Phytochemical analysis claims the following contents presence in the peel extract and juice, as shown in table1. Table1.:QUALITATIVE PHYTOCHEMICAL SCREENING OF POMEGRANATE PEEL EXTRACT (PPE) AND POMEGRANATE JUICE (PJ) Phytochemical tests Compound detected Inference PPE ++ PJ +++ Carbohydrates Molish’s test Reducing sugar Glycosides Protein ++ + ++ +++ ++ +++ Benedict’s test Keller Kiliani’s test Xanthoproteic test Amino acid Phenolic compound Tannins Alkaloids Flavanoids Saponins Sterols Fixed oils ++ +++ ++ + ++ + + - +++ ++ + + +++ ++ + + Ninhydrin’s test Ferric chloride test Ferric chloride test Wagner’s test Lead acetate test Froth’s test Salkowski’s test Saponification test -,+,++,+++ refer to the intensity of the content @ IJTSRD | Available Online @ www.ijtsrd.com | Volume – 2 | Issue – 4 | May-Jun 2018 Page: 642
International Journal of Trend in Scientific Research and Development (IJTSRD) ISSN: 2456-6470 The total phenolic content present in the fruit juice and peel had to compared as an estimate of the result expected. This is shown in the table 2., along with the free radical scavenging capacity/ total antioxidant capacity of each of them, using DPPH method. Table 2.:TPC AND TAC ACTIVITY OF POMEGRANATE PEEL EXTRACT AND POMEGRANATE JUICE. Parameters PPE PJ 58.63±0.129 48.02±0.071 Total phenolic content (TPC); EA mg/g dry weight Total antioxidant capacity (TAC) by DPPH (EC50, µg/ml) Mean values with ± standard error, EA refers to Ellagic acid. 20.296±0.05 3.081±0.009 Biological & physical parameters were systematically evaluated for the Punica granatum L. juice & peel extracts with different dose levels, as mentioned earlier, used to treat the age induced rat models. Effect of Punica granatum L. on Body weight: In the present study soft drink (1-2ml/day) was administered orally in positive control group for 6 weeks to induce ageing. Positive control group shown weight gain & compared to normal control group. Pomegranate aqueous peel extract & fresh juice were prepared. Treatment groups were divided on the basis of doses as, group T1 (a) peel extract 50mg/kg & T1 (b) peel extract 100mg/kg of body weight. The group T2 (a) fruit juice 2ml/kg & group T2 (b) fruit juice 3ml/kg of body weight. Group T3 peel extract + fruit juice 100mg/kg + 3ml/kg of body weight. After 3 weeks treatment group T1 (b) results comparative weight loss. Whereas, among all the groups, group T3 results significant weight loss as compared to the positive control group, as mentioned in Table 3. Table 3: Effect on body weight (gm) Groups Day 0 Day 7 Day 14 Day 21 180±7.071 184±7.071 187±7.071 190±7.071 Normal control 180±17.67 187±17.67 190±14.00 200±14.00 Positive control 180±7.071 176±7.071 177±7.000 175±7.000 T1(a) 185±7.483 183±7.483 180±7.736 170±7.736 T1(b) 170±10.68 171±10.68 168±10.56 165±10.56 T2(a) 180±6.782 179±6.782 176±7.026 177±7.026 T2(b) 200±9.695 197±9.695 190±6.0** 180±6.000* T3 The statistical significance of difference between means is calculated by ANOVA followed by Dunett’s test (post hoc test). Values were expressed as Mean ±SEM ** P<0.001, *P<0.01, n=5 in each group. After 3 weeks treatment group T1 (b) results comparative increment in SOD level. Whereas, among all the groups, group T3 results significant increase in SOD level as compared to the positive control group (Table 4) @ IJTSRD | Available Online @ www.ijtsrd.com | Volume – 2 | Issue – 4 | May-Jun 2018 Page: 643
International Journal of Trend in Scientific Research and Development (IJTSRD) ISSN: 2456-6470 Table 4: Effect on SOD levels (U/m L) Groups Day0 Day7 Day14 Day 21 94.6 ±8.7 85.1 ±16.3 107.2 ± 16.2 98.2 ±10.3 Normal control 98.2 ±10.3 103.1 ± 9.3 94.6 ±8.7 85.1 ±16.3 Positive control 85.1 ±16.3 85.1 ±16.3 98.2 ±10.3 107.2 ± 16.2 T1(a) 94.6 ±8.7 110 ±10.8 114.3 ± 15.3114.3 ± 15.3 T1(b) 98.2 ±10.3 110 ±10.8 107.2 ± 16.2104.6 ± 17.8 T2(a) 94.6 ±8.7 107.2 ±16.2 104.6 ± 17.8 110 ±10.8 T2(b) 91.1 ±18.05 114.3 ±15.3 114.2 ± 13.9114.2 ± 13.9 T3 The statistical significance of difference between means is calculated by ANOVA followed by Dunett’s test (post hoc test). Values were expressed as Mean ±SEM ** P<0.001, *P<0.01, n=5 in each group. After the 3 weeks treatment of group T1 (b) results comparative increment in GSH level. Whereas, among all the groups, group T3 results significant increase in GSH level as compared to the positive control group (Table 6.3 & figure 6.3) Table 5: Effect on GSH level (µmol/m L) Groups Normal control Positive control T1(a) T1(b) T2(a) T2(b) T3 Day 0 70.3 ±5.4 72.6 ±5.3 78.6 ±7.7 52.1 ±6.3 66.6 ±4.9 70.3 ±5.4 75.4 ±18.3 Day7 70.3 ±5.4 70.3 ±5.4 90.4 ±14.4 66.6 ±4.9 72.6 ±5.3 72.6 ±5.3 98.4 ±14.9 Day 14 72.6 ±5.3 72.6 ±5.3 90.4 ±14.4 90.4 ±14.4 75.4 ±18.3 78.6 ±7.7 106.2 ± 20.4174.7 ± 16.4 Day 21 70.3 ±5.4 70.3 ±5.4 98.4 ±14.9 106.2 ±20.4 75.4 ±18.3 90.4 ±14.4 The statistical significance of difference between means is calculated by ANOVA followed by Dunett’s test (post hoc test). Values were expressed as Mean ±SEM ** P<0.001, *P<0.01, n=5 in each group. After the 3 weeks treatment, group T1 (b) results comparative increment in FRS level. Whereas, among all the groups, group T3 results significant increase in FRS level as compared to the positive control group (Table 6) Table 6: Effect on antioxidant level FRS (m mol/L) Groups Day 0 Day 7 Day 14 Day 21 874.1 ±128.3 366.3 ±53.6 874.1 ±128.3 667 ± 128.3 366.3 ± 53.6 961.72±172.3 400 ± 128.3 300 ± 53.6 961.72 ±172.3 1016 ± 138.5 810.1 ±169.9 366.3 ± 53.6 300 ± 53.6 987.2 ±218.3 Normal control Positive control T1(a) 961.72±172.3 366.3 ± 53.6 987.2 ±218.3 400 ± 53.6 1064.0± 70.7 816.1 ±169.9 T1(b) T2(a) 816.1 ±169.9 895.6 ±314.8 874.1 ±128.3 874.1 ±128.3 869.6 ±125.5 1016 ± 138.5 895.6 ±314.8 1124.0±105.3 T2(b) T3 The statistical significance of difference between means is calculated by ANOVA followed by Dunett’s test (post hoc test). Values were expressed as Mean ±SEM ** P<0.001, *P<0.01, n=5 in each group. @ IJTSRD | Available Online @ www.ijtsrd.com | Volume – 2 | Issue – 4 | May-Jun 2018 Page: 644
International Journal of Trend in Scientific Research and Development (IJTSRD) ISSN: 2456-6470 After 3 weeks treatment group T1 (b) results comparative decrement in LPO level. Whereas among all the groups, group T3 results significant decrease in LPO level as compared to the positive control group (Table 7) Table 7: Effect on LPO Groups Normal control Positive control T1(a) T1(b) T2(a) T2(b) T3 Day 0 46.85±0.16*** 49.92±1.07 Day 7 Day 14 49.92±1.07 Day 21 49.92±1.07 51.7±1.08*** 58.04±2.80*** 61.22±3.11 80.49±2.01 58.04±2.80***50.40±0.75** 58.04±2.80***49.92±1.07 61.22±3.11 61.22±3.11 51.7±1.08*** 50.40±0.75** 46.85±0.16***51.7±1.08*** 50.40±0.75** 58.04±2.80***58.04±2.80*** 50.40±0.75** 46.85±0.16*** 58.04±2.80*** 49.92±1.07 50.40±0.75** 61.22±3.11 46.85±0.16*** The statistical significance of difference between means is calculated by ANOVA followed by Dunett’s test (post hoc test). Values are expressed in mean ±SEM *** P<0.0001, **P<0.001, *P<0.01, n=5 in each group. After 3 weeks treatment group T1 (b) results comparative increment in HDL & decrement in LDL level. Whereas, among all the groups, group T3 results significant increase in HDL/decrease in LDL level as compared to the positive control group (Table 8 & 9) Table 8 & 9 : Effect on lipid profile levels (mg/dl) Groups (HDL) Normal control 1.00±0.26 Positive control 1.10±0.16 T1(a) T1(b) T2(a) T2(b) T3 Day 0 Day 7 0.98±3.11 0.95±0.26 1.25±0.09 1.97±0.16 1.08±0.09 2.79±0.16 2.09±0.09 Day 14 0.97±3.11 0.90±0.09 1.40±0.26 4.68±0.09 1.17±0.16 3.78±0.09 5.15±0.09 Day 21 0.95±0.28 0.80±0.26 1.42±0.42 5.67±0.16 1.21±0.09 5.67±0.16 6.21±0.09 1.15±0.09 1.40±0.16 1.00±0.09 1.80±0.16 1.00±0.09 Groups (LDL) Normal control Positive control 1.10±0.16 T1(a) T1(b) T2(a) T2(b) T3 Day 0 1.10±3.11 Day 7 2.24±0.09 1.90±0.28 0.94±0.16 1.15±0.28 0.92±3.11 0.94±0.16 0.88±3.11 Day 14 4.88±3.11 5.00±3.11 0.72±0.09 1.14±0.16 0.88±0.09 0.73±3.11 0.67±0.16 Day 21 5.20±0.16 5.53±3.11 0.70±0.28 1.12±3.11 0.64±0.28 0.57±0.09 0.50±3.11 1.10±3.11 1.20±0.09 1.05±3.11 1.01±0.28 1.15±0.09 The statistical significance of difference between means is calculated by ANOVA followed by Dunett’s test (post hoc test). Values were expressed as Mean ±SEM ** P<0.001, *P<0.01, n=5 in each group. Group T1 (b) results comparative increment in memory retention level. Whereas, group T3 results significant increase (Table 10) @ IJTSRD | Available Online @ www.ijtsrd.com | Volume – 2 | Issue – 4 | May-Jun 2018 Page: 645
International Journal of Trend in Scientific Research and Development (IJTSRD) ISSN: 2456-6470 Table 10: Effect on memory retention by Morris Water Maze (sec) Groups Day 0 Day 7 Day 14 Day 21 120 120 Normal control - - Positive control 110 110 100 100 T1(a) - 100 90 95 T1(b) 90 - - 110 T2(a) - 110 95 - T2(b) 100 100 80 80 T3 The values are mean of the set of 3 readings per group per day. Conclusion: In the present study, the combination of both juice & peel proved to be a great antioxidant source. Therefore, it could be concluded that pomegranate aqueous peel extract constituents scavenging free-radicals, which is a natural ageing factor. On the beneficiary the peel extract is a greater source of antioxidant than the fruit itself and can play a major role in taking over the industry of anti-ageing products in future. Punica gramatum L. peel extract holds the key to a whole new world of cures for ailments, yet to be discovered. Discussion: Sodas/ soft-drinks are modern day’s cigarettes & cell’s string like chromosomes are capped at either ends with a telomere, which are specifically targeted by the free radicals in the body. These telomeres work to keep the nucleic acid barred, hence working like the shoe lace tips. Every time a cell divides, the telomere splits on and on until they reach a stage when they can’t anymore. At this stage the sells start to dysfunction, like a candlewick and burns down and cease to exist all at once. contains the essential Acknowledgement: A sincere thanks to the concerned teachers, laboratory staff & friends of the Department of Pharmaceutical Sciences, Sardar Bhagwan Singh Post Graduate Institute, Balawala, for the intellectual, technical & emotional assistance throughout the term. In the present study, carbonated drink was administered (1-2ml/day/rat model), as the daily intake of liquid in rats is 1-2ml irrespective of the weight. The dependency on over consumption on soft- drinks/ carbonated-drinks was maintained for 3 weeks orally to all the groups except the vehicle control group. The +control group was administered with soft drink alone & no treatment at all. It showed increase in LPO & LDL levels. Whereas, samples T1(a) peel extract 50mg/kg, T1(b) peel extract 100mg/kg, T2(a) fruit juice 2ml/kg, T2(b) fruit juice 3ml/kg & T3 peel extract + fruit juice 100mg/kg + 3ml/kg respectively, showed signs of control & even increment in physical & memory retention levels, GSH, SOD, HDL, FRS levels at higher dose levels. T1(b) group gives a safe & significant increment levels where as the group T3 gives us maximum levels if compared to the positive control group & vehicle control group. Conflict of Interest: There are more than enough parameters to measure aging but the ones performed were most suitable. The only parameter that couldn’t be performed due to technical unavailability was a comparison of telomere length before and after treatment. This specific parameter can conclude the claims made by the research study. @ IJTSRD | Available Online @ www.ijtsrd.com | Volume – 2 | Issue – 4 | May-Jun 2018 Page: 646
International Journal of Trend in Scientific Research and Development (IJTSRD) ISSN: 2456-6470 6)Ou.B, Hampsch-Woodill.M, Prior.R.L 2001. "Development and validation of an improved oxygen radical absorbance capacity assay using fluorescent as the fluorescent probe". J. Agric. Food Chem. V49 I(10), pp: 4619–26. References: 1)Norman.H, Zahnle, Kevin.j, Kasting, James.F, et al. 1989, “Annihilation of ecosystems by large asteroid impacts on early Earth”. Nature London, Nature Publishing Group. V342 I(6246), pp 139- 142. 7)Kevin H. cheeseman, Margaret collins, Karen proudfoot, Trevor F. slater, T Graham W. burton,t Ann C. webbt and Keith U. ingoldt ,”Studies on lipid peroxidation in normal and tumour tissues The Novikoff rat liver tumour” Biochem. J. 1986 (Printed in Great Britain) Department of Biochemistry, Faculty University, Uxbridge V23 I5, pp 507-514. 2)Maher, Kevin.A, Stevenson, David.J, 1988. "Impact frustration of the origin of life". Nature London V331 I(6157), pp 612–614. 3)Boysen.S.T,1996. interference,symbolic chimpanzees (Pan Troglodytes. J Experimental Psychological Animal Behavior Process. ; V22, pp 76–86. Quantity-based representations in of Science, Brunel 8)Nat dismutase, catalase, and glutathione peroxidase in cultured cells and tissue” Author manuscript, available in PMC 2011 Jan 1.Published in final edited form as Nat Protoc. 2010. Published online 2009, V5 I(1), pp: 51–66. Protoc. “Measurement of superoxide 4)Gavrilov, L.A.Gavrilova, N.S. 2006. "Reliability Theory of Aging and Longevity", in Handbook of the Biology of Aging, Academic Press, San Diego, CA. pp. 3–42.Peter.M. Lansdorp Lessons from Mice without Telomerase1997; V139 I(2) ,pp: 309–312. 9)Clan Chem. Author manuscript “Direct Methods for Measuring HDL and LDL Cholesterol Compared with Ultracentrifugation” available in PMC 2015. Published in final edited form as, Clan Chem. 2010 June. Published online 2010 V56 I(6), pp: 977–986 5)Watts, Geoff , 2011. "Leonard Hayflick and the limits of ageing". The 2075.Graham.S.A., Hall.J., Sytsma.K., Shi.S. 2005. "Phylogenetic analysis of the Lythraceae based on four gene regions and morphology". Int. J. Pl. Sci. V166 I(6) ,pp: 995–1017 Lancet. V3 I7 pp: 10)Oberly Lw, Spitz DR. nitroblue tetrazolium, In: greenwald RA editor. Handbook of methods for oxygen radical. Research CRC press; Boca Raton, Florida; 1985. pp:217-220. @ IJTSRD | Available Online @ www.ijtsrd.com | Volume – 2 | Issue – 4 | May-Jun 2018 Page: 647