Download
1 / 6
60 likes | 65 Views
This study sought to examine the association between lagged profitability and the financial performance of non financial firms listed on the Ghana Stock Exchange GSE . Specifically, the study sought to explore the relationship between lagged profitability and the firms' financial performance as measured by ROA assess the association between lagged profitability and the firms' financial performance as measured by ROE and to examine the affiliation between lagged profitability and the firms' financial performance as measured by ROCE. Panel data extracted from the audited and published annual reports of fifteen 15 non financial firms for the period 2008 to 2017 was used for the study. From the study's Pearson Product Moment Correlation Coefficient estimates, an insignificantly positive association between lagged profitability and the firms' ROA and ROE was established. Also, an insignificantly negative affiliation between lagged profitability and the firms' ROCE was discovered at the 95 confidence interval. Even though the association between lagged profitability and the firms' financial performance was not statistically significant, the positive connection uncovered between lagged profitability and the firms' ROA and ROE is an indication that significant increases in lagged profitability could have led to significant increases in ROA or ROE and vice versa. Therefore, the determinants of firms' financial performance like liquidity, leverage, capital structure, operational efficiency, size, growth, tangibility, age, inflation, economic growth GDP , exchange rate, interest rate, competition, corporate taxes and market share among others, should be properly factored into the business decisions of the firms. Mohammed Musah | Yusheng Kong | Stephen Kwadwo Antwi "A Panel Data Analysis of the Interactions between Lagged Profitability and Firms' Financial Performance: Evidence from the Ghana Stock Exchange (GSE)" Published in International Journal of Trend in Scientific Research and Development (ijtsrd), ISSN: 2456-6470, Volume-3 | Issue-4 , June 2019, URL: https://www.ijtsrd.com/papers/ijtsrd23848.pdf Paper URL: https://www.ijtsrd.com/management/accounting-and-finance/23848/a-panel-data-analysis-of-the-interactions-between-lagged-profitability-and-firmsu2019-financial-performance-evidence-from-the-ghana-stock-exchange-gse/mohammed-musah<br>

E N D
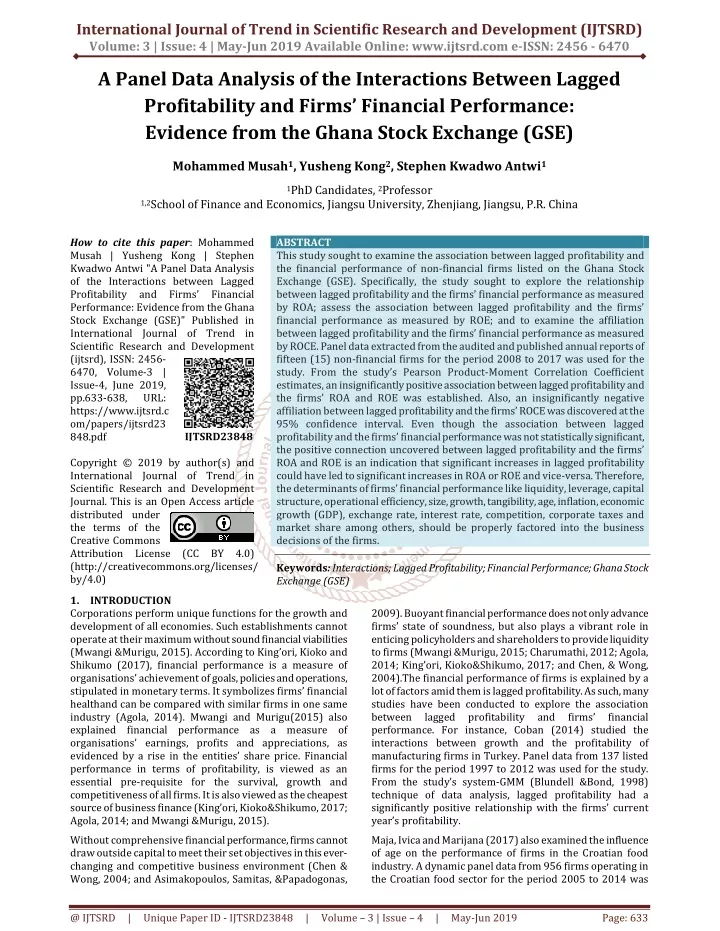
International Journal of Trend in Scientific Research and Development (IJTSRD) Volume: 3 | Issue: 4 | May-Jun 2019 Available Online: www.ijtsrd.com e-ISSN: 2456 - 6470 A Panel Data Analysis of the Interactions Between Lagged Profitability and Firms’ Financial Performance: Evidence from the Ghana Stock Exchange (GSE) Mohammed Musah1, Yusheng Kong2, Stephen Kwadwo Antwi1 1PhD Candidates, 2Professor 1,2School of Finance and Economics, Jiangsu University, Zhenjiang, Jiangsu, P.R. China How to cite this paper: Mohammed Musah | Yusheng Kong | Stephen Kwadwo Antwi "A Panel Data Analysis of the Interactions between Lagged Profitability and Firms’ Financial Performance: Evidence from the Ghana Stock Exchange (GSE)" Published in International Journal of Trend in Scientific Research and Development (ijtsrd), ISSN: 2456- 6470, Volume-3 | Issue-4, June 2019, pp.633-638, URL: https://www.ijtsrd.c om/papers/ijtsrd23 848.pdf Copyright © 2019 by author(s) and International Journal of Trend in Scientific Research and Development Journal. This is an Open Access article distributed under the terms of the Creative Commons Attribution License (CC BY 4.0) (http://creativecommons.org/licenses/ by/4.0) 1.INTRODUCTION Corporations perform unique functions for the growth and development of all economies. Such establishments cannot operate at their maximum without sound financial viabilities (Mwangi &Murigu, 2015). According to King’ori, Kioko and Shikumo (2017), financial performance is a measure of organisations’ achievement of goals, policies and operations, stipulated in monetary terms. It symbolizes firms’ financial healthand can be compared with similar firms in one same industry (Agola, 2014). Mwangi and Murigu(2015) also explained financial performance as a measure of organisations’ earnings, profits and appreciations, as evidenced by a rise in the entities’ share price. Financial performance in terms of profitability, is viewed as an essential pre-requisite for the survival, growth and competitiveness of all firms. It is also viewed as the cheapest source of business finance (King’ori, Kioko&Shikumo, 2017; Agola, 2014; and Mwangi &Murigu, 2015). Without comprehensive financial performance, firms cannot draw outside capital to meet their set objectives in this ever- changing and competitive business environment (Chen & Wong, 2004; and Asimakopoulos, Samitas, &Papadogonas, ABSTRACT This study sought to examine the association between lagged profitability and the financial performance of non-financial firms listed on the Ghana Stock Exchange (GSE). Specifically, the study sought to explore the relationship between lagged profitability and the firms’ financial performance as measured by ROA; assess the association between lagged profitability and the firms’ financial performance as measured by ROE; and to examine the affiliation between lagged profitability and the firms’ financial performance as measured by ROCE. Panel data extracted from the audited and published annual reports of fifteen (15) non-financial firms for the period 2008 to 2017 was used for the study. From the study’s Pearson Product-Moment Correlation Coefficient estimates, an insignificantly positive association between lagged profitability and the firms’ ROA and ROE was established. Also, an insignificantly negative affiliation between lagged profitability and the firms’ ROCE was discovered at the 95% confidence interval. Even though the association between lagged profitability and the firms’ financial performance was not statistically significant, the positive connection uncovered between lagged profitability and the firms’ ROA and ROE is an indication that significant increases in lagged profitability could have led to significant increases in ROA or ROE and vice-versa. Therefore, the determinants of firms’ financial performance like liquidity, leverage, capital structure, operational efficiency, size, growth, tangibility, age, inflation, economic growth (GDP), exchange rate, interest rate, competition, corporate taxes and market share among others, should be properly factored into the business decisions of the firms. Keywords: Interactions; Lagged Profitability; Financial Performance; Ghana Stock Exchange (GSE) 2009). Buoyant financial performance does not only advance firms’ state of soundness, but also plays a vibrant role in enticing policyholders and shareholders to provide liquidity to firms (Mwangi &Murigu, 2015; Charumathi, 2012; Agola, 2014; King’ori, Kioko&Shikumo, 2017; and Chen, & Wong, 2004).The financial performance of firms is explained by a lot of factors amid them is lagged profitability. As such, many studies have been conducted to explore the association between lagged performance. For instance, Coban (2014) studied the interactions between growth and the profitability of manufacturing firms in Turkey. Panel data from 137 listed firms for the period 1997 to 2012 was used for the study. From the study’s system-GMM (Blundell &Bond, 1998) technique of data analysis, lagged profitability had a significantly positive relationship with the firms’ current year’s profitability. Maja, Ivica and Marijana (2017) also examined the influence of age on the performance of firms in the Croatian food industry. A dynamic panel data from 956 firms operating in the Croatian food sector for the period 2005 to 2014 was IJTSRD23848 profitability and firms’ financial @ IJTSRD | Unique Paper ID - IJTSRD23848 | Volume – 3 | Issue – 4 | May-Jun 2019 Page: 633
International Journal of Trend in Scientific Research and Development (IJTSRD) @ www.ijtsrd.com eISSN: 2456-6470 used for the study. Among the study’s findings, lagged profitability had a significantly positive connection with the firms’ performance.Farah and Nina (2016) further analyzed factors that affected the profitability of small and medium enterprises listed on the Indonesian Stock Exchange. Secondary data sourced from index PEFINDO 25 was used for the study. From the study’s regression output, lagged profitability had a significantly inverse affiliation with the firms’ profitability.Also in Indonesia, Margaretha and Supartika (2016) examined factors that affected the profitability of 22 small and medium enterprises listed on the Indonesian Stock Exchange. From the study’s findings, lagged profitability had a significantly negative association with the contemporaneous profit margin of the SMEs. Finally, McDonald (1999) explored the determinants of manufacturing firms’ profitability in Australia. From the study’s findings, lagged profitability had a significant relationship with the firms’ current year’s profitability. The aforementioned studies among others, are flawed in scope in that, they failed to explore the strength and direction of the linear relationship that existed between lagged profitability and the financial performance of non- financial firms listed on the Ghana Stock Exchange (GSE). This study was therefore conducted to help fill that gap. Specifically, the study sought to examine the relationship between lagged profitability and the firms’ financial performance as measured by ROA; determine the association between lagged profitability and the firms’ financial performance as measured by ROE; and to identify the affiliation between lagged profitability and the firms’ financial performance as measured by ROCE. This study adds to the existing pool of literature on lagged profitability and its association with firms’ financial performance. This will serve as a reference source for students and researchers who may want to conduct further studies on this current topic. The rest of the study is organised as follows; section two presents literature and hypothesis that supported the topic understudy; whilst section three concentrates on the study’s research model and methodology. In the fourth section, various results that related to the study are outlined; whilst the fifth section discusses the study’s findings and tests the formulated hypothesis. The sixth section finally presents the study’s conclusion and policy implications. 2. REVIEW OF RELATED LITERATURE Kristina and Dejan (2017) researched on the profitability determinants of the agricultural industry in Hungary, Romania, Bosnia and Herzegovina, and Serbia. Panel data for the period 2011 to 2014 was used for the study. From the study’s findings, lagged profitability had a significantly positive influence on agricultural firms’ profitability in the countries. Odusanya, Yinusa and Ilo (2018) examined the determinants of the profitability of 114 firms listed on the Nigerian Stock Exchange for the period 1998 to 2012. Through the Generalized Method of Moments (GMM) approach of data analysis, lagged profitability had a significantly positive effect on the firms’ profitability. Schmidt (2014) conducted a study to find out whether social media played a significant role in determining the profitability of 392 American firms for the period 2005 to 2013. Data obtained primarily from the database, COMPUSTAT was used for the study. From the study’s findings, lagged profitability was a significant determinant of the firms’ financial performance. Isik and Tasgin (2017) examined the profitability manufacturing firms listed on the Borsa Istanbul Stock Exchange for the period 2005 to 2012. From the study’s dynamic panel data analysis, lagged profitability had a significantly positive influence on the firms’ profitability. Njimanted, Akume and Nkwetta (2017) investigated the effect of excess liquidity on the financial performance of commercial banks in Cameroon. Secondary data for the period 1990 to 2016 was used for the study. From the study’s Vector Auto Regressive (VAR) technique of data analysis, previous year’s ROA had a significantly positive influence on the banks’ financial performance as measured by ROA. Ahmad (2015) examined the influence of capital structure on the financial performance of listed establishments on the Bahrain Bourse. Data derived from the records of 17 non-financial listed firms for the period 2009 to 2013 was used for the study. From the study’s multivariate regression estimates, lagged performance measures ROE, ROA, EPS and Dividend Yield (DIYILD) significantly determined the firms’ financial performance. Stierwald (2009) conducted a study on the determinants of firms’ profitability. From the findings, lagged profitability had a significantly positive impact on the current year’s profitability of the firms. Vijayakumar (2011) researched on the determinants of the profitability of firms operating in the Indian automobile industry. From the study’s findings, past profitability was significantly associated with the current year’s profitability of the firms. Yazdanfar (2013) studied the profitability determinants of micro sector firms operating in Sweden. From the study’s findings, lagged profitability had a significantly positive effect on the firms’ current year’s profitability. Salman and Yazdanfar (2012) investigated the predictors of SMEs’ profitability in Sweden. From the study’s discoveries, lagged profitability significantly predicted the SMEs’ current year’s profitability. Goddard, Tavakoli and Wilson (2005) examined the profitability determinants of manufacturing and service sector firms in France, Italy, Spain, Belgium and the UK. Through the dynamic panel data approach, past profitability had a significantly positive influence on the firms’ profitability as measured by ROA. Neil (2009) conducted a study to identify the financial statement variables that were likely to have an impact on firms’ profitability. From the study’s findings, preceding year’s net profit margin and 3-year returns were significant determinants of the firms’ profitability as measured by ROA. 2.1 Hypothesis Development According to Alina (2017), a hypothesis is a suggested solution for an unexplained occurrence that does not fit into current accepted scientific theory. The basic idea of a hypothesis is that, there is no pre-determined outcome. For a hypothesis to be termed a scientific hypothesis, it has to be something that can be supported or refuted through carefully crafted experimentation or observation (Alina, 2017). The ambition of this study could not be achieved without the test of some hypothesis. Therefore, based on the reviews of various literature, the following hypothesis were developed for testing; H01:There is no significant relationship between lagged profitability and the firms’ financial performance as measured by ROA. H02:There is no significant relationship between lagged profitability and the firms’ financial performance as measured by ROE. determinants of 120 @ IJTSRD | Unique Paper ID - IJTSRD23848 | Volume – 3 | Issue – 4 | May-Jun 2019 Page: 634
International Journal of Trend in Scientific Research and Development (IJTSRD) @ www.ijtsrd.com eISSN: 2456-6470 H03:There is no significant relationship between lagged profitability and the firms’ financial performance as measured by ROCE. 3. RESEARCH MODEL AND METHODOLOGY This study was a quantitative study. The study was quantitative because it was based on numbers and statistics arranged in the form of tables; its findings could be replicated or repeated, given its high reliability; and it was based on a sample that was representative of the entire population. Specifically, the study was correlational because it sought to investigate the association between two variables in which none of the variables was manipulated. The study was finally panel in nature because its units of analysis were followed at specified time intervals over a long period. In other words, the study collected repeated measures from the same sample at different points in time. All non-financial firms that listed and traded their shares on the Ghana Stock Exchange (GSE) as of 31st December, 2017 formed the study’s target population. Because the study wanted to deal with a balanced data, a sample was made out of the entire population. The number of years in existence, technical suspension due to one reason or the other, unaudited financial records, non-existence of trend records, incomplete financial statements and the presentation of annual reports in foreign currencies either than that of the Ghana currency (because of the non-stability of the Ghana Cedi to major foreign currencies) were the factors or filters that were considered during the sampling process. Considering these factors or filters in making a choice out of the entire population implies, the study adopted the purposive or selective sampling technique in its sampling process. After critically considering the various factors or filters during the sampling process, fifteen (15) firms comprising of the Ghana Oil Company Ltd, Total Petroleum Ghana Ltd, Starwin Products Ltd, Camelot Ghana Ltd, Aluworks Ltd, Clydestone Ghana Ltd, African Champion Industries Ltd, Benson Oil Palm Plantation Ltd, Fan Milk Ltd, Guinness Ghana Breweries Ltd, Unilever Ghana Ltd, PZ Cussons Ghana Ltd, Produce Buying Company Ltd, Mechanical Lloyd Company Ltd and Sam Woode Ltd were selected for the study. This number represented 36.59% of the total number of listed firms or 53.57% of the total number of non-financial firms listed on the Ghana Stock Exchange (GSE). A balanced secondary panel data extracted from the audited and published annual reports of the sampled firms for the period 2008 to 2017 was used for the study. The annual reports of the firms comprised of the comprehensive income statement, statement of financial position, statement of cash flows, statement of changes in equity and notes to the accounts. These annual reports were obtained from the official website of the Ghana Stock Exchange (GSE). Both the descriptive and inferential techniques of data analysis were employed for the study. In the descriptive technique of data analysis, the mean, standard deviation, variance, minimum and maximum values, range, skewness and kurtosis of the study’s variables were analysed, whilst the Pearson Product-Moment Correlation Coefficient technique of data analysis was employed to establish the link between lagged profitability and the firms’ financial performance as measured by ROA, ROE and ROCE (inferential analysis). All the data analysis were conducted through the use of STATA version 15 statistical software package at α=5% (p≤0.05). Fig. 1: Conceptual Framework Figure 1 shows the conceptual framework that guided the conduct of the study. In the framework, the firms’ financial performance is proxiedby Return on Assets (ROA), Return on Equity (ROE) and Return (ROCE).Return on assets was calculated as the ratio of net income to total assets of the firms. Return on equity was also calculated as the net income divided by the total equity of the firms, whilst the ratio of net income to capital employed was used to compute the firms’ ROCE. On the other hand, lagged profitability was obtained by lagging the firms’ ROA values by one year. Table 1 presents a detailed summary of the study’s variables and their measurements; Table 1:Measurement of Study Variables Variable Proxy Financial Performance Financial Performance Financial Performance Independent Variable 4. EMPIRICAL RESULTS This aspect presents the empirical results of the study. The empirical results comprise of the descriptive analysis of the study variables and the bivariate associations between lagged profitability and the firms’ financial performance as measured by Return on Assets, Return on Equity (ROE) and Return on Capital Employed (ROCE). 4.1 Descriptive Analysis From Table 2, ROA had a mean value of 0.0052693. The mean ROA of 0.0052693 implies, the firms were making 0.52693 pesewas of profit on each cedi of investments made from the year 2008 to 2017. The positive mean figure for ROA is an indication that, the assets or investments of the firms were been used efficiently by management to generate profits. The ROA distribution had a maximum value of 0.7656 and a minimum value of -5.6487, leading to a range of 6.4143. The firms’ ROA also had a standard deviation of 0.4849762 and a variance of 0.2352019. This implies, data values of ROA deviated from both sides of the mean by 0.4849762, which is an indication that, the data values were not too widely dispersed from the mean. The figure -10.64317 being the skewness for ROA indicates that, the ROA distribution was highly negatively skewed or skewed to the left. This denotes that, a greater portion of the ROA distribution fell on the right side of the normal curve. In other words, the left tail of the ROA distribution was longer than that of the right tail. The kurtosis coefficient of 124.8778 [excess (K)=124.8778-3.0=121.8778] shows that, the ROA distribution was leptokurtic or slender in shape. Put simply, the ROA distribution was not normally distributed as it had fatter tails that asymptotically approached zero more slowly than the Gaussian distribution, and therefore produced more outliers than the normal distribution. on Capital Employed Measurement Net Income/Total Assets Net Income/Total Equity Net Income/Capital Employed ROA ROE ROCE ROA-1 One year lag of ROA @ IJTSRD | Unique Paper ID - IJTSRD23848 | Volume – 3 | Issue – 4 | May-Jun 2019 Page: 635
International Journal of Trend in Scientific Research and Development (IJTSRD) @ www.ijtsrd.com eISSN: 2456-6470 The ROE of the sampled firms also had a mean value of 0.167214. This implies, on the average, every cedi of common stockholders’ equity generated 16.7214 pesewas of net income. The positive mean ROE is an indication that, management were efficiently utilizing shareholder’s capital to generate income and profits. This serves as a favorable sign for potential investors because, they are likely to get a return on their investments. The positive average ROE is also not just an indication of the firms’ profitability, but shows that, the firms were good at using their retained earnings efficiently to generate revenues. The positive mean ROE of the firms further signposts that, they had a huge economic moat. Thus, the firms had the ability to maintain competitive advantage over their competitors by protecting their long-term profits and market share. The firms having an economic moat also implies, they were worthy enough to generate economic profits for a longer stretch of time, and were able to reinvest those cash flows at a high rate of return for a longer period. The firms’ ROE also had a standard deviation of 1.184918 and a variance of 1.404031. This is an indication that, data values of ROE deviated from both sides of the mean by 1.184918, implying, the values were a bit much dispersed from the mean. Return on Equity (ROE) of the sampled firms also had a minimum value of -4.5277 and a maximum value of 12.8951, leading to a range of 17.4228. The distribution for ROE was positively skewed with a coefficient of 7.859589, implying, the right tail of the ROE distribution was longer than that of the left tail. The kurtosis value of 91.75657 [excess (K)= 91.75657-3.0= -88.75657] shows that, the ROE distribution was leptokurtic or slender in shape. In other words, the ROE distribution was not normally distributed. Table 2: Descriptive Statistics on Study Variables S.D Variance Min. Max. 0.0052693 0.4849762 0.2352019 -5.6487 0.167214 1.184918 1.404031 -4.5277 12.8951 17.4228 0.1945633 1.09571 1.20058 -1.5666 12.8951 14.4617 0.002577 0.5093136 0.2594003 -5.6487 lagged profitability was higher and peakier (leptokurtic) than the normal distribution, implying it was of abnormal shape. 4.2 Correlational Analysis This section sought to explore the nexus between lagged profitability and the financial performance of non-financial firms listed on the Ghana Stock Exchange (GSE). The Pearson Product-Moment Correlation Coefficient technique of data analysis was adopted for that purpose and from Table 3, there was an insignificantly positive association between lagged profitability and the firms’ ROA at α=5%[r=0.1195, (p=0.1673)>0.05]. Even though the correlation between lagged profitability and ROA was trivial, the positive relationship between them implies, an increase in lagged profitability led to an increase in ROA and vice-versa, and a decrease in lagged profitability also led to a decrease in ROA and vice versa. The strength of association between lagged profitability and ROA can be justified by the coefficient of determination (r2 =0.0143) which indicates that 1.43% of the variations in ROA was accounted for by lagged profitability and 1.43% of the variations in lagged profitability was explained by ROA. The unexplained variances [98.57% or (1- r2 =0.9857)] may be attributed to other inherent variabilities. Table 3: Correlational Matrix of Study Variables Variable ROA Variable Obs ROA ROE ROCE ROA-1 Mean Range 6.4143 Skewness -10.64317 124.8778 7.859589 10.44939 -10.20912 114.0237 Kurtosis 150 150 150 150 0.7656 91.75657 122.057 0.7656 6.4143 The ROCE of the firms had a mean value of 0.1945633. The mean ROCE figure implies, for every cedi invested in capital employed, the firms made 19.45633 pesewas of profits. The positive ROCE figure depicts that, the firms were efficiently using their capital employed as well as their long-term financing strategies. The return on capital employed ratio must however be always higher than the rate at which firms borrow to fund their assets. For instance, if the sampled firms had borrowed at 10% and have achieved a return of 19.46%, it means the firms have made gains. Conversely, if the mean ROCE of the firms was to be lesser than the rate at which they had borrowed (say 0.05 or 5%), it means a loss on the part of the firms. The ROCE of the sampled firms had a standard deviation of 1.09571 and a variance of 1.20058. This means that, the data for ROCE deviated from both sides of the mean by 1.09571, which is an indication that, the data was a bit widely dispersed from the mean. The minimum and maximum values of ROCE were -1.5666 and 12.8951 respectively, leading to a range of 14.4617. The distribution for ROCE was highly positively skewed with a coefficient of 10.44939, implying a greater portion of the ROCE distribution fell on the left side of the normal curve. The kurtosis value of 122.057 [excess (K)=122.057-3.0=119.057] is an indication that, the ROCE distribution was higher and peakier (leptokurtic) than the Gaussian distribution which shows its abnormality. Finally, lagged profitability had a mean value of 0.002577, a maximum value of 0.7656 and a minimum value of -5.6487, resulting in a range of 6.4143.The firms’ lagged profitability also had a standard deviation of 0.5093136 and a variance of 0.2594003. This implies, dispersions or deviations around the mean lagged profitability was 0.5093136, which is an indication that, the data values of lagged profitability were a bit widely dispersed from the mean. The skewness value of - 10.20912 signifies that, the distribution for lagged profitability was highly negatively skewed or skewed to the left. This means, a greater portion of the distribution for lagged profitability fell on the right side of the normal curve. The kurtosis value of 114.0237 [excess (K)=114.0237- 3.0=111.0237] is an indication that, the distribution for ROA 1.0000 0.0037 (0.9642) -0.0156 (0.8498) 0.1195 (0.1673) ROE ROCE ROA-1 ROE 1.0000 0.9516* (0.0000) -0.0122 (0.8885) ROCE 1.0000 -0.0192 (0.8255) ROA-1 1.000 Note: * implies significance at 5% and values in parenthesis ( ) represent probabilities. The study also discovered an insignificantly negative association between lagged profitability and the firms’ ROE at the 5% significance level [r = -0.0122, (p=0.8885)>0.05]. Though the connection between lagged profitability and the firms’ ROE was not significant, the inverse link between the @ IJTSRD | Unique Paper ID - IJTSRD23848 | Volume – 3 | Issue – 4 | May-Jun 2019 Page: 636
International Journal of Trend in Scientific Research and Development (IJTSRD) @ www.ijtsrd.com eISSN: 2456-6470 two is an indication that, an increase in lagged profitability led to a decrease in ROE and vice-versa. The degree of association that existed between lagged profitability and the firms’ ROE can be substantiated by the coefficient of determination (r2 =0.0001) which shows that 0.01% of the variations in ROE was accounted for by lagged profitability and 0.01% of the variations in lagged profitability was explained by ROE. The unexplained variations [99.99% or (1-r2 =0.9999)] may be aligned to other factors that did not form part of the study. Finally, lagged profitability had an insignificantly negative affiliation with the firms’ ROCE at the 95% confidence interval [r=-0.0192, (p=0.8255)>0.05]. Even though the relationship between lagged profitability and the firms’ ROCE was not significant, the adverse association between lagged profitability and ROCE implies, an increase in lagged profitability led to a decrease in ROCE and vice-versa. The weight of the correlation between lagged profitability and the firms’ ROCE can be proven by the coefficient of determination (r2 =0.0004) which shows that 0.04% of the variations in ROCE was accounted for by lagged profitability and 0.04% of the variations in lagged profitability was explained by ROCE. The unexplained variances [99.96% or (1-r2 =0.9996)] may be accounted for by other variables that were not included in the study. 5. DISCUSSIONS AND TESTS OF HYPOTHESIS This section discusses the study’s findings. The discussions are related to the review of relevant literature and are conducted in the order of; the relationship between lagged profitability and the firms’ financial performance as measured by ROA; the association between lagged profitability and the firms’ financial performance as measured by ROE; and the affiliation between lagged profitability and the firms’ financial performance as measured by ROCE. Each subdivision concludes with a test of hypothesis that was developed for the study. 5.1 The relationship between lagged profitability and the firms’ financial performance (ROA) The study discovered an insignificantly positive association between lagged profitability and the firms’ ROA at α=5% [r=0.1195, (p=0.1673)>0.05]. This finding was inconsistent with that of Odusanya, Yinusa and Ilo (2018) whose research on 114 firms listed on the Nigerian Stock Exchange, found a significantly positive association profitability and the firms’ current year’s profitability. The finding was also inconsistent with that of Maja, Ivica and Marijana (2017) whose dynamic study on 956 firms operating in the Croatian food sector, uncovered a significantly positive interaction between lagged profitability and the firms’ performance. The finding was further inconsistent with that of Kristina and Dejan (2017) whose research on the agricultural industry of Bosnia and Herzegovina, Hungary, Serbia and Romania, disclosed a significantly positive connection between lagged profitability and the firms’ current year’s profitability. The finding was finally not in tandem with that of Yazdanfar (2013) whose study on the profitability determinants of micro sector firms operating in Sweden, disclosed a significantly positive link between lagged profitability and the firms’ current year’s profitability. 5.1.1 Hypothesis Testing An insignificantly positive association between lagged profitability and the firms’ ROA was discovered at α=5%[r = 0.1195, (p=0.1673)>0.05]. The study therefore failed to reject the null hypothesis (H01) that lagged profitability had no significant relationship with the firms’ financial performance as measured by ROA, and concluded that lagged profitability had an insignificantly positive affiliation with the firms’ financial performance as measured by ROA. 5.2 The Association between Lagged Profitability and the Firms’ Financial Performance (ROE) The study also discovered an insignificantly negative association between lagged profitability and the firms’ ROE at the 95% confidence (p=0.8885)>0.05]. This finding did not support that of Farah and Nina (2016) whose study on small and medium enterprises listed on the Indonesian Stock Exchange, discovered a significantly inverse link between lagged profitability and the firms’ current year’s profitability. The finding was also in disagreement with that of Isik and Tasgin (2017) whose dynamic panel study on 120 manufacturing firms listed on the Borsa Istanbul Stock Exchange, found a significantly positive association profitability and the firms’ financial performance. The finding further contrasted that of Ahmad (2015) whose research on 17 non-financial firms listed on the Bahrain Bourse, uncovered a significant affiliation between lagged profitability and the financial performance of the firms as measured by ROE, ROA, EPS and Dividend Yield.The finding was finally in disagreement with that of Vijayakumar (2011) whose study on firms operating in the Indian automobile industry, found a significant association between past profitability and the current year’s profitability of the firms. 5.2.1 Hypothesis Testing An insignificantly negative association between lagged profitability and the firms’ ROE was discovered at the 95% confidence interval [r= -0.0122, (p=0.8885)>0.05]. The study therefore failed to reject the null hypothesis(H02) that lagged profitability had no significant connection with the firms’ financial performance as measured by ROE, and concluded that lagged profitability had an insignificantly negative association with the firms’ financial performance as measured by ROE. 5.3 The Affiliation between Lagged Profitability and the Firms’ Financial Performance (ROCE) The study finally uncovered an insignificantly negative affiliation between lagged profitability and the firms’ ROCE at the 5% level of significance [r = -0.0192, (p=0.8255)>0.05]. This finding disagreed with that of Njimanted, Akume and Nkwetta (2017) whose VAR study for the period 1990 to 2016 established a significantly positive association between lagged profitability and the financial performance of the firms under study. The finding also disagreed with that of Schmidt (2014) whose study on 392 American firms for the period 2005 to 2013, found a significant relationship between lagged profitability and the firms’ financial performance. The finding was further inconsistent with that of Margaretha and Supartika (2016) whose research on 22 Small and Medium Enterprises (SMEs) listed on the Indonesian Stock Exchange, disclosed a significantly negative association between lagged profitability and the contemporaneous profit margin of the SMEs. The finding finally contrasted that of Coban (2014) whose GMM study on 137 listed manufacturing firms in Turkey, established a significantly positive interaction between lagged profitability and the firms’ current year’s profitability. interval [r = -0.0122, between lagged between lagged @ IJTSRD | Unique Paper ID - IJTSRD23848 | Volume – 3 | Issue – 4 | May-Jun 2019 Page: 637
International Journal of Trend in Scientific Research and Development (IJTSRD) @ www.ijtsrd.com eISSN: 2456-6470 [2]Ahmad, M. O. G. (2015). The effect of capital structure on the financial performance of listed companies in Bahrain Bourse. Journal of Finance and Accounting, 3(3), 50-60. [3]Alina, B. (2017). What is a scientific hypothesis? Retrieved from https://www.livescience.com/21490- what-is-a-scientific-hypothesis-definition-of hypothesis.html [4]Asimakopoulos, I., Samitas, A., & Papadogonas, T. (2009). Firm-specific and economy wide determinants of firm profitability: Greek evidence using panel data. Managerial Finance, 35(11), 930-939. [5]Charumathi, B. (2012). On the determinants of profitability of Indian life insurers-An empirical study. Proceedings of the World Congress on Engineering, 1, 978-88. [6]Chen, R., & Wong, K. A. (2004). The determinants of financial health of Asian insurance companies. The Journal of Risk and Insurance, 71(3), 469-99. [7]Coban, S. (2014). The interaction between firm growth and profitability: Evidence from Turkish manufacturing firms. The Journal of Knowledge Economy & Knowledge Management Volume: IX Fall, pp. 73-82. [8]Farah, M., & Nina, S. (2016). Factors affecting profitability of Small Medium Enterprises (SMEs) firm listed in Indonesia Stock Exchange. Journal of Economics, Business and Management, 4(2), 132-137. [9]Goddard, J., Tavakoli, M., & Wilson, J. O. S. (2005). Determinants of profitability manufacturing and services: Evidence from dynamic panel model. Applied Financial Economics, 15(18), 1269-1282. [10]Isik, O., &Tasgin, U. F. (2017). Profitability and its determinants in Turkish manufacturing industry: Evidence from a dynamic panel model. International Journal of Economics and Finance, 9(8), 66-75. [11]King’ori, S. N., Kioko, W. C., & Shikumo, H. D. (2017). Determinants of financial performance of microfinance banks in Kenya. Research Journal of Finance Accounting, 8(16), 1-8. [12]Kristina, M., &Dejan, J. (2017). The determinants of agricultural industry profitability: Evidence from Southeast Europe. Custose@gronegocio online, 13(1), 154-173. [13]Maja, P., Ivica, P., & Marijana, Ć., (2017). The influence of age on firm performance: Evidence from the Croatian Food Industry. Journal of Eastern Research in Business and Economics, Vol. 2017(2017), http://www.ibimapublishing.com/journals/JEERBE/ jeerbe.html [14]Margaretha, F., & Supartika, N. (2016). Factors affecting profitability of Small-Medium Enterprises (SMEs) firms listed in Indonesia Stock Exchange. Journal of Economics, Business and Management, 4 (2), 132-137. [15]McDonald, J. (1999). The determinants of firm profitability in Australian manufacturing. The Economic Record, 75(229), 115-26. [16]Mwangi, M., & Murigu, J. W. (2015). The determinants of financial performance in general insurance companies in Kenya. European Scientific Journal, Vol.11, No.1, ISSN: 1857-7881 (Print), e-ISSN 1857- 7431. 5.3.1 Hypothesis Testing An insignificantly negative affiliation between lagged profitability and the firms’ ROCE was discovered at the 5% level of significance [r = -0.0192, (p=0.8255)>0.05]. The study therefore failed to reject the null hypothesis (H03) that lagged profitability had no significant relationship with the firms’ financial performance as measured by ROCE, and concluded that lagged profitability had an insignificantly inverse association with the firms’ financial performance as measured by ROCE. Table 4: Summary of the Test of Hypothesis Analytical Tool Hypothesis Result H01: There is no significant relationship between lagged profitability and the firms’ financial performance as measured by ROA. H02: There is no significant relationship between lagged profitability and the firms’ financial performance as measured by ROE. H03: There is no significant relationship between lagged profitability and the firms’ financial performance as measured by ROCE. Correlation Accepted Correlation Accepted (listed) Correlation Accepted 6. CONCLUSION AND POLICY IMPLICATIONS This study sought to examine the association between lagged profitability and the financial performance of non-financial firms listed on the Ghana Stock Exchange (GSE). Specifically, the study sought to explore the relationship between lagged profitability and the firms’ financial performance as measured by ROA; assess the association between lagged profitability and the firms’ financial performance as measured by ROE; and to examine the affiliation between lagged profitability and the firms’ financial performance as measured by ROCE. Panel data extracted from the audited and published annual reports of fifteen (15) non-financial firms for the period 2008 to 2017 was used for the study. From the study’s Pearson Product-Moment Correlation Coefficient estimates, an insignificantly positive association between lagged profitability and the firms’ ROA and ROE was established. Also, an insignificantly negative affiliation between lagged profitability and the firms’ ROCE was discovered at the 95% confidence interval. Even though the association between lagged profitability and the firms’ financial performance was not statistically significant, the positive connection uncovered between lagged profitability and the firms’ ROA and ROE is an indication that significant increases in lagged profitability could have led to significant increases in ROA or ROE and vice-versa. Therefore, the determinants of firms’ financial performance like liquidity, leverage, capital structure, operational efficiency, size, growth, tangibility, age, inflation, economic growth (GDP), exchange rate, interest rate, competition, corporate taxes and market share among others, should be properly factored into the business decisions of the firms. REFERENCES [1]Agola, T. (2014). Credit policy and financial performance of microfinance institutions in Kenya. Unpublished MBA Project. University of Nairobi, Kenya. in European and Europe @ IJTSRD | Unique Paper ID - IJTSRD23848 | Volume – 3 | Issue – 4 | May-Jun 2019 Page: 638