Download
1 / 8
80 likes | 84 Views
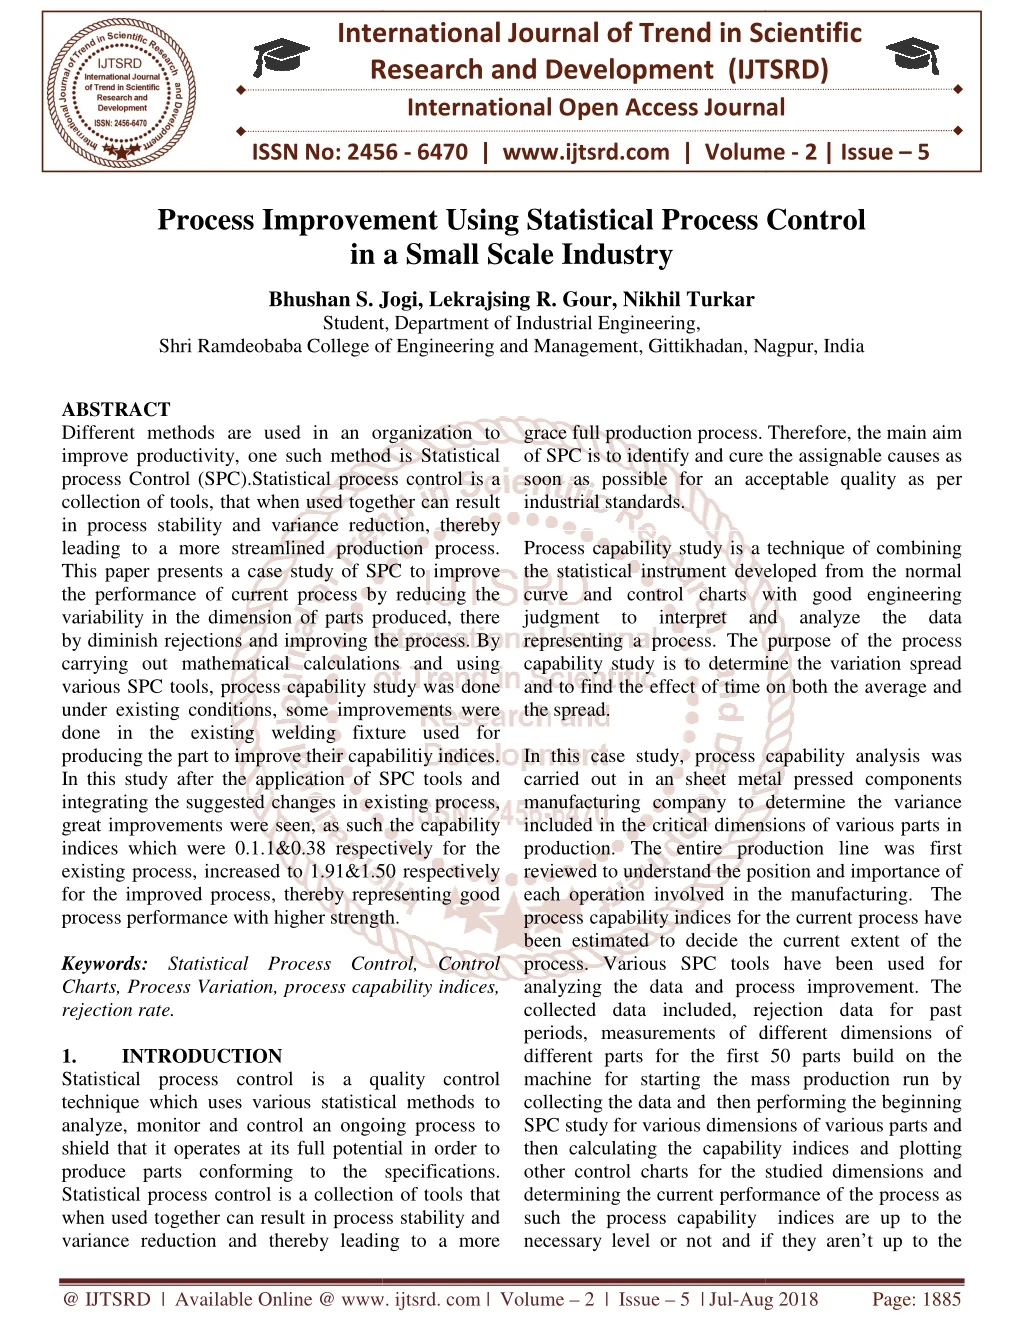
Different methods are used in an organization to improve productivity, one such method is Statistical process Control SPC .Statistical process control is a collection of tools, that when used together can result in process stability and variance reduction, thereby leading to a more streamlined production process. This paper presents a case study of SPC to improve the performance of current process by reducing the variability in the dimension of parts produced, there by diminish rejections and improving the process. By carrying out mathematical calculations and using various SPC tools, process capability study was done under existing conditions, some improvements were done in the existing welding fixture used for producing the part to improve their capabilitiy indices. In this study after the application of SPC tools and integrating the suggested changes in existing process, great improvements were seen, as such the capability indices which were 0.1.1and0.38 respectively for the existing process, increased to 1.91and1.50 respectively for the improved process, thereby representing good process performance with higher strength. Bhushan S. Jogi | Lekrajsing R. Gour | Nikhil Turkar "Process Improvement Using Statistical Process Control in a Small Scale Industry" Published in International Journal of Trend in Scientific Research and Development (ijtsrd), ISSN: 2456-6470, Volume-2 | Issue-5 , August 2018, URL: https://www.ijtsrd.com/papers/ijtsrd17144.pdf Paper URL: http://www.ijtsrd.com/engineering/industrial-engineering/17144/process-improvement-using-statistical-process-control-in-a-small-scale-industry/bhushan-s-jogi<br>

E N D
International Research Research and Development (IJTSRD) International Open Access Journal Process Improvement Using Statistical Process Control in a Small Scale Industry International Journal of Trend in Scientific Scientific (IJTSRD) International Open Access Journal ISSN No: 2456 ISSN No: 2456 - 6470 | www.ijtsrd.com | Volume 6470 | www.ijtsrd.com | Volume - 2 | Issue – 5 Process Improvement Using Statist in a Small ical Process Control Jogi, Lekrajsing R. Gour, Nikhil Turkar Bhushan S. Jogi Student, Student, Department of Industrial Engineering, Ramdeobaba College of Engineering and Management, Gittikhadan, Nagpur, India Shri Ramdeobaba College of Engineering and Management, Nagpur, India ABSTRACT Different methods are used in an organization to improve productivity, one such method is process Control (SPC).Statistical process control is a collection of tools, that when used together can result in process stability and variance reduction, leading to a more streamlined production process. This paper presents a case study of SPC to improve the performance of current process by reducing the variability in the dimension of parts produced, by diminish rejections and improving the process. carrying out mathematical calculations and using various SPC tools, process capability study was done under existing conditions, some improvements were done in the existing welding fixture used for producing the part to improve their capabiliti In this study after the application of SPC tools and integrating the suggested changes in existing process, great improvements were seen, as such the capability indices which were 0.1.1&0.38 respectively for the existing process, increased to 1.91&1.50 respectively for the improved process, thereby representing good process performance with higher strength. Keywords: Statistical Process Control, Control Charts, Process Variation, process capability indices, rejection rate. 1. INTRODUCTION Statistical process control is a quality technique which uses various statistical methods to analyze, monitor and control an ongoing process to shield that it operates at its full potential in order to produce parts conforming to the specifications. Statistical process control is a collection of tools that when used together can result in process stability and variance reduction and thereby leading to a more variance reduction and thereby leading to a more grace full production process. Therefore, the main aim of SPC is to identify and cure the assignable causes as soon as possible for an acceptable quality as per industrial standards. Process capability study is a technique of combining the statistical instrument developed from the normal curve and control charts with good engineering judgment to interpret and analyze the data representing a process. The purpose of the process capability study is to determine the variation spread and to find the effect of time on both the average and the spread. In this case study, process capability analysis was carried out in an sheet metal pressed c manufacturing company to determine the variance included in the critical dimensions of various parts in production. The entire production line was first reviewed to understand the position and importance of each operation involved in the manufact process capability indices for the current process have been estimated to decide the current extent of the process. Various SPC tools have been used for analyzing the data and process improvement. collected data included, rejection data for periods, measurements of different dimensions of different parts for the first 50 parts build on the machine for starting the mass production run by collecting the data and then performing the beginning SPC study for various dimensions of various p then calculating the capability indices and plotting other control charts for the studied dimensions and determining the current performance of the process as such the process capability indices are up to the necessary level or not and if they ar necessary level or not and if they aren’t up to the Different methods are used in an organization to one such method is Statistical (SPC).Statistical process control is a that when used together can result in process stability and variance reduction, thereby leading to a more streamlined production process. full production process. Therefore, the main aim of SPC is to identify and cure the assignable causes as an acceptable quality as per Process capability study is a technique of combining the statistical instrument developed from the normal curve and control charts with good engineering judgment to interpret and analyze the data ting a process. The purpose of the process capability study is to determine the variation spread and to find the effect of time on both the average and y of SPC to improve the performance of current process by reducing the variability in the dimension of parts produced, there by diminish rejections and improving the process. By carrying out mathematical calculations and using pability study was done some improvements were done in the existing welding fixture used for part to improve their capabilitiy indices. In this study after the application of SPC tools and changes in existing process, In this case study, process capability analysis was carried out in an sheet metal pressed components manufacturing company to determine the variance included in the critical dimensions of various parts in The entire production line was first reviewed to understand the position and importance of each operation involved in the manufacturing. The process capability indices for the current process have been estimated to decide the current extent of the process. Various SPC tools have been used for analyzing the data and process improvement. The as such the capability indices which were 0.1.1&0.38 respectively for the increased to 1.91&1.50 respectively thereby representing good ce with higher strength. Statistical Process Control, Control Charts, Process Variation, process capability indices, rejection data for past measurements of different dimensions of different parts for the first 50 parts build on the machine for starting the mass production run by collecting the data and then performing the beginning SPC study for various dimensions of various parts and then calculating the capability indices and plotting other control charts for the studied dimensions and determining the current performance of the process as such the process capability indices are up to the Statistical process control is a quality control technique which uses various statistical methods to analyze, monitor and control an ongoing process to shield that it operates at its full potential in order to produce parts conforming to the specifications. tion of tools that when used together can result in process stability and @ IJTSRD | Available Online @ www @ IJTSRD | Available Online @ www. ijtsrd. com | Volume – 2 | Issue – 5 | Jul-Aug 2018 Aug 2018 Page: 1885
International Journal of Trend in Scientific Research and Development (IJTSRD) ISSN: 2456-6470 required level then finding the root cause which is causing the variation and thus stating why the current process is not able to meet the required levels and once the assignable root is known, finding ways to improve it and implementing the improvements and then again doing the SPC study after improvement to know whether the performance of process is stable or not and if it fulfills requirement maintaining it and if not then repeating the same procedure. 2. LITERATURE REVIEW The concept of process capability and statistical process control skills have been in use from very long time and has involved huge amount of research and improvements to help clarify and improve the process performances.SPC is a tool that will differentiate between cause-specific and common to the variation and it will be used to keep the management process that is not by management because it requires a high level of motivation and not merely meet the requirements and customer (Phyanthamilkumaran & Fernando, 2015). Wright (2000) discussed the cumulative distribution function of process capability indexes. The process- capability indices, including Cp, Cpk and Cpm, have been proposed in manufacturing industry to provide a quick indication of how a process has conformed to its specifications, which are preset by manufacturers and customers. Mostafaeipour et al. (2012) presented a case study in ceramic tile manufacturing industry. The aim was to establish various SPC techniques to minimize the consume and reduce unwanted defects. For the completion of goal they used various SPC techniques like histogram, control charts, fishbone diagram, Pareto analysis and cause and effect diagram, check sheets.SPC technique helped to improve the process and identify the unwanted fault. Raghuraman et al. (2012) also did work in the domain of application of SPC, the implementation of the Statistical Tools along with the SPC and Process Capability Studies, decline the process capability, unless it is used in a right way. It was noted that the productions process was not in normal condition before these techniques are implemented into the process. IgnatioMadanhire et al. (2016) explained the application of statistical manufacturing industry in a developing country. This research focused on studying the statistical process control tool in manufacturing systems with the broad aim of upgrading them to improve on quality and cost effectiveness. There was need to check gauges and machines. There was need to be operators to be trained .It was noted that there was reduction in cost after implementation of techniques. Ghazi Abu Taher & Md. Jahangir Alam(2014) illustrated the use of statistical process control in manufacturing industry for improving the quality of production line. The objective was to identify the defect of the company and create a better solution to improve various the production line performance. Various causes of the defect were analyzedand these causes were eliminated by using various SPC technique. The literature review reported in this section has revealed the trend that although the process capability analysis is a traditional approach, it can be very effectively implemented from the perspective of achieving productivity improvement. This trend favours us to conduct a case study on process capability analysis and Statistical Process Control to achieve improvement in processes and thereby, productivity enhancement. 3. STATISTICAL PROCESS AND ITS COMPONENTS : Statistical process control is a method of quality control which employs statistical methods to monitor and control a process. This helps to ensure that the process operates efficiently, specification-conforming products with less waste. The various Components of SPC are described below: 3.1 Flow Chart Flowcharts are pictorial representations of a process. By breaking the process down into its constituent steps, flowcharts can be useful in identifying where errors are Likely to be found in the system. In quality improvement work, flowcharts are particularly useful for displaying how a process currently functions or could ideally function. 3.2 Check sheet The function of a check sheet is to present information in an efficient, Graphical format. This may be accomplished with a simple listing of items. satisfaction alone CONTROL producing more process control in @ IJTSRD | Available Online @ www. ijtsrd. com | Volume – 2 | Issue – 5 | Jul-Aug 2018 Page: 1886
International Journal of Trend in Scientific Research and Development (IJTSRD) ISSN: 2456-6470 However, the Utility of the check sheet may be significantly enhanced in some instances by incorporating a depiction of the system under analysis into the form. Pareto chart Pareto is a bar chart comparing the causes of problems with their frequencies. Based on Pareto principle, 80% of results rise from 20% of factors, in other words, although there may be many factors for existing problems, a few of them are important and most problems can be solved by removing them. Using Pareto chart, different causes for inappropriate effects can be categorized and it can be shown quickly which category is clearly more important. 3.3 Control charts Among seven SPC tools, control diagram is the most important part. The process variations can be controlled using control diagrams, and defective products can be avoided by some preventive actions. Here, it means controls diagrams R, and X are the most popular control charts. 3.4 Cause and effect Diagram This diagram, also called an Ishikawa diagram (or fish bone Diagram) is used to associate multiple possible causes with a single effect. Causes in a Cause & effect diagram are frequently arranged into four major’s categories. While these Categories can be anything: Manpower, methods, materials and Machinery. 3.5 Histogram A Histogram is a specialized type of bar chart. Individual data points are grouped together in classes, so that you can get an idea of how frequently data in each class occur in the data set. Histograms provide a simple, graphical view of accumulated data. Usually, in the best situation, histogram has a bell curve form which is symmetrical and the most of data has been aggregated around the center. 3.6 Process capability indices (Cp, Cpk) Process capability is one of the important items in production. A process may be controlled statistically, but its products may not be in the range being considered by the customer. Using process capability indices, a specific production range can be determined for a component as a fraction of its tolerance range. Figure.1, shows the upper and lower specification limits and the target value. The mean and standard deviation of the sample values are calculated, which defines the spread of the process. It shows the current process spread with respect to the acceptable performance spread. A process where almost all the measurements fall inside the specification limits is called a capable process. Fig.1. process spread and maximum specification limit. − σ Usl lsl = .......... ..... 1 Cp 6 Usl * − σ X = .......... ... 2 Cpu 3 * − X Lsl σ = .......... .... 3 Cpl 3 * = min( , )..... 4 Cpk Cpu Cpl Most capability indices estimates are valid only if the sample size used is "large enough". Large enough is generally thought to be about 50 independent data values. For progressing in our study initially we took 50 reading of each critical dimension of the parts. Then the same readings were fed into MINITAB software to perform various Statistical Process Control study. Various values of process capability indices carry different meanings and they are described below in Table 1. Table 1: Process capability indices Capability index CPK = CP Process located exactly at the center of the specification limit CP < 1 Process is not adequate Estimates in the process @ IJTSRD | Available Online @ www. ijtsrd. com | Volume – 2 | Issue – 5 | Jul-Aug 2018 Page: 1887
International Journal of Trend in Scientific Research and Development (IJTSRD) ISSN: 2456-6470 which are having major problems and accounting to rejections and from the past data. We came to know that there is a single critical dimension of 57mm having tolerance of (±0.8mm) that was leading to maximum rejections of the part as this dimension affected the mounting of part in its final place of application. Also major rejection of this part was due to this single dimension and therefore we focused our study on this part for the 5mm dimension to proceed for our SPC study. The data collected for this part is shown below in Table 2. This shows that from all the critical dimensions, the dimension of 57mm has maximum rejection rate of about 40%. Table 2: Data collected Past rejection data for the part No.9139. 1 ≤ CPK < 1.33 CP ≥ 1.33 Process is adequate Process is satisfactory enough CP ≥ 1.66 Process is very satisfactory CPK CPK ≠ Process is not enough, a new process parameter selected must be METHODOLOGY The study was carried out in a small scale industry dealing in production and supplying of sheet metal press components, machined components with fabricated steel assemblies for automobile industry. In this case study, Statistical process control study was implemented in the industry to improve the performance of the process involving rejection and rework. For progressing in our study we collected the data for past period and did a detailed analysis of the data to find out the current performance of the parts. We did rejection data analysis and plotted paretto chart to find out the part involving high rejection rate and also to determine the critical parts in it. From the analysis, we found out that out of several parts being produced, part no.9139 involved very high rejection rate and accounted to a major share of total parts being rejected .Therefore we selected this part for our study. Initially we did the SPC study for a part having number. 9139. In methodology, study of process characteristics of part has been done. Collection of data about forming process of child parts was carried out. Also the collection of readings of critical dimension i.e. 57 was done and afterwards X and R charts were plotted for the respective dimension. After plotting the control charts next step was to calculate process capability indices (cp, cpk, pp, ppk ). The results which were obtained help to identify the scope of improvement and do the same. After required improvement next step was to carry out the SPC study again for the critical dimension and check whether the process was under control or not. Different SPC tools such as histogram, pareto chart, control charts, cause and effect diagram, process capability studies were used. Aim of the study was to improve the process capability and to reduce the rejection rate. 4. DATA COLLECTION AND ANALYSIS We collected the past data for this part from the quality control department to know the dimensions Dimensions parts rejected 160 150 215 212 495 1232 % values 12.99 12.18 17.45 17.21 40.18 100 A(60 mm) B(57 mm) C ( 178 mm) D (88 mm) E ( 57 mm) Total With help of various measuring instruments (vernier height gauge, magnetic v-blocks, vernier calipers, dial height gauges, etc.) we took 50 continuous readings of the part dimension. Table 3 gives detail about the part and its specifications whereas the readings are shown below in Table 4. Table 3: information of part under study Part number: Product dimensions : Chart Name : Upper spec limit Target lower spec limit Table 4: continuous 50 readings of the part for 5mm dimension Part Number in mm 1 57.7 2 57.6 3 57.7 4 58.6 5 57.3 9139 57±0.8mm 57.8mm 57mm 56.2mm Dimension Part Number 26 27 28 29 30 Dimension in mm 57.6 57.3 57.19 57.5 57.45 @ IJTSRD | Available Online @ www. ijtsrd. com | Volume – 2 | Issue – 5 | Jul-Aug 2018 Page: 1888
International Journal of Trend in Scientific Research and Development (IJTSRD) ISSN: 2456 International Journal of Trend in Scientific Research and Development (IJTSRD) ISSN: 2456 International Journal of Trend in Scientific Research and Development (IJTSRD) ISSN: 2456-6470 x bar and Rbar charts and showing histogram embedded in the normal distribution curve. x bar and Rbar charts and showing histogram embedded in the normal distribution curve. This shows that there variation in the data and the process is slightly shifted towards the USL of the dimension and is producing parts with dimension ranging in positive tolerance zone. This can also be seen in the capability six pack study using Minitab. Thus it paves us the way to further synthesize the process and find out the causes due to which there is presence of variation in the data. For this purpose we did a root cause analysis and plotted a cause and effect diagram for listing various causes for the problem as well as determining the most important one. 6 7 8 9 10 11 12 13 14 15 16 17 18 19 20 21 22 23 24 25 57.2 57.4 57.3 57.2 57.7 57.5 57.6 57.7 57.6 57.7 57.2 57.4 57.3 57.4 57.3 57.7 57.6 57.7 58.6 57.3 31 32 33 34 35 36 37 38 39 40 41 42 43 44 45 46 47 48 49 50 57.4 57.44 57.62 57.62 57.34 57.78 57.62 57.7 57.6 57.36 57.78 57.62 57.7 57.4 57.36 57.5 57.36 57.2 57.45 57.33 ows that there variation in the data and the process is slightly shifted towards the USL of the dimension and is producing parts with dimension ranging in positive tolerance zone. This can also be seen in the capability six pack study using Minitab. t paves us the way to further synthesize the process and find out the causes due to which there is presence of variation in the data. For this purpose we did a root cause analysis and plotted a cause and effect diagram for listing various causes for the oblem as well as determining the most important Capability analysis of the dimension using the available data in MINITAB. Capability analysis of the dimension using the Process Capability Sixpack of C1, ..., C C2 Xbar Chart Capability y Histogram 1 LSL USL UCL=58.049 58.0 Specifications Sample Mean LSL USL 57.8 56.2 __ X=57.54 57.5 LCL=57.031 57.0 1 3 5 7 9 11 13 15 17 19 21 23 25 56.4 56.8 57.2 57.6 58.0 58.4 R Chart N A Normal Prob Plot D: 2.009, P: 0.076 1 1 1.0 Sample Range UCL=0.885 0.5 _ R=0.271 0.0 LCL=0 1 3 5 7 9 11 13 15 17 19 21 23 25 57.0 57.5 58.0 58.5 Last 25 Subgroups C Capability Plot Within Within Overall 58.5 StDev Cp Cpk PPM 0.24 1.11 0.36 139330.26 StDev Pp Ppk Cpm PPM 0.2808 0.95 0.31 * 177220.31 Values 58.0 Overall 57.5 Specs 5 10 15 20 25 Sample Fig.2. Capability analysis sixpack with results for existing data using MINITAB. existing data using MINITAB. . Capability analysis sixpack with results for Fig 3: Cause and effect diagram for finding root cause Thus, after acknowledging the problem in the process of manufacturing the part, the next step was to find out the solution to resolve the pro problem identification and vigorous synthesis of the problem with the industry counterparts, it was understood that the placement of child parts in welding fixture was having some problem causing some more gap between the child part and sup welding fixture. As the main problem was arising out of the fixture, scope of improvement was also focused on same area. scope of improvement was also focused on same area. : Cause and effect diagram for finding root cause Calculations: Thus, after acknowledging the problem in the process of manufacturing the part, the next step was to find out the solution to resolve the problem. After the problem identification and vigorous synthesis of the problem with the industry counterparts, it was understood that the placement of child parts in welding fixture was having some problem causing some more gap between the child part and support in − σ − 57 8 . 56 2 . Usl lsl = = = . 1 1 . 1 Cp 6 Usl * . * 6 24 − − σ 57 8 . 57 5 . X = = = 0 . 0 38 Cpu 3 * . * 3 − 24 − 57 5 . 56 2 . X Lsl σ = = = 1 6 . 1 Cpl 3 * . * 3 24 = = min( , ) . 0 38 Cpk Cpu Cpl Fig 2. Shows that current process is underperforming as the current Cp & Cpk values are well below 1.33 that we need. It also shows various control charts like that we need. It also shows various control charts like Fig 2. Shows that current process is underperforming as the current Cp & Cpk values are well below 1.33 As the main problem was arising out of the fixture, @ IJTSRD | Available Online @ www @ IJTSRD | Available Online @ www. ijtsrd. com | Volume – 2 | Issue – 5 | Jul-Aug 2018 Aug 2018 Page: 1889
International Journal of Trend in Scientific Research and Development (IJTSRD) ISSN: 2456-6470 While inspecting the part, as the dimensions were greater on one end than the other end for bracket, we can signify that there is more space available for the part to be pushed on one side than the other in the welding fixture, due to which the part is not kept in a straight way and has tilted to one side causing difference in dimension on each side. In order to understand the problem, we made one part without using fixture and by arranging all the parameters manually to as close as possible to the required dimension. After the part was produced, we placed the part in the same existing welding fixture. After placing the master Part in the existing welding fixture, we noticed that there is a gap at one side between the fixture support and the face of child part that should rest on the welding fixture support. This was the main cause, and due to this extra gap the child parts when clamped, used to get pushed on one side more than on other thus causing the error. The existing welding fixture is shown in fig 4. below. Thus improvements were to be made in this welding fixture in order to achieve a high process capability with very less variability from mean position. We discussed this suggestion counterparts and after the permission, and the suggested changes, the welding fixture was improved further as shown in fig 5. This time there was a great improvement in the results from existing, as the process capability was also improved with no rejections. The process capability of the current process after improvement was Cp=1.91 & Cpk =1.51 also Pp=1.81& Ppk = 1.50 The 50 readings are shown below in Table 5. Table 5: Readings for part made using improved welding fixture Part Number in mm Number 1 57.78 2 57.62 3 57.7 4 58.6 5 57.36 6 57.2 7 57.45 8 57.33 9 57.2 10 57.7 11 57.5 12 57.6 13 57.78 14 57.62 15 57.7 16 57.2 17 57.45 18 57.33 19 57.4 20 57.35 21 57.78 22 57.62 23 57.7 24 58.6 25 57.36 Dimension Part Dimension in mm 57.6 57.3 57.19 57.5 57.45 57.4 57.44 57.62 57.62 57.34 57.78 57.62 57.7 57.6 57.36 57.78 57.62 57.7 57.4 57.36 57.5 57.36 57.2 57.45 57.33 26 27 28 29 30 31 32 33 34 35 36 37 38 39 40 41 42 43 44 45 46 47 48 49 50 with our industry Fig 4:Part fixed in the welding fixture before improvement SPC analysis after improvement To check whether the change was successful, we took 50 more readings of the same part using the new improved welding fixture to know whether the improvements which we did were helpful in improving the process performance or not and therefore we did the SPC study again involving improved welding fixture. 4.1 Fig 5:Change in the existing fixture to get improved fixture @ IJTSRD | Available Online @ www. ijtsrd. com | Volume – 2 | Issue – 5 | Jul-Aug 2018 Page: 1890
International Journal of Trend in Scientific Research and Development (IJTSRD) ISSN: 2456-6470 After taking the readings of part made using improved welding fixture, the next step was to perform the analysis for the collected data. By using Process Capability sixpack feature of MINITAB, we did the capability analysis as well as performed an SPC analysis. the Results for the analysis are shown below in the figure.6. Shown below is the graph from Minitab showing all the Capability Sixpack Values and charts. dimension the 57mm dimension was the major cause for rejection of part and therefore we chose this dimension for our further analysis. We came to a conclusion that this problem was due to problem in the welding fixture used to manufacture the part. After implementing improvements and incorporating the changes in the welding fixture we did the SPC study again by again taking 50 readings for the part produced using improved fixture. By plotting the control charts and performing the process capability analysis, we found out that the process capability indices improved considerably. The process showed high stability and most of the data falling closer to mean resulting in a high process Capability (Cp=1.90 Cpk=1.51 & Pp=Ppk=1.67) where Cp & Cpk are process capability indices and Pp & Ppk are process performance indices. This paper has presented the case study on the applicability of the process capability analysis in a small scale industry manufacturing auto components. Briefly, the development of this work led to a deepening of knowledge around the management method or set of tools for managing processes-the statistical process control (spc) with respect to its scope, its embracement and its implementation in the reality. The main objective of this paperis to present the application of a systematic approach to the used of statistical process control across the several stages of production of specific “x” piece in plant with the purpose of improving the quality in its manufacturing processes. Using means of control charts this approach, allows the identification of problems into the company’ production process. by applying this model, it was possible to put into practice what has been presented and studied in theory ,increase knowledge and learning through the difficulties and challenges encountered in each step of application of the statistical process control. Thus, it is possible to show that depending on each case the researcher should develop alternatives to make spcapllicable to different kind of companies since they could have different processes, routines and particularities, requiring specific adaptations. the discussed Process Capability Sixpack of C1, ..., C2 Xbar Chart Capability Histogram LSL USL UCL=57.4670 57.4 Specifications Sample Mean LSL USL 57.8 56.2 __ X=57.17 57.2 57.0 LCL=56.8730 1 3 5 7 9 11 13 15 17 19 21 23 25 56.40 56.64 56.88 57.12 57.36 57.60 R Chart Normal Prob Plot AD: 0.605, P: > 0.250 1 UCL=0.5160 0.50 Sample Range 0.25 _ R=0.1579 0.00 LCL=0 1 3 5 7 9 11 13 15 17 19 21 23 25 57.0 57.3 57.6 Last 25 Subgroups Capability Plot Within Within Overall 57.4 StDev Cp Cpk PPM 0.14 1.90 1.50 3.40 StDev Pp Ppk Cpm PPM 0.1476 1.81 1.42 * 9.83 Values 57.2 Overall 57.0 Specs 5 10 15 20 25 Sample Fig.6: Capability analysis sixpack with results for improved data using MINITAB. 5. The main goals of SPC is an identification of abnormal variability caused by assignable causes with the aim to Making the process stable, Minimize the process variability and performance. The case study throws a light on the applicability of the process capability analysis and other SPC tools in improving the performance of existing process by finding causes of variation and eliminating thereby providing a more capable process with reduced variation and rejections. In our study we considered a single part having a critical dimension of 5mm for doing SPC study. In our initial study we collected 50 readings for the part and then performed SPC study. In the study we found out that the Process capability ratios (Cp, Cpk, Pp, Ppk) were quite low than the required level. Thus giving us a instance that there is some problem in the ongoing process and due to which the capability indices were low. Thus the next step was to find out the causes due to which the process capability was low. For this, initially we procured the past data for the part and plotted the rejection data in a table to find the critical dimension due to which the part was being rejected. From this chart we found out that from all the DISCUSSION ON RESULTS : Improve the process @ IJTSRD | Available Online @ www. ijtsrd. com | Volume – 2 | Issue – 5 | Jul-Aug 2018 Page: 1891
International Journal of Trend in Scientific International Journal of Trend in Scientific Research and Development (IJTSRD) ISSN: 2456 Research and Development (IJTSRD) ISSN: 2456-6470 6.Phyanthamilkumaran, S. Z. and Fernando, Y. (2008), “The role of cultural change in the relationship between critical factors with the success of Statistical Process control (SPC) projects”, Proceedings Conference on Money, Management, Vol.3 No.4,pp. 1 7.Prabhuswamy, M. (2010), “Process variability reduction through statistical process control for quality improvement”, International Journal for Quality research, Vol.4, No. 3, pp.35 8.Mostafaeipour A., Sedaghat A., Hazrati A and Vahdatzad M. (2012), “The use of Statistical Process Control Technique in the Ceramic Ti Manufacturing: a Case Study” Journal of Applied Information Systems (IJAIS) ISSN : 2249-0868 Volume 2, No.5,pp.14 9.Prajapati, D. R. (2012) “Implementation of SPC Techniques in Automotive Industry: A Case Study” International Technology and Advanced Engine No. 3, pp. 227241. 10.Raghuraman S., Thiruppathi K Indhirajith B. (2012),“Enhancement of Quality of The Processes Using Statistical Tools International Journal Of Engineering Science & Advanced Technology, Volume-2, Issue-4,pp. 1008 11.Kumar, A. (2013), “Statistical Process Control: Strategy To Monitor And Control Manufacturing 12.Process” International Journal of Business and Management a Research, Vol. III Issue XI, pp. 459-464. After a application of SPC there was a appreciable improvement in the process capability results (CP=1.90 Cpk =1.51). After the rectification and effort taken there was a significant increase in the process capability supreme to improved value of Cp and Cpk. On the whole, the conduct of this case study release that, process improvement could be achieved economically by employing SPC using its entire tools and analyzing all the involved parameters. REFERENCES: 1.Grant, E. L. and Leavenworth, R. Statistical Quality Control, McGraw hill, 7th Edition, New York. 2.Schippers and Werner, A. (1998), of statistical process International journal of production Economics, Vol. 56-57, pp. 525-535. 3.Wright, P. (2000), “The cumulative distribution function of process capability indices, and probability letters, Vol.47, No.3, 4.Smiley W. (2006), “Assessing Process Capability: A Case Study”, Quality Quantitative Management Vol. 3, No. 2, pp.191 206. 5.Chen, S.H., Yang C., Lin W and Yeh T.(2007) ,“Performance evaluation statistical process Control to the liquid crystal display industry” International Journal of Production Economics, Volume 111,pp. 80 application of SPC there was a appreciable improvement in the process capability results Phyanthamilkumaran, S. Z. and Fernando, Y. (2008), “The role of cultural change in the relationship between critical factors with the success of Statistical Process control (SPC) projects”, Proceedings Conference on Money, Management, Vol.3 No.4,pp. 1-11. After the rectification and effort taken there was a significant increase in the process capability supreme to improved value of Cp and Cpk. On the whole, the conduct of this case study release that, process improvement could be achieved economically by mploying SPC using its entire tools and analyzing all of of Annual Annual Economy Economy London London and and (2010), “Process variability reduction through statistical process control for improvement”, International Journal for Quality research, Vol.4, No. 3, pp.35-43. Mostafaeipour A., Sedaghat A., Hazrati A and (2012), “The use of Statistical Process Control Technique in the Ceramic Tile Manufacturing: a Case Study”, International Journal of Applied Information Systems (IJAIS) – 0868 Volume 2, No.5,pp.14-19. L. and Leavenworth, R. S. (1996) Statistical Quality Control, McGraw hill, 7th “Applicability statistical process control control techniques”, techniques”, (2012) “Implementation of SPC International journal of production Economics, Techniques in Automotive Industry: A Case Study” International Technology and Advanced Engineering, Vol. 2, Journal Journal of of Emerging Emerging “The cumulative distribution indices, Statistics No.3, pp.249-251. Thiruppathi K., Kumar J., and Smiley W. (2006), “Assessing Process Capability: Quality Quantitative Management Vol. 3, No. 2, pp.191- Indhirajith B. (2012),“Enhancement of Quality of The Processes Using Statistical Tools- A Review” International Journal Of Engineering Science & Advanced Technology, 4,pp. 1008 – 1017. Technology Technology & & ISSN: ISSN: 2250 2250–3676, Chen, S.H., Yang C., Lin W and Yeh T.(2007) ,“Performance evaluation for for introducing introducing (2013), “Statistical Process Control: Strategy To Monitor And Control Manufacturing to the liquid crystal display industry” International Journal of Volume 111,pp. 80–92. Process” International Journal of Business and Management a Research, Vol. III Issue XI, pp. @ IJTSRD | Available Online @ www Available Online @ www. ijtsrd. com | Volume – 2 | Issue – 5 | Jul-Aug 2018 Aug 2018 Page: 1892