Download
1 / 21
210 likes | 217 Views
In most of the construction projects it has been notice that certain causes may lead to delay in construction activities. This will make time schedule and cost budget overrun in the project. Thus, it has become a major and challenging problem to complete the project on schedule and within the estimated cost. To solve this problem, the concept of construction project management by Earned Value Management System EVMS is evaluated. Earned Value Management EVM is a technique that finds the stage at which cost and time overrun EVM technique acts as an early warning and alarming system for budget and schedule. It not only measures the project performance but also measure the progress of the schedule. In our study we have done Earn Value analysis of a construction project which was completed in the year of 2017, based on project data BOQ, Actual Budget, and Schedule and inputs which have been collected we are able to perform EVA by using Microsoft Project. The analysis helps in finding out the deviations both in cost as well as in time i.e. schedule variance and cost variance. It is an effective tool to measure cost, schedule and performance of the project. The EVA is useful in various fields such as IT, Industries and Construction companies etc. This paper summarizes the evolution, basic terminologies of Earned Value Analysis and effective use of it in the construction industries by Microsoft Project. Khalid Mohiuddin Khan | Mr. Masoom Reza "Earned Value Management for Design and Construction Project" Published in International Journal of Trend in Scientific Research and Development (ijtsrd), ISSN: 2456-6470, Volume-2 | Issue-5 , August 2018, URL: https://www.ijtsrd.com/papers/ijtsrd17029.pdf Paper URL: http://www.ijtsrd.com/management/other/17029/earned-value-management-for-design-and-construction-project/khalid-mohiuddin-khan<br>

E N D
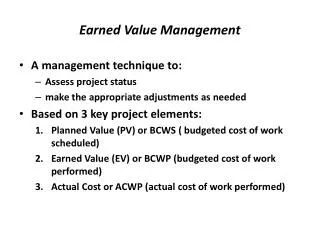
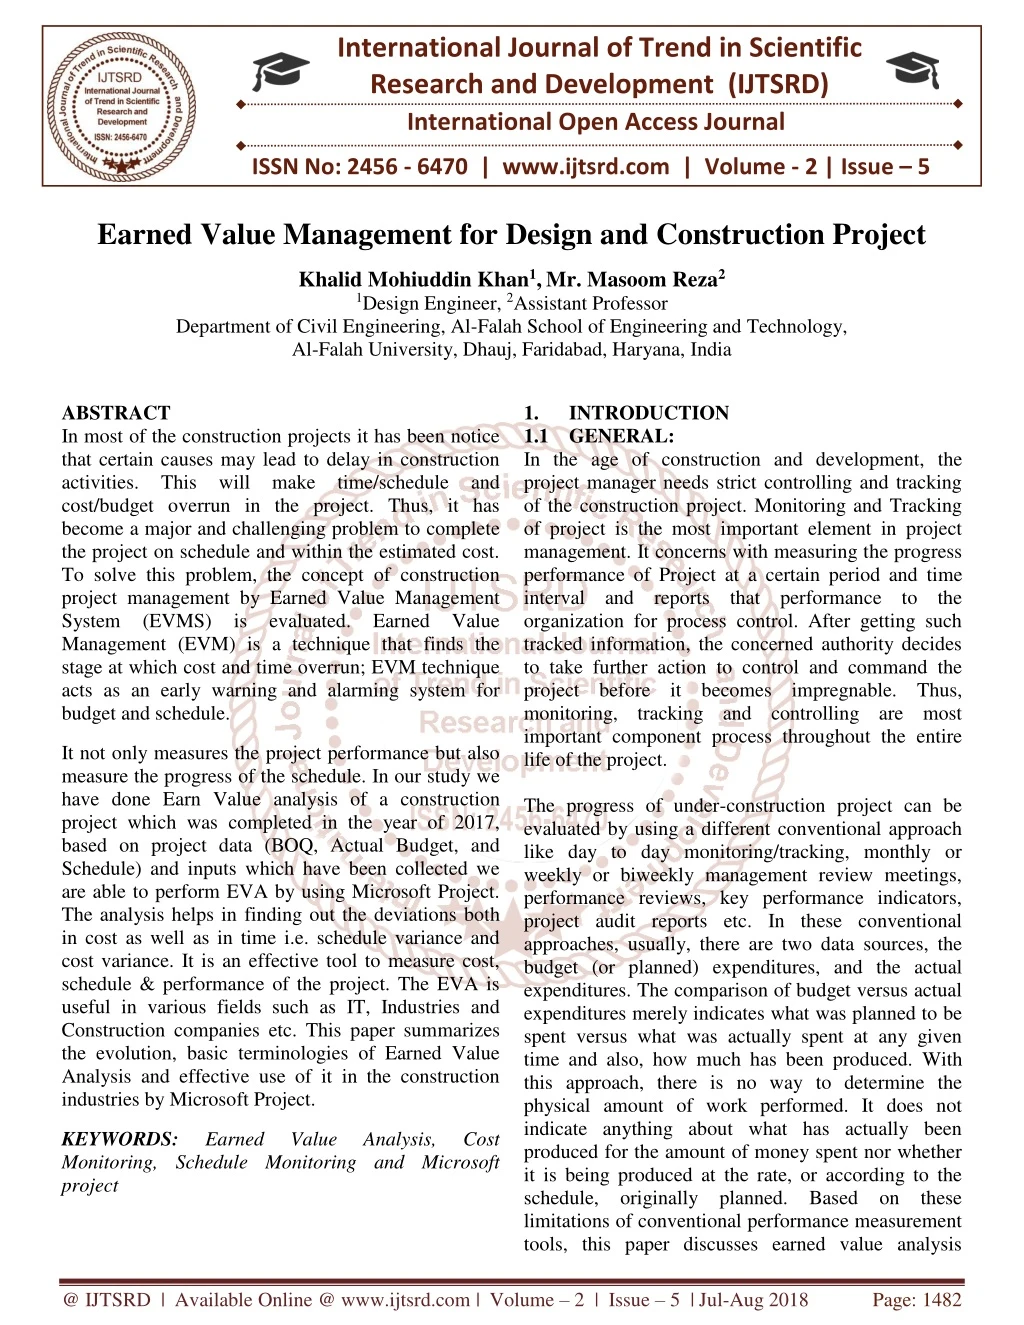
International Journal of Trend in Scientific Research and Development (IJTSRD) International Open Access Journal ISSN No: 2456 - 6470 | www.ijtsrd.com | Volume - 2 | Issue – 5 Earned Value Management for Design and Construction Project Khalid Mohiuddin Khan1,Mr. Masoom Reza2 1Design Engineer, 2Assistant Professor Department of Civil Engineering, Al-Falah School of Engineering and Technology, Al-Falah University, Dhauj, Faridabad, Haryana, India ABSTRACT In most of the construction projects it has been notice that certain causes may lead to delay in construction activities. This will make time/schedule and cost/budget overrun in the project. Thus, it has become a major and challenging problem to complete the project on schedule and within the estimated cost. To solve this problem, the concept of construction project management by Earned Value Management System (EVMS) is evaluated. Earned Value Management (EVM) is a technique that finds the stage at which cost and time overrun; EVM technique acts as an early warning and alarming system for budget and schedule. 1. 1.1GENERAL: In the age of construction and development, the project manager needs strict controlling and tracking of the construction project. Monitoring and Tracking of project is the most important element in project management. It concerns with measuring the progress performance of Project at a certain period and time interval and reports that performance to the organization for process control. After getting such tracked information, the concerned authority decides to take further action to control and command the project before it becomes impregnable. Thus, monitoring, tracking and controlling are most important component process throughout the entire life of the project. The progress of under-construction project can be evaluated by using a different conventional approach like day to day monitoring/tracking, monthly or weekly or biweekly management review meetings, performance reviews, key performance indicators, project audit reports etc. In these conventional approaches, usually, there are two data sources, the budget (or planned) expenditures, and the actual expenditures. The comparison of budget versus actual expenditures merely indicates what was planned to be spent versus what was actually spent at any given time and also, how much has been produced. With this approach, there is no way to determine the physical amount of work performed. It does not indicate anything about what has actually been produced for the amount of money spent nor whether it is being produced at the rate, or according to the schedule, originally planned. Based on these limitations of conventional performance measurement tools, this paper discusses earned value analysis INTRODUCTION It not only measures the project performance but also measure the progress of the schedule. In our study we have done Earn Value analysis of a construction project which was completed in the year of 2017, based on project data (BOQ, Actual Budget, and Schedule) and inputs which have been collected we are able to perform EVA by using Microsoft Project. The analysis helps in finding out the deviations both in cost as well as in time i.e. schedule variance and cost variance. It is an effective tool to measure cost, schedule & performance of the project. The EVA is useful in various fields such as IT, Industries and Construction companies etc. This paper summarizes the evolution, basic terminologies of Earned Value Analysis and effective use of it in the construction industries by Microsoft Project. KEYWORDS: Monitoring, Schedule Monitoring and Microsoft project Earned Value Analysis, Cost @ IJTSRD | Available Online @ www.ijtsrd.com | Volume – 2 | Issue – 5 | Jul-Aug 2018 Page: 1482
International Journal of Trend in Scientific Research and Development (IJTSRD) ISSN: 2456-6470 (EVA) technique as an effective tool for tracking and controlling of construction projects. It is a project control method which integrates the cost, schedule and technical performance. Many public-sector contractors are working on project-oriented principle or project to project basis. Problems in completing project are often related to on time and on budget completion and for public sector contractors, there is more publicity when something goes wrong and unplanned. Hence, public sector agencies are demanding on EVMs. EVM is a approach to help project manager and projects come to successful completion whether projects are from construction industries, information development or Hospitality Industry. EVM is treated as one of the most useful, powerful and productive concepts used for managing today’s complex projects in private, commercial or public-sector environments. It has the ability to combine measurements of scope, schedule, and costs. It is a single integrated multifunctional system. Using EVM the project controller can assess how ahead or behind schedule the project and if the project is over budget or under budget. 1.2OBJECTIVE: The Earned Value method or technique has been developed as a tool or technique to track and control the project. It is helpful and useful for getting a project’s status at any stage (Whether it is lag behind or away of schedule? Whether is it out-off or under budget or estimate?) and the scale of current variances from the plan. Moreover, it helps a project manager to make decisions and make comparisons on the final effect of the project in the manner of cost and, to some extent, in the manner of time and duration, by comparing present trends. This technique is very simple and unique: it presumes a simplified model of a project or work, and the estimation require nothing but few and four basic arithmetic operations and elements like addition, subtraction, multiplication and division. Because of its ease of working and simple arithmetic calculations, with progressive and real time results this technique has been accredited as a very effective and useful tool by many project managers, companies and public- sector agencies and has become a bench mark and standard in project management and operations. This technique is very versatile enough, it can be work and applied on any type of project of any sector it can work from defence sector and helps in making their strategies to small as well as big IT projects. The analysis in this method can be initiated on any level hierarchy of work and work breakdown structure and can be used by clients, researchers, scholars and contractors. The method, work very accurately and efficiently, but requires a consistent approach for collection of data and algorithms on project cost and progress (on weekly and biweekly basis) and the findings are to be processed immediately. 1.The main objective of using EVA technique is to find out and detect any mismatch during any stage of construction as soon as possible, so that there is plenty of time in hand of project managers to asses if the mismatch is dangerous for the project and, if necessary, precautions and corrective actions can be taken. 2.To find out the reason behind the delay of project, with respect to project budget and project schedule. 3.Analyse the actual profit and loss of the project. 2. LITERATURE REVIEW 2.1GENERAL: Literature Review pertaining to similar studies conducted all over the world is collected from various sources to determine the feasibility and scope of the work. Similar studies undertaken are as follows: ➢T. Subramani, D. S. Stephan Jabasingh, J. Jayalakshmi (2014): parameters involved in the calculation and analysis of Earn value analysis and cost controlling in construction project by using software like Primavera and MS projects. [1] ➢Ray W. Stratton, EVP (2007): Discuss about the earn schedule, earn schedule analysis for estimating the completion date of the construction project and also compare the conventional method of scheduling and budgeting. [2] ➢Dr. Arun Dhawale1 Vaishnavi Tuljapurkar (2015): In this paper discussion is done on Cost control and tracking of a building construction project by earned value method. The Earn Value Analysis is dependent on two key areas i.e. precise cost information and pragmatic progress of project. If two key areas are efficient for a project to get benefitted. [3] ➢Andrew Fernans Tom1, Sachin Paul (2013): The present study deals with the project monitoring process of “Standard Design Factory”. technology, software Discuss the main @ IJTSRD | Available Online @ www.ijtsrd.com | Volume – 2 | Issue – 5 | Jul-Aug 2018 Page: 1483
International Journal of Trend in Scientific Research and Development (IJTSRD) ISSN: 2456-6470 A comparison between the planned progress of construction work and actual progress is performed in this study using project management software Primavera P6 to make the calculations easy. [4] ➢ANUJ DUBEY (2015): In this paper the discussion is on Cost over-runs and time over-runs are prevalent in most of the projects carried out in developing nations such as India. There may be multiple reasons for these overruns. In order to reduce them, there should be efficient use of the construction software’s available in the market. This paper emphasises the use of these software’s to reduce these issues by the use of a scientific technique called earned value analysis. [5] ➢Ms. Radhika R. Gupta, Prof. Parag S. Mahatme, Prof. Taran C. Bhagat (2015): This paper discusses the cost monitoring of construction project through earned value management system their benefits and future scope. On comparing Earned Value Management method to traditional management, traditional management does not allow for analysis of physical amount of work performed. Earn value management allows both schedule cost analysis against physical work performed. [6] ➢Shu CHEN and Xueqing ZHANG (2012): The review undertaken in this paper covers popular research directions in the EVM area. The paper introduces a description of the background of EVM, including its terminologies, performance analysis and forecasting measures, and advantages as well as disadvantages of EVM. The classification system made for organizing the retrieved studies is developed. In empirical studies, case studies were used to highlight the driving and impeding factors for effective implementation of EVM while a large number of project data analysed to portray the behaviours of CPI and investigate the accuracy of cost forecasting techniques. In non-empirical studies, models and simulation methods have been used to improve the capability of EVM. [7] ➢Rajesh Ganpat Virle and Sumedh Y Mhaske (2013): Earned Value Management is a powerful methodology that helps manager, program manager and other stakeholders of the project to manage the project more effectively. Earned Schedule is an important extension to EVM that allows EVM metrics to be transformed to time or duration metrics to enhance the evaluation of project schedule performance, forecast the duration needed to complete the project. [8] ➢Sandhya Suresh, Ganapathy Ramasamy N (2015): This paper discusses the Analysis of Project Performance Using Earned Value Analysis EVM provides more perception about the costs and other elements of scope, risks, performance etc. It inspires the management team to pay more attention to cost, schedule and progress with more intensity and optimizes the project. [9] ➢Lipke Walt et al (2007): In project management Institute (USA), Earned Value and Earned Schedule was applied and study was carried on by Lipke Walt. It has been concluded that EVM with ES provides incredible management information which helps in project management. ➢Knedrik et al (2004): Said EVM is complex but it has a simple foundation. It helps in tracking the performance of a project by simple arithmetical calculation, for projects of larger volume software like MS project can be used 2.2HISTORY: Every project manager focuses on the point that the project should be within the budget and within the cost and how could this be done. It may happen that project may be out-off time or out-off budget, to calculate this time versus budget consequences expert mathematical tools are required. So, to overcome this problem Earn Value Management is the technique to be applied in the construction, IT, defence and hospitality sectors etc. In 1960s, but it has become an important branch of project management and value engineering. Project investigating the contribution of EVM to project success suggests a moderately strong positive relationship. Implementations of EVM can be scaled to fit projects of all sizes and complexities. Every project manager and project controller efforts that the project should be within the budget, within the cost, within planned schedule and how this could be achieved. Possibilities may happen that project may be over schedule or over budget, to calculate this effective mathematic tool and complex algorithms are required. So, to handle this problem EVA is the technique to be applied in the construction projects and other projects too. EVM emerged as a financial analysis tools specialty in United States Government programs in the 1960s, but it has since become a significant and an effective branch of project management, project controlling and management research executive, project controlling, and cost @ IJTSRD | Available Online @ www.ijtsrd.com | Volume – 2 | Issue – 5 | Jul-Aug 2018 Page: 1484
International Journal of Trend in Scientific Research and Development (IJTSRD) ISSN: 2456-6470 engineering. investigating the contribution of EVM to project success suggests a moderately strong positive proportion. EVM technique can be implemented to projects of all ranges, sizes and intricacies. The origin of EVM occurred in industrial development at the end of the 20th century, this method is based significantly on the principle of "earned time" the concept took root in the United States Department of Defence in the 1960s. This came from the original concept called PERT/COST, but it was considered overly cumbersome (not very adaptable) by project managers who were mandated to use it, and many variations of it began to proliferate among various procurement programs. In the late 1980s and early 1990s, EVM comes as a project management technique to be understood and used by managers and executives, not just by EVM specialists. In 1989, EVM leadership was elevated to the Undersecretary of Defence for Acquisition, thus making EVM an essential element of program management and procurement. The construction industry was an early and quick commercial adopter of EVM. The EVM used very commonly and accelerated in the 1990s. In 1999, the Performance Management Association merged with the Project Management Institute (PMI) to become PMI’s first college, the College of Performance Management. The United States Office of Management and Budget began to mandate and recommend the use of EVM across all public-sector agencies, and, for the first time, for certain internally managed projects (not only contractors and govt agencies). 2.3DESCRIPTION: Earned Value analysis is a method of performance measurement. Earned Value management technique that uses “work in progress” to indicate what will happen to work in the future. Earned value management is an “early warning system” for planning and controlling the project cost performances. EVM establish work packages earned value baseline by integrating project scope, time schedule and cost objectives. This baseline is called as cost control and is used for performance evaluation of a project on a given date. Earned Value analysis is a method and technique of performance evaluation and measurement. Earned Value is a program management-based technique that uses “work in progress” and used to indicate what will Project management research happen to work in the future (can be calculated on basis interpolation). Earned value management is an “early warning and alarming system” for planning, controlling and monitoring performances and benefits. EVM establish work packages earned value baseline by integrating project scope, time schedule and cost objectives. This baseline is called as cost control and is used for performance evaluation of a project on a given date. Analysis of deviation and trends from the baseline provides the cost related information’s for problem determination, current and past trend analysis and corrective actions such as re-planning, re-allocating and revising the cost and budget and re-scheduling. Earned value analysis serves two main purposes. ➢It analyses and determines cost changes which are resulting in duration and budget over-run or under-run so that timely precautionary actions are taken such as revision and modification of cash flow, reevaluating financial projections, trends and forecast and project success and profitability projections. ➢Analysis of deviation from the baseline data using earned value technique and systems gives a variety of variances and deviations which are used to provide and determine the current status of the project, to initiate corrective actions and to forecast future success trends. 2.4 BASIC TERMINOLOGY: The basic terms associated with Earned Value Management: ➢Budgeted Cost for Work Scheduled (BCWS) / Planned Value (PV): It is the amount of money budgeted to be spent at a particular point in time. ➢Budgeted Cost for Work Performed (BCWP) / Earned Value (EV): It is the amount of work in terms of cost that is actually accomplished at a particular point of time with respect to the planned value. ➢Actual Cost of Work Performed (ACWP) / Actual Cost (AC): It is the actual amount of money spent for the corresponding planned and earned value. ➢Cost Variance (CV): It helps to measure project performance. Cost variance (CV) indicates how much over or under budget the project is. A positive value indicates a favourable condition and a negative value indicates an unfavourable condition It is the difference between Earned Value and Actual Cost. the project cost is a program @ IJTSRD | Available Online @ www.ijtsrd.com | Volume – 2 | Issue – 5 | Jul-Aug 2018 Page: 1485
International Journal of Trend in Scientific Research and Development (IJTSRD) ISSN: 2456-6470 CV = EV – AC EACt = (BAC / SPI) / (BAC / months) 2.5 S-CURVE: “S Curves” are great mathematical tool to track project progress in terms of time and cost and it is also known as a time-cost curve. It is a graphical representation of financial forecast, cash flow of a project. It is derived from activity usage profile, and it shows an S-like shape, flatter at the beginning and end and steeper in the middle. This shows that costs involved in the project are low in the beginning as well as in the end, whereas it increases at a rapid rate when the project is in its middle stage. EVM is graphically represented as below ➢Schedule Variance (SV): It indicates how much ahead or behind schedule the project is. A positive value indicates a favorable condition and a negative value indicates condition. It is the difference between Earned Value and Planned Value. SV = EV – PV ➢Cost Performance Index (CPI): It is a measure of cost efficiency on a project. A value equal to or greater than one indicates a favorable condition and a value less than one indicate an unfavourable condition. It is the ratio between Earned Value and Actual cost. CPI = EV / AC If CPI < 1: The project is running over budget, If CPI >1: The project is running under budget, If CPI=1: the project is running on a budget. ➢Schedule Performance Index (SPI): It is a measure of schedule efficiency on a project. An SPI equal to or greater than one indicates a favourable condition and a value of less than one indicates an unfavourable condition. It is the ratio between Earned Value and Planned Value. SPI = EV / PV If SPI < 1: The project is running behind planned schedule, If SPI >1: The project is running ahead of planned schedule, If SPI=1: the project is running on planned schedule. ➢Critical Ratio (CR): It is the product of Cost Performance Index and Schedule Performance Index. It indicates the overall performance of the Project with respect to both cost and time. CR= CPI * SPI ➢Estimation at Completion (BAC): It’s a prediction of the total project cost based upon the current trends in project performance. It is the ratio of the Budget at completion and cost performance index. EAC= BAC / CPI ➢Variance at Completion (VAC): It is the difference between the planned budgets at the beginning of the project to the Estimate at Completion. This value denotes how much more profit or loss the contractor will make on that Project. VAC= BAC-EAC ➢Time Estimate at Completion (EACt): It predicts the completion time of a Project based on its current performance. an unfavourable Figure 1 S-CURVE EVM 2.5 ADVANTAGES OF EVMS: 1.EVA can be done weekly, bi-weekly and periodically; management tries to make sure that all the project parameters are on track. 2.It is used to measure and predict progress of ongoing project. 3.It is the only method which tracks the project and work in terms of progress, duration/time and cost/money. 4.It helps the project manager to make the project to be on time and on a budget. 5.The cost performance index (CPI) and schedule performance index (SPI) provides an early warning signal. 6.It can be applied to any construction project and other project at any time and it gives impressive results in large construction project. 7.Time to time performance measurement makes sure that steps can be taken to the bring project back on track as per planned schedule. @ IJTSRD | Available Online @ www.ijtsrd.com | Volume – 2 | Issue – 5 | Jul-Aug 2018 Page: 1486
International Journal of Trend in Scientific Research and Development (IJTSRD) ISSN: 2456-6470 2.6 DISADVANTAGE / DRAWBACKS OF EVMS: 1.In Earn Value management system and analysis quality doesn’t take in to consideration. 2.To solve and make relationship between cost, duration and budget complex calculations are to be solve which can be done by software. 3.EVA is required to be carried out at different stages as the uncertainty may occur anytime throughout the project. 3. METHODOLOGY 3.1 GENERAL The construction and operations projects have become so large and complex, it become very difficult to find out the actual progress of project at any time by using conventional methods and calculations. To solve this many IT companies have started developing software for project management which helps in doing complex calculation in very simple manner, project management and planning software such as Primavera P6, Microsoft Project, etc. are very popular. 3.2 METHODOLOGY FOR EARN VALUE ANALYSIS Our study and analysis involve Earned value analysis of the building project using Microsoft Project. The progress at the site must be incorporated in the Microsoft Project schedule and updated. These updates need to be thoroughly monitored using Microsoft Project. The work breakdown structure (WBS) for the project is created and several activities are identified. The following recommended steps for the successful implementation of earned value analysis: TABLE 3.1 STEPS IN EARN VALUE ANALYSIS S. No 1 Create Project 2 Define WBS 3 Creating Calendars 4 Define Activities 5 Appoint Activity Durations 6 Assign Logic Links 7 Perform Scheduling 8 Allocating Resources/budgeting 9 Creating Baselines 10 Updating Schedule 11 Earned value analysis Steps involved in monitoring and controlling of the project in Microsoft Project are: 1.Creating new projects: The project is created under the respective divisions in Enterprise Project Structure (EPS) and assigned the person in charge from Organisation Breakdown Structure (OBS) to it. The project can be given planned start and must finish dates. The project is assigned a calendar which can be global, resource or project calendar. 2.Define Work breakdown structure (WBS): WBS is a hierarchy of project that must be accomplished to complete a project. Each WBS element may contain more detailed WBS levels, activities, or both. 3.Creating Calendars: Calendars are the most important source for defining the baseline and for tracking to project i.e. the project is behind the schedule or not. It can be created as a global, resource or project calendar. 4.Defining activities: Activities are the fundamental work elements of a project and form the lowest level of a WBS and are the smallest subdivision of a project. An activity has the following characteristics like activity ID, name, start and finish dates, activity calendar, activity type, activity codes, constraints, expenses, predecessor and successor relationships, resources and roles etc. 5.Defining activity duration: When planning the work, the duration is entered in the original duration field. The actual duration can only be entered for the activities, which are completed. 6.The relationship between activities: To form a network, the activities should be connected to each other, which is done by assigning preceding and succeeding activities relationship to the activities. A.Finish to Start (FS) relationship. B.Finish to Finish (FF) relationship. C.Start to Start (SS) relationship. D.Start to Finish (SF) relationship. 7.Perform scheduling: Scheduling is to perform that all the activities must be schedule as according to the relationship between the various activities. It is simply performed by pressing the F9 button. 8.Allocating resources and budget: Resources are allocated in the resource sheet as a labourer, material, and non-labour resources and the price is allocated to the various resources as per unit. Labour and non-labour resources are always time- with a significant Steps @ IJTSRD | Available Online @ www.ijtsrd.com | Volume – 2 | Issue – 5 | Jul-Aug 2018 Page: 1487
International Journal of Trend in Scientific Research and Development (IJTSRD) ISSN: 2456-6470 based, and material resources such as consumable items, use a unit of measure which can be specified. Resources are different than expenses. While resources can be time-based and generally extend across multiple activities or projects, expenses are one-time expenditures for non-reusable items required by activities. After defining resources, they are to be allocated to their respective activities. While Budget is to be allocated from the expense tab to various activities. 9.Creating baselines: A simple baseline plan is a complete copy of the original schedule which provides a target against which a project’s performance is tracked. 10.Updating schedule: A.If the project is progressing exactly as planned, then only needed to estimate progress. B.If the project is not progressing as planned many activities are starting out-of-sequence, actual resource use is exceeding planned use, and then update should be done for activities and resources individually. C.Most projects contain some activities that progress as planned and some which do not. In this case, the best method is to combine the two updating methods. 11.Preliminary steps to be done in updating: Choose project, maintain baseline. Then add and save a copy of current project as a new baseline B1. Then choose project baseline as B1 and assign primary baseline as B1. 12.Daily updates to be made: A.Start date and end date Choose the activity to be updated. Then in the activity details window, select the status tab. Then tick mark started if the activity has been started and select the date. Tick mark finished if the activity has been finished and select the finish date. B.Resource Inactivity details window, select resource tab. Then select the resources which are to be added to the particular activity C.Code Inactivity details window, select code tab. Then select the activity code for each resource. D.Notebook Inactivity details window, select notebook tab. Select the topic which we want to note and write the details in notebook topic. E.Steps In activity details window, select steps tab. Then if the activity has any steps update the activity in percentage complete and put a tick mark if the activity has been completed. F.Feedback Inactivity details window, select feedback tab. Then the details for the resources have to be mentioned in feedback. G.Work products and documents (WPs & Docs) In activity details window, select the WPS & Docs tab. Then the drawings, documents, specifications have to be uploaded here. 13.Weekly updates to be made: A.Threshold In the directory, bar chooses threshold tab. Then 3 variances are to be monitored regularly; finished date variance, start date, variance, and cost variance. B.Issues In the directory, bar chooses project issues. The values which fall outside the threshold values are indicated in the issues. The contractor also has to add issues if there are any. C.Reports Choose tools. Then choose the data date which we want to update the progress. All the activities done in that week has to be selected. Then select update progress. 14.Earned value: Earned value is a method or technique use to determine project performance according to both project value, duration and schedule. The technique makes comparison between the budgeted cost of the work to the actual cost. The earned value of the work or project has been estimated after including the actual cost of each activity inclusive of expenditures. In Microsoft Project, the Earned Value Analysis is done by adding columns of planned value, actual value, budgeted value, cost variance, schedule variance, cost variance, budget at completion, and variance at completion and estimate at completion. So from the data obtained by the Microsoft Project, we do the analysis according to the process as mentioned in the literature review and according to that, we plan for the remaining project. 3.3 CORRECTIVE ACTIONS: In the case of time over-run, we have to review the schedule of activities, interdependencies, explore the possibilities of crashing the activities in the critical path, by increasing/reallocating available resources, draw revised schedule in an attempt to minimize the re-examine their @ IJTSRD | Available Online @ www.ijtsrd.com | Volume – 2 | Issue – 5 | Jul-Aug 2018 Page: 1488
International Journal of Trend in Scientific Research and Development (IJTSRD) ISSN: 2456-6470 slippage. This has to be a continuous process rather than a one-time correction. In the case of cost overrun, we review the planned/budgeted cost estimates to complete the project and possibilities of cost reduction by crashing/decompression of activities, postponing allocation of resources to non-critical activities to the extent possible, reduction in resources considered redundant and other feasible means. In real life situations, we are sometimes confronted with the problem of matching the schedule with limited resources, e.g. manpower, funds, etc. In such a case we reallocate resources to activities, in order of priority, most critical activity getting the top priority in the matter. The attempt would be to redistribute the resources without incurring time overrun. If impossible, we would try to keep it to the least possible value. 3.4 ORGANIZATIONAL STRUCTURE OR OBS OBS is a hierarchical model describing the established organizational framework for project planning, resource management, time and expense tracking, cost allocation, revenue/profit reporting, and work management. The OBS for the undertaking Project is shown below: - BREAKDOWN Figure 2 Organisational Breakdown Structure @ IJTSRD | Available Online @ www.ijtsrd.com | Volume – 2 | Issue – 5 | Jul-Aug 2018 Page: 1489
International Journal of Trend in Scientific Research and Development (IJTSRD) ISSN: 2456-6470 4. 4.1 SCHEDULING From the bill of quantities, we have prepared the schedule of the project. In the schedule, we assign the relationship to all the activities related to the project and define the code for the work breakdown structure WBS. Figure 2: WBS1 EARN VALUE ANALYSIS Figure 3: Work Breakdown Structure 4.2 RESOURCE ALLOCATION All the resource is allocated according to the resource sheet and BOQ, which will further help in finding out the actual cost of the project. In the below table the reinforcement and concrete quantity of every floor are calculated as per the drawings available from the site and BOQ. @ IJTSRD | Available Online @ www.ijtsrd.com | Volume – 2 | Issue – 5 | Jul-Aug 2018 Page: 1490
International Journal of Trend in Scientific Research and Development (IJTSRD) ISSN: 2456-6470 Table 4.1: Quantity of every floor are calculated as per the drawings Floor Reinforcement Concrete 76.62-ton column 82.48-ton slab 38.07-ton column 41.87-ton slab 36.61-ton column 57.67-ton slab 28.33-ton column 57.61-ton slab 29.10-ton column 58.25-ton slab 28.83-ton column 58.19-ton slab 28.65-ton column 58.52-ton slab 28.65-ton column 60.62-ton slab 28.65-ton column 58.52-ton slab 28.65-ton column 58.52-ton slab 28.65-ton column 58.52-ton slab 28.65-ton column 60.62-ton slab 28.65-ton column 58.52-ton slab 28.65-ton column 58.52-ton slab 250 cum M50 column 1200 cum M40 Slab 150 cum M50 column 450 cum M40 Slab 200 cum M50 column 600 cum M40 Slab 200 cum M50 column 600 cum M40 Slab 200 cum M50 column 600 cum M40 Slab 200 cum M50 column 600 cum M40 Slab 200 cum M50 column 600 cum M40 Slab 200 cum M50 column 630 cum M40 Slab 200 cum M50 column 600 cum M40 Slab 200 cum M50 column 600 cum M40 Slab 200 cum M50 column 600 cum M40 Slab 200 cum M50 column 630 cum M40 Slab 200 cum M50 column 600 cum M40 Slab 200 cum M50 column 600 cum M40 Slab 200 cum M50 column 630 cum M40 Slab 200 cum M50 column 600 cum M40 Slab 200 cum M50 column 600 cum M40 Slab Ground Floor First Floor Second Floor Third Floor Fourth Floor Five Floor Six Floor Seventh Floor Eighth Floor Ninth Floor Tenth Floor Eleventh Floor Twelfth Floor Thirteenth Floor Fourteenth Floor 28.65-ton column 60.62-ton slab 28.65-ton column 58.52-ton slab 28.65-ton column 58.52-ton slab Fifteenth Floor Sixteenth Floor 4.3 TARGET AND DELAYS Earned Value Analysis required both the baseline completion date which we also refer as the completion date as mentioned in the master schedule and the actual completion at which actual work had been completed on the site. As it helps us to know that our project is running as per the master schedule or not. This tells us that which activities take more time and which are the most critical activities and according to this the further catch-up plan was prepared to bring the project within the dates mentioned in the master schedule. @ IJTSRD | Available Online @ www.ijtsrd.com | Volume – 2 | Issue – 5 | Jul-Aug 2018 Page: 1491
International Journal of Trend in Scientific Research and Development (IJTSRD) ISSN: 2456-6470 Table 4.2: Catch-Up Plan as Per Schedule Master Schedule Baseline Completion Actual completion 16.09.2015 24.12.2015 24.12.2015 Raft (East side) 24.01.2016 Raft ( West Side) 21.02.2016 Retaining wall 19.02.2016 GF - Slab casting 15-03-2016 FF – Slab casting 27.03.2016 SF – Slab casting 08.04.2016 TF – Slab casting 20.04.2016 Fourth Floor Slab 03.05.2016 Fifth Floor Slab 15.05.2016 Sixth floor slab 27.05.2016 Seventh floor slab 08.06.2016 Eighth-floor slab 20.06.2016 Ninth floor slab 02.07.2016 Tenth-floor slab 14.07.2016 Eleventh floor slab 26.07.2016 Twelfth-floor slab 07.08.2016 Thirteen-floor slab 20.08.2016 Fourteenth floor slab 01.09.2016 Fifteenth floor slab 13.09.2016 Sixteenth floor slab 25.09.2016 Terrace floor slab 08.10.2016 Activity Excavation Soiling PCC Remarks Completed Completed Completed Completed Completed Completed Completed Completed Completed 24.01.2016 21.02.2016 25.03.2016 20.03.2016 05.04.2016 20.04.2016 04.05.2016 16.05.2016 31.05.2016 06.12.2016 22.06.2016 02.07.2016 12.07.2016 22.07.2016 08.01.2016 13.08.2016 24.08.2016 04.09.2016 15.09.2016 26.09.2016 07.10.2016 Completed ( 5 days delay) Completed ( 9 days delay) Completed ( 12 days delay) Completed ( 14 days delay) Completed ( 13 days delay) Completed ( 16 days delay) Completed (16 days delay) Completed (14 days delay) Completed (12 days delay) Completed (10 days delay) Completed (8 days delay) Completed (6 days delay) Completed (6 days delay) Completed (4 days delay) Completed (3 days delay) Completed (2 days delay) Completed (1-day delay) Completed (1 day earlier) 4.4 CATCH UP PLAN Initially the project was running in time as per the planned schedule, the project got delayed from the ground floor slab and up to the sixth floor the delay was up to 14 days from the master schedule, so to catch the project on time as well as cost this catch-up plan is implemented so that the project can be completed on time. As per the revised catch-up plan we were able to catch the delayed schedule with the master schedule at the completion of the sixteenth-floor slab. Figure 4: Crushing of Activities @ IJTSRD | Available Online @ www.ijtsrd.com | Volume – 2 | Issue – 5 | Jul-Aug 2018 Page: 1492
International Journal of Trend in Scientific Research and Development (IJTSRD) ISSN: 2456-6470 In the above figure, we crunched the column and the shear wall activity from seven days to six days, by using aluminium formwork instead of steel formwork for the shear wall formwork and the slab reinforcement from six days to five days by deploying the steel fitter and fitter helper from the diagonal directions, hence the slab cycle was reduced from twelve days to ten days. The picture shown below is showing when we are going to catch-up the milestone finish date Figure 5: Catch-up Plan 4.5 LABOUR PRODUCTIVITY The labor productivity of the typical 2nd floor with the duration and the quantity is calculated and according to the output of the labor productivity of the 2nd floor, we counted the number of labors for the upper floor taking the same productivity up to the 4th floor. Table 4.3: Labour Productivity Sr. No. 1. Columns and shear wall reinforcement 2. Column and shear wall shuttering 1670 m2 Activity Quantity Duration No of Labour Labour Productivity 15.25 kg/hr 36.61 ton 5 days 5 Steel fitter=40 Fitter helper=20 Carpenter= 14 Helper= 7 Steel fitter= 50 Fitter helper= 30 Carpenter= 25 Helper = 15 1.98 m2/hr 3. Slab and Beam Reinforcement 57.67 ton 5 18.02kg/hr 4. Slab and Beam Shuttering 2800 m2 7 1.4 m2/hr @ IJTSRD | Available Online @ www.ijtsrd.com | Volume – 2 | Issue – 5 | Jul-Aug 2018 Page: 1493
International Journal of Trend in Scientific Research and Development (IJTSRD) ISSN: 2456-6470 Afterwards due to the delay in shear wall activity we replaced the steel formwork with the standard ballax so that it helps in increasing the labour productivity for the shear wall from 1.98 sq.m per hour to 2.48 sq.m per hour, which helps us to do the required amount of shuttering work within 4days and with the same number of labour. As it comes in the panel so first time just coupled them according to the required size so that it can be similarly used in all typical floors helps in fastening the work. 4.6 TRACKING OF PROJECT IN THE MIDDILE OF THE WORK Construction of a Basement + GROUND FLOOR+ 16 floors residential building of Total Floor Area -36374.05 Sqm (Basement – 3593.14 Sqm + GF – 1238 Sqm +Upper floors – about2100 Sqm) Total Built up Area – 27892.67 Sqm (as per Architectural drawings issued for info) The residential building has parking in the basement and at the ground floor Basement – 5450 mm; 4250 mm for upper floors. The budget of the building is around Rs. 250,596,083.95. The duration for completion of the work is 20 months. Table 4.4: Project Budget Complete Sr. No 1 1/4/2015 to 18/8/2015 2 19/8/2015 to 31/12/2016 3 1/01/2016 to 28/2/2016 R/f 4 1/03/2016 to 30/4/2016 Casting 5 1/05/2016 to 30/6//2016 Casting 6 1/07/2016 to 31/8/2016 Reinforcement 7 1/09/2016 to 31/10/2016 8 1/11/2016 to 31/12/2016 9 1/01/2017 to 05/2/2017 Table 4.5: Earned Value of Project Actual budgeted cost (Baseline cost) Estimate at Completion Rs. 250,491,385.91 Variance at completion Rs. 104,698.04 4.7.1EVM FROM 1-APRIL-15 to 18-AUGUST- 15 PRE-CONSTRUCTION EAC ACWP BCWP Rs. 250,596,083.95 830,000.00 830,000.00 Reporting period Work Progress Planned Value PV 830,000.00 Earned Value Actual Cost Pre-construction phase 830,000.00 830,000.00 Sub-Structure 9,297,360.00 18,998,620.00 9,297,360.00 18,998,620.00 9,297,360.00 18,998,620.00 Up-to Ground Floor Slab Up-to 4th Floor Column 64,860,951.69 64,860,951.69 65,111,166.69 Up-to 9th Floor Column 113,261,210.29 113,261,210.29 113,511,543.57 Up-to 14th Slab 169,183,015.24 169,183,015.24 169,191,172.19 Up-to 4th LMR Slab 234,098,021.45 234,098,021.45 233,993,733.24 Finishing Work 239,707,188.11 239,707,188.11 239,602,115.53 Handing over 249,596,083.00 249,596,083.00 249,491,795.74 Rs. 250,596,083.95 Rs. Rs. Figure 6: EVM from 1-April-15 to 18-August-15 @ IJTSRD | Available Online @ www.ijtsrd.com | Volume – 2 | Issue – 5 | Jul-Aug 2018 Page: 1494
International Journal of Trend in Scientific Research and Development (IJTSRD) ISSN: 2456-6470 TASK NAME ➢Pre-construction plan ➢Execution ➢Substructure ➢Excavation ➢Footing / raft work/retaining wall (basement Floor. Slab) ➢Retaining wall ➢Basement slab Table 4.6: EVM Analysis (1-April-15 to 18-August- 15) S. No TERMINOLOGY 1 EAC 2 BCWS 3 BCWP 4 ACWP 5 CV 6 SV 7 VAC 4.7.2EVM FROM 19-AUGUST-15 to 31- DECEMBER-15 PROGRESS EAC ACWP Rs. 250,596,083.95 9,297,360.00 Table 4.7: EVM Analysis (19-August-15 to 31- December-15) S. No TERMINOLOGY 1 EAC 2 BCWS 3 BCWP 4 ACWP 5 CV 6 SV 7 VAC AMOUNT Rs. 250,596,083.95 Rs. 9,297,360.00 Rs. 9,297,360.00 Rs. 9,297,360.00 Rs. 0 (Rs. 241,298,723.95) Rs. 0 4.7.3EVM FROM 1-JANUARY-16 to 28-FEB-16 SUPERSTRUCTURE PROGRESS EAC ACWP Rs. 250,596,083.95 18,998,620.00 AMOUNT Rs. 250,596,083.95 Rs. 830,000.00 Rs. 830,000.00 Rs. 830,000.00 Rs. 0 Rs. 248,766,083.95 Rs. 0 BCWP Rs. 18,998,620.00 Rs. SUBSTRUCTURE BCWP Rs. 9,297,360.00 Rs. Figure 8: EVM from 1-January-16 to 28- February-16 TASK NAME ➢Substructure ➢Excavation ➢Footing / raft work/retaining wall (basement floor. Slab) Table 4.8: EVM Analysis (1-January-16 to 28- February-16) S. No TERMINOLOGY 1 EAC 2 BCWS 3 BCWP 4 ACWP 5 CV 6 SV 7 VAC AMOUNT Rs. 250,596,083.95 Rs. 18,998,620.00 Rs. 18,998,620.00 Rs. 18,998,620.00 Rs. 0 Rs. 230,597,463.95 Rs. 0 Figure 7: EVM from 19-August-15 to 31- December-15 TASK NAME ➢Execution ➢Substructure ➢Excavation ➢Footing / raft work/retaining wall (basement floor. Slab) ➢Retaining wall ➢Execution @ IJTSRD | Available Online @ www.ijtsrd.com | Volume – 2 | Issue – 5 | Jul-Aug 2018 Page: 1495
International Journal of Trend in Scientific Research and Development (IJTSRD) ISSN: 2456-6470 4.7.4EVM FROM 1-MARCH-16 to 30-APRIL- 16 SUPERSTRUCTURE PROGRESS EAC ACWP Rs. 251,564,142.91 TASK NAME ➢4th Floor Slab ➢5th Floor Slab ➢6th Floor Slab ➢7th Floor Slab ➢8th Floor Slab ➢9th Floor Slab Table 4.10: EVM Analysis (1-May-16 to 30-June- 16) S.No TERMINOLOGY 1 EAC 2 BCWS 3 BCWP 4 ACWP 5 CV 6 SV 7 VAC 4.7.6EVM FROM 1-JULY-16 to 31-AUGUST-16 SUPERSTRUCTURE PROGRESS EAC ACWP Rs. 250,608,516.82 169,191,172.19 BCWP Rs. 64,860,951.69 Rs. 65,111,166.69 AMOUNT Rs. 251,150,599.54 Rs. 113,261,210.29 Rs. 113,261,210.29 Rs. 113,511,543.57 (Rs. 250,333.28) (Rs. 136,334,873.66) (Rs. 554,515.59) Figure 9: EVM from 1-March-16 to 28-April-16 TASK NAME ➢Slab Shuttering ➢Slab Reinforcement ➢PT Work ➢Slab Casting ➢1st Floor Slab ➢3rd Floor Slab Table 4.9: EVM Analysis (1-March-16 to 28-April- 16) S.No TERMINOLOGY 1 EAC 2 BCWS 3 BCWP 4 ACWP 5 CV 6 SV 7 VAC 4.7.5EVM FROM 1-MAY-16 to 30-JUNE-16 SUPERSTRUCTURE PROGRESS EAC ACWP Rs. 251,150,599.54 113,511,543.57 BCWP Rs. Rs. 169,183,015.24 AMOUNT Rs. 251,564,142.91 Rs. 64,860,951.69 Rs. 64,860,951.69 Rs. 65,111,166.69 (Rs. 250,215.00) (Rs. 184,735,132.26) (Rs. 968,058.96) Figure 11: EVM from 1- July -16 to 31-August-16 TASK NAME ➢10th Floor Slab ➢11th Floor Slab ➢12th Floor Slab ➢13th Floor Slab ➢14th Floor Slab Table 4.11: EVM Analysis (1- July -16 to 31- August-16) S.N TERMINOLOGY 1 EAC 2 BCWS 3 BCWP 4 ACWP 5 CV 6 SV 7 VAC BCWP Rs. Rs. 113,261,210.29 AMOUNT Rs. 250,608,311.76 Rs. 169,183,015.24 Rs. 169,183,015.24 Rs. 169,191,172.19 (Rs. 8,156.96) (Rs. 80,413,068.71) (Rs. 12,227.81) Figure 10: EVM from 1-May-16 to 30-June-16 @ IJTSRD | Available Online @ www.ijtsrd.com | Volume – 2 | Issue – 5 | Jul-Aug 2018 Page: 1496
International Journal of Trend in Scientific Research and Development (IJTSRD) ISSN: 2456-6470 4.7.7 EVM FROM 1-SEPTEMBER-16 to 31- OCTOBER-16 SUPERSTRUCTURE PROGRESS EAC ACWP Rs. 250,608,516.82 233,993,733.24 TASK NAME ➢Water Tank ➢Parapet Wall - RCC - 1.50 M Ht. ➢Block work ➢Internal Plaster/GVP Finish ➢Façade Work Table 4.13: EVM Analysis (1-November-16 to 31- December-16) S.No TERMINOLOGY 1 EAC 2 BCWS 3 BCWP 4 ACWP 5 CV 6 SV 7 VAC 4.7.9EVM FROM 1-JANUARY-17 to 12- FEBRUARY-17 HANDING OVER EAC ACWP BCWP Rs. Rs. 234,098,021.45 AMOUNT Rs. 250,487,115,.53 Rs. 239,707,188.11 Rs. 239,707,188.11 Rs. 239,602,115.53 Rs. 104,288.20 (Rs. 9,888,895.83) Rs. 108,968.42 Figure 12: EVM from 1-September-16 to 31- October-16 TASK NAME ➢15th Floor Slab ➢16th Floor Slab ➢Terrace Slab ➢LMR Slab ➢Staircase Railing ➢Flooring And Cladding Work Table 4.12: EVM Analysis (1-September-16 to 31- October-16) S. No TERMINOLOGY 1 EAC 2 BCWS 3 BCWP 4 ACWP 5 CV 6 SV 7 VAC 4.7.8EVM FROM 1-NOVEMBER-16 to 31- DECEMBER-16 PROGRESS EAC ACWP Rs. 250,487,115.53 239,602,899.91 BCWP Rs. Rs. Rs. 249,596,083.95 249,491,795.74 249,596,083.95 AMOUNT Rs. 250,484,539.79 Rs. 234,098,021.45 Rs. 234,098,021.45 Rs. 233,993,733.24 Rs. 104,288.20 (Rs. 15,498,062.50) Rs. 111,544.16 SUPERSTRUCTURE BCWP Rs. Rs. Figure 14: EVM from 1-January-17 to 12- February-17 239,707,188.11 TASK NAME ➢Application Submission For Statutory Approval To Gift City ➢Statutory Approvals From Gift City ➢Fire NOC ➢LEED Certification ➢Completion Certificate ➢OC of the Building Figure 13: EVM from 1-November-16 to 31- December-16 @ IJTSRD | Available Online @ www.ijtsrd.com | Volume – 2 | Issue – 5 | Jul-Aug 2018 Page: 1497
International Journal of Trend in Scientific Research and Development (IJTSRD) ISSN: 2456-6470 Table 4.14: EVM Analysis (1-January-16 to 12- February-17) S. No TERMINOLOGY 1 EAC 2 BCWS 3 BCWP 4 ACWP 5 CV 6 SV 7 VAC AMOUNT Rs. 250,487,115.53 Rs. 249,596,083.90 Rs. 249,596,083.90 Rs. 249,491,795.74 Rs. 104,288.20 - Rs. 104,698.04 Figure 15: EVM of Overall Project In the above graph, the budgeted cost of work scheduled is Rs.249,596,083.95 but through the proper monitoring and the Earned Value Analysis, we are able to complete the project activities under the budgeted allocated i.e. Actual cost of work performed is Rs. 249,491,795.74. The project goes over budget for the month of April 2016 by (Rs. 250,215.00) and so the variance at completion is (Rs. 968,058.96). Through the proper planning and the new catch-up plan, we are able to complete the project on time and under the budgeted cost at an additional profit of. Rs.104,288.20. 4.8 EARN VALUE OF OVERALL PROJECT The projects earned value based on the status date. If the actual cost (ACWP) is higher than earned value (BCWP), then the project is over budget. If planned value (BCWS) is higher than earned value, then the project is behind schedule. BCWS ACWP Rs. 249,596,083.95 249,491,795.74 BCWP Rs. Rs. 249,596,083.95 Figure 16: Earned value in Microsoft Project @ IJTSRD | Available Online @ www.ijtsrd.com | Volume – 2 | Issue – 5 | Jul-Aug 2018 Page: 1498
International Journal of Trend in Scientific Research and Development (IJTSRD) ISSN: 2456-6470 Figure 17: Resource sheet in Microsoft Project Figure 18: Resource Allocation and Slippage from baseline schedule @ IJTSRD | Available Online @ www.ijtsrd.com | Volume – 2 | Issue – 5 | Jul-Aug 2018 Page: 1499
International Journal of Trend in Scientific Research and Development (IJTSRD) ISSN: 2456-6470 Figure 19: Labour Productivity 4.8LIMITATIONS OF OUR STUDY In our project study, we have not included special works involving specially nominated sub-contractor. The additional sub-activities of the HVAC work is not included in our study work. ➢For some work, we have taken the cost of material as per tender rate which is quite low as it was provided by the client and the site is located in a SEZ area so there is a relaxation in the taxes in the material. ➢We have taken the rate of facade material as per the current market rate. ➢In the budgeting, we have not included the cost of Project manager, construction manager, and site engineer. ➢We track and monitor the project at a regular period of 2 months. As due to the limitations of the study material which we gathered from the site, we are not able to include the budget for certain work in the budgeting of the activities, so the earned value report is not having any part of such certain activities like the appointment of vendor and contractor’s profit. 4.9SEQUENCING OF THE WORK DONE IN OUR PROJECT A.Review of BOQ – We obtained the BOQ from the GIFT site, the BOQ comprises of schedule of different activities and the approximate quantities. The total estimated cost of the project is anticipated from the BOQ as per the quantities and rate B.Organization Breakdown Structure (OBS) C.Scheduling – With the help of Bill of Quantity (BOQ) in Microsoft Project (MSP) D.Resource Sheet- Machinery, Manpower, and Materials E.Planning – Material and manpower requirement as per quantities are given in Tender document F.Resource allocation – All the resource is allocated with the help of BOQs and R.A. bills G.Budgeting H.Tracking and monitoring as per the baseline schedule I.Preparation of the catch-up plan J.Again track the project till the completion of the project K.Prepare Earned Value Report L.Conclusion. @ IJTSRD | Available Online @ www.ijtsrd.com | Volume – 2 | Issue – 5 | Jul-Aug 2018 Page: 1500
International Journal of Trend in Scientific Research and Development (IJTSRD) ISSN: 2456-6470 5. 5.1 CONCLUSION As our study for applying the Earn Value Management on construction project which was completed in 2017, from preliminary study project details and technical review of papers related to Earn Value Management, we conclude that Earned Value Management helps to do the particular project within the stipulated time and cost and it has a huge future scope in the construction industry. Through the earned value report of our project, it has been observed that our project is on schedule to the ground floor slab and it starts delay from the ground floor slab casting so it causes an increase in the project cost and time as well. First, the delay was 5 days and the delay goes on up to 16 days continuous up to 5th floor until the catch-up plan was implemented which crunch down the activities of column and shear wall by 1 day and slab reinforcement by 1 day so that we are able to catch up the master baseline schedule dates. ➢First, the cause of the delay was the shear wall shuttering activity which was done by steel formwork and after knowing it is one of the reason for the delay it got replaced by the standard ballax sheet. Secondly, it takes a lot of time for the slab and beam reinforcement so there is a change in the pattern of work as 2 different teams of steel fitter and helper are assigned diagonally to complete the work and provide the front to the post-tensioning work and this helps to reduce the slab reinforcement activity by 1 day. Initially Shortage of labours though for completing the project within time and budget the more skilled labours are arranged. ➢By doing all the above-mentioned techniques we are able to complete the project within the time but due to the certain delay and crunching of activity project, there is a cost variance of Rs. 104,288.20 positive means we completed our project with an additional profit of Rs 104,288.20 Through the proper tracking and monitoring, we are able to come down the variance at completion which is Rs. 968,058.96 negative up to the month of April to Rs 104,698.24 positive at the completion of the project means we have done our project activities under the actual cost allocated for those activities. According to the above data, we conclude that Earned Value Management helps to do the particular project CONCLUSIONS AND FUTURE SCOPE within the stipulated time and cost and it has a huge future scope in the construction industry. 5.2 FUTURE SCOPE The concept of Earned value management or Earn Value Technique, it involves two terms from the study for the better monitoring and tracking of the actual completion date of the project. 1.Earned Schedule: The Earned Schedule value can be graphically determined by finding the point Earned Value at a given time meets the Planned Value curve. The projection of this point on the time axis (horizontal coordinate) then defines the Earned Schedule. Figure 2 S-CURVES 2.Earned Duration: The new technique, Earned Duration Management (EDM), eliminates the use of cost data in the scheduling context. The Earned Duration (ED) concept (Khamooshi & Golafshani, 2014) was created to address the shortcomings of Earned Schedule due to the usage of cost-based data as proxies for assessing the schedule performance of projects. Its foundation lies in the exclusive usage of time-based data for the generation of physical progress indicators. Thus, schedule performance indicators become free from any dependency on planned cost values, and therefore, are no longer influenced by them. The concept of schedule monitoring and control as one of the most important functions of project and program management has not been fully exploited. EVM was originally developed as a cost management and control tool which was extended to track the schedule as well. EVM and its derivatives (e.g. Earned Schedule) use cost as a proxy to measure schedule performance to control the duration of the project. While there is a correlation between schedule, cost, quality, and scope of a project, using cost to control duration has proven to be misleading. @ IJTSRD | Available Online @ www.ijtsrd.com | Volume – 2 | Issue – 5 | Jul-Aug 2018 Page: 1501
International Journal of Trend in Scientific Research and Development (IJTSRD) ISSN: 2456-6470 3.Dr. Arun Dhawale1 Vaishnavi Tuljapurkar,”Cost control and tracking of a building by earned value method”, International Journal of Technical Research and Applications e-ISSN: 2320-8163, www.ijtra.com Volume 3, Issue 2 (Mar-Apr 2015), PP. 15-22. 4.Andrew Fernans Tom1, Sachin Paul,”Project Monitoring and Control using Microsoft Project”, International Journal of Innovative Research in Science, Engineering, and Technology Vol. 2, Issue 3, March 2013. 5.ANUJ DUBEY,” Earned Value Analysis For A Construction Project, Anuj Dubey, Journal Impact Factor (2015): 9.1215”, Volume 6, Issue 6, June (2015), Pp. 53-66 Article ID: 20320150606006 International Journal of Civil Engineering and Technology (IJCIET). 6.Ms. Radhika R. Gupta, Prof. Parag S. Mahatme, Prof. Taran C. Bhagat “The cost controlling and monitoring of construction project through earned value management system”, International Journal of Advanced Technology in Engineering and Science, Volume No 03, Special Issue No. 01, March 2015. 7.Shu CHEN and Xueqing ZHANG”An Analytic Review of Earned Value Management Studies in the Construction Industry”, Construction Research Congress 2012 © ASCE 2012 8.Rajesh Ganpat Virle and Sumedh Y Mhaske ”Monitoring Of Construction Projects Using Evm And Esm Tools”, www.ijscer.com Vol. 2, No. 4, November 2013. 9.Sandhya Suresh, Ganapathy Ramasamy N “Analysis Of Project Performance Using Earned Value Analysis” International Journal of Science, Engineering and Technology Research (IJSETR) Volume 4, Issue 4, April 2015 In contrast to Earned Value and Earned Schedule, the Earned Duration Management (EDM) has developed in which decoupled schedule and cost performance measures and developed a number of indices to measure progress and performance of schedule and cost, as well as the efficacy and efficiency of the plan at any level of the project. These new indices are easy to understand, have wider applications, and can be used by contractors, clients and the scheduling offices to assess and measure schedule performance. The newly developed duration performance measures are all schedule-based and can be used for forecasting the finish date of the project. Earned Schedule theory represents the two measures SV and SPI in 2 separate domains: currency and time. They are named as SV (Rs) and SPI (Rs), to indicate they relate to currency; and SV(t) and SPI(t), to indicate they relate to time. A stated advantage of Earned Schedule methods is that no new data collection processes are required to implement and test Earned Schedule; it only requires updated formulas. Earned Schedule theory also provides updated formulas for predicting project completion date, using the time-based measures. REFERENCES 1.T. Subramani, D. S. Stephan Jabasingh, J. Jayalakshmi,” Analysis of Cost Controlling In Construction Industries by Earned Value Method Using Microsoft Project” Int. Journal of Engineering Research and Applications ISSN: 2248-9622, Vol. 4, Issue 6( Version 1), June 2014, pp.145-153. 2.Ray W. Stratton, EVP,” Applying Earned Schedule Analysis to EVM data for Estimating Completion Date”, 2007 AACE International Transactions. – 6009 ISSN 2319 @ IJTSRD | Available Online @ www.ijtsrd.com | Volume – 2 | Issue – 5 | Jul-Aug 2018 Page: 1502