Download
1 / 4
40 likes | 43 Views
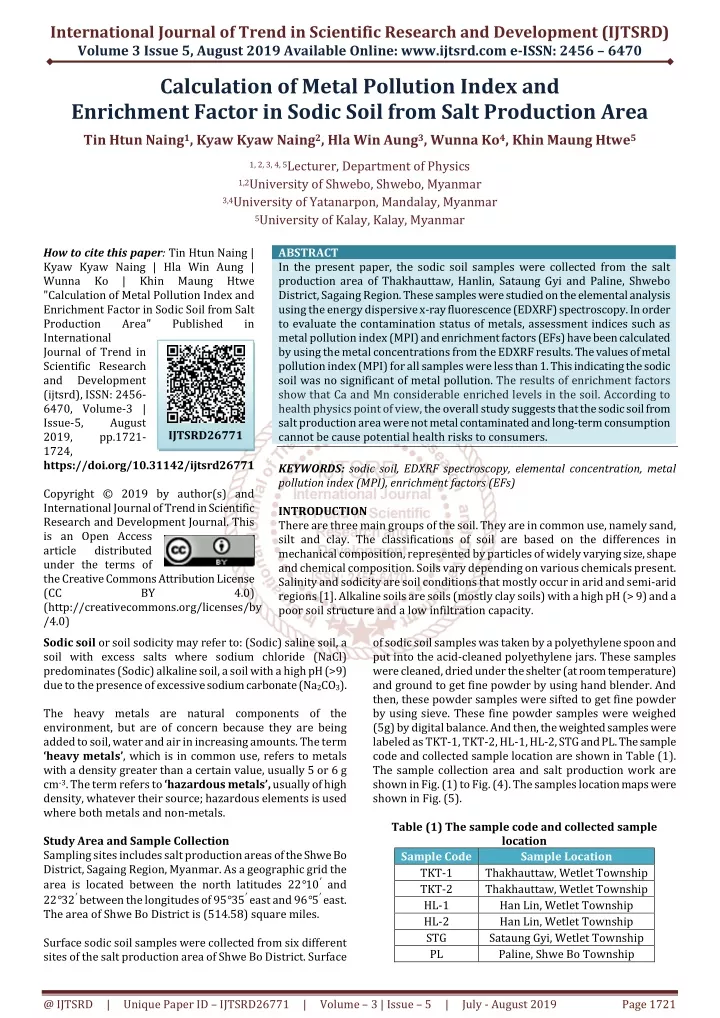
In the present paper, the sodic soil samples were collected from the salt production area of Thakhauttaw, Hanlin, Sataung Gyi and Paline, Shwebo District, Sagaing Region. These samples were studied on the elemental analysis using the energy dispersive x ray fluorescence EDXRF spectroscopy. In order to evaluate the contamination status of metals, assessment indices such as metal pollution index MPI and enrichment factors EFs have been calculated by using the metal concentrations from the EDXRF results. The values of metal pollution index MPI for all samples were less than 1. This indicating the sodic soil was no significant of metal pollution. The results of enrichment factors show that Ca and Mn considerable enriched levels in the soil. According to health physics point of view, the overall study suggests that the sodic soil from salt production area were not metal contaminated and long term consumption cannot be cause potential health risks to consumers. Tin Htun Naing | Kyaw Kyaw Naing | Hla Win Aung | Wunna Ko | Khin Maung Htwe "Calculation of Metal Pollution Index and Enrichment Factor in Sodic Soil from Salt Production Area" Published in International Journal of Trend in Scientific Research and Development (ijtsrd), ISSN: 2456-6470, Volume-3 | Issue-5 , August 2019, URL: https://www.ijtsrd.com/papers/ijtsrd26771.pdf Paper URL: https://www.ijtsrd.com/physics/other/26771/calculation-of-metal-pollution-index-and-enrichment-factor-in-sodic-soil-from-salt-production-area/tin-htun-naing<br>

E N D
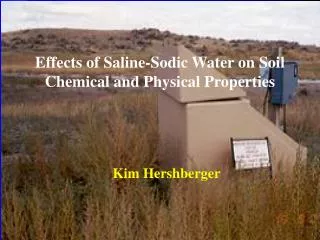
International Journal of Trend in Scientific Research and Development (IJTSRD) Volume 3 Issue 5, August 2019 Available Online: www.ijtsrd.com e-ISSN: 2456 – 6470 Calculation of Metal Pollution Index and Enrichment Factor in Sodic Soil from Salt Production Area Tin Htun Naing1, Kyaw Kyaw Naing2, Hla Win Aung3, Wunna Ko4, Khin Maung Htwe5 1, 2, 3, 4, 5Lecturer, Department of Physics 1,2University of Shwebo, Shwebo, Myanmar 3,4University of Yatanarpon, Mandalay, Myanmar 5University of Kalay, Kalay, Myanmar How to cite this paper: Tin Htun Naing | Kyaw Kyaw Naing | Hla Win Aung | Wunna Ko | Khin "Calculation of Metal Pollution Index and Enrichment Factor in Sodic Soil from Salt Production Area" International Journal of Trend in Scientific Research and Development (ijtsrd), ISSN: 2456- 6470, Volume-3 | Issue-5, August 2019, pp.1721- 1724, https://doi.org/10.31142/ijtsrd26771 Copyright © 2019 by author(s) and International Journal of Trend in Scientific Research and Development Journal. This is an Open Access article distributed under the terms of the Creative Commons Attribution License (CC BY (http://creativecommons.org/licenses/by /4.0) Sodic soil or soil sodicity may refer to: (Sodic) saline soil, a soil with excess salts where sodium chloride (NaCl) predominates (Sodic) alkaline soil, a soil with a high pH (>9) due to the presence of excessive sodium carbonate (Na2CO3). The heavy metals are natural components of the environment, but are of concern because they are being added to soil, water and air in increasing amounts. The term ‘heavy metals’, which is in common use, refers to metals with a density greater than a certain value, usually 5 or 6 g cm-3. The term refers to ‘hazardous metals’, usually of high density, whatever their source; hazardous elements is used where both metals and non-metals. Study Area and Sample Collection Sampling sites includes salt production areas of the Shwe Bo District, Sagaing Region, Myanmar. As a geographic grid the area is located between the north latitudes 22°10′ and 22°32′ between the longitudes of 95°35′ east and 96°5′ east. The area of Shwe Bo District is (514.58) square miles. Surface sodic soil samples were collected from six different sites of the salt production area of Shwe Bo District. Surface ABSTRACT In the present paper, the sodic soil samples were collected from the salt production area of Thakhauttaw, Hanlin, Sataung Gyi and Paline, Shwebo District, Sagaing Region. These samples were studied on the elemental analysis using the energy dispersive x-ray fluorescence (EDXRF) spectroscopy. In order to evaluate the contamination status of metals, assessment indices such as metal pollution index (MPI) and enrichment factors (EFs) have been calculated by using the metal concentrations from the EDXRF results. The values of metal pollution index (MPI) for all samples were less than 1. This indicating the sodic soil was no significant of metal pollution. The results of enrichment factors show that Ca and Mn considerable enriched levels in the soil. According to health physics point of view, the overall study suggests that the sodic soil from salt production area were not metal contaminated and long-term consumption cannot be cause potential health risks to consumers. KEYWORDS: sodic soil, EDXRF spectroscopy, elemental concentration, metal pollution index (MPI), enrichment factors (EFs) INTRODUCTION There are three main groups of the soil. They are in common use, namely sand, silt and clay. The classifications of soil are based on the differences in mechanical composition, represented by particles of widely varying size, shape and chemical composition. Soils vary depending on various chemicals present. Salinity and sodicity are soil conditions that mostly occur in arid and semi-arid regions [1]. Alkaline soils are soils (mostly clay soils) with a high pH (> 9) and a poor soil structure and a low infiltration capacity. Maung Htwe Published in IJTSRD26771 4.0) of sodic soil samples was taken by a polyethylene spoon and put into the acid-cleaned polyethylene jars. These samples were cleaned, dried under the shelter (at room temperature) and ground to get fine powder by using hand blender. And then, these powder samples were sifted to get fine powder by using sieve. These fine powder samples were weighed (5g) by digital balance. And then, the weighted samples were labeled as TKT-1, TKT-2, HL-1, HL-2, STG and PL. The sample code and collected sample location are shown in Table (1). The sample collection area and salt production work are shown in Fig. (1) to Fig. (4). The samples location maps were shown in Fig. (5). Table (1) The sample code and collected sample location Sample Code Sample Location TKT-1 Thakhauttaw, Wetlet Township TKT-2 Thakhauttaw, Wetlet Township HL-1 Han Lin, Wetlet Township HL-2 Han Lin, Wetlet Township STG Sataung Gyi, Wetlet Township PL Paline, Shwe Bo Township @ IJTSRD | Unique Paper ID – IJTSRD26771 | Volume – 3 | Issue – 5 | July - August 2019 Page 1721
International Journal of Trend in Scientific Research and Development (IJTSRD) @ www.ijtsrd.com eISSN: 2456-6470 Fig. (1) Salt Production Area (A)Wetlet Township Fig. (2) Salt Production Area (B) Shwebo Township Fig.(5) The samples location map Sample Preparation of XRF Measurement Sample preparation is an important role in XRF measurement. Prepared pellets must be homogenized. After drying, the samples were ground by using paste to get fine powder. Binder agent is needed to obtain stable pellet. In this experiment, CEREOX Wax is used as binder. Sample 5g and binder 1g were weighed using digital balance (PW-254). Sample and binder ratio (5:1) was then mixed to homogenize with each other. Prior to palletizing all parts of the die set were carefully cleaned with methylated spirit to prevent contamination. Each mixed sample was poured into the mould of 32 mm diameter and pressed to the required pressure by using hydraulic press machine (PP-25, Retsh). In this work the pressure of 20 tons was used and pressing time was 5 minutes for each pellet. Then the powder pellet samples were obtained to analyze by XRF method without any chemical pre-treatment. Fig. (3) Salt Production Work Fig. (4) Salt @ IJTSRD | Unique Paper ID – IJTSRD26771 | Volume – 3 | Issue – 5 | July - August 2019 Page 1722
International Journal of Trend in Scientific Research and Development (IJTSRD) @ www.ijtsrd.com eISSN: 2456-6470 All the prepared pellets were put into the sample changer. Sample identification and changer number were carefully recorded. All of the pellet samples were analyzed 300 sec for each filter. The elemental concentrations contained in soil samples were determined by energy dispersive method. Calculation of Metal Pollution Index (MPI) and Enrichment Factor (EF) Metal pollution index (MPI) was computed to determine overall trace elements concentrations in different soils analyzed. This index was obtained by calculating the geometrical mean of concentrations of all the metals in Metal Pollution Index (MPI) =(Cf1× Cf2× Cf3×…. × Cfn)1/n (1) Where Cfn is concentration of metal in n in the sample. ?? = Where (X/N)sample is the ratio of the concentration of metal X to major metal Fe or Al in the sample. (X/N)reference is the ratio of the concentration of the metal X to major metal Fe or Al in a reference material. Both aluminum (Al) and iron (Fe) can be used as the metal for normalization because their anthropogenic sources are small compared to natural sources (Herlz, 1976). The contamination factor of metals in the sample, and it can be calculated by ?? = ?????? ???? . According to EDXRF result, enrichment factor (EF) of an element in the studied samples was based on the measured element against a reference element. A reference material is used as iron. The enrichment factor (EF) is used to assess the degree of pollution. Generally, the values of the enrichment factor below evaluate the level of impartation of the soil by the metals. EF≤1 No enrichment EF<2 Minimal enrichment EF 2 – 5 Moderate enrichment EF 5 – 20 Significant enrichment EF > 40 Extremely high enrichment. Results and Discussion The Metal Pollution Index (MPI) and Enrichment Factor (EF) for measured sodic soil samples are presented in Table (3) and (4). The comparison graph of metal pollution index (MPI) and enrichment factor (EF) were shown in Fig. (6) and (7). Concentrations differ greatly between rock types, and because soil properties are influenced by their parent material, concentrations in soils also vary greatly. ?????? ???? Metal pollution index (MPI) is suggested to be a reliable and precise method for metal pollution monitoring of irrigation areas (Ureso et al. 1997). The Metal pollution index (MPI) of each element was classified as low (MPI≤1), middle (1≤MPI≤3) or high (MPI>5). Enrichment factor (EF) can be used to differentiate between the metal originating from anthropogenic activities and those from natural procedure the enrichment factor as stated below; X X N sample Enrichment Factor (EF) (2) reference N Table (3) Metal pollution index (MPI) of soil from salt production area Sample Name Metal pollution index (MPI) TKT-1 TKT-2 HL-1 HL-2 STG PL Table (4) The Enrichment Factor (EF) of some elements Element TKT-1 TKT-2 HL-1 K 0.428 0.364 0.877 Ca 6.520 5.332 36.493 37.339 18.272 21.490 Ti 1.924 1.919 1.835 Cr 0.889 0.852 1.177 Mn 3.158 3.219 5.491 Ni 0.178 0.171 0.199 Zn 0.859 0.824 1.138 Rb 0.180 0.173 0.239 Sr 1.215 1.165 5.122 Zr 0.214 0.273 0.283 0.234 0.267 0.452 0.269 0.387 0.399 HL-2 1.627 STG 0.596 PL 2.631 3.647 2.693 5.519 0.171 0.961 0.421 4.633 0.998 2.347 1.718 3.306 0.193 0.720 0.116 2.131 0.735 2.888 2.274 5.386 0.168 2.199 0.308 1.507 1.095 @ IJTSRD | Unique Paper ID – IJTSRD26771 | Volume – 3 | Issue – 5 | July - August 2019 Page 1723
International Journal of Trend in Scientific Research and Development (IJTSRD) @ www.ijtsrd.com eISSN: 2456-6470 Fig.(6) The comparison graph of Metal Pollution Index (MPI) Fig.(7) The comparison graph of the Enrichment Factor (EF) for some elements According to Table (4.2), the highest value of metal pollution index (MPI) is found in HL-1 and the lowest value is TKT-1. It is seen that the values of metal pollution index (MPI) for all samples was less than 1. This indicating the sodic soil was no significant of metal pollution. The enrichment factor (EF) of Ni, Rb and Zr was found to be less than 1 which shows that the samples are deficiency to minimal enrichment. The enrichment factor (EF) of K, Ti, Cr, Zn, and Sr was found to be less than 5 (within 2-5) which show that the samples were moderate enrichment. The enrichment factor (EF) of Mn is 5 (within 2-5) which show that the samples were significant enrichment and Ca is greater than 20, which show that the samples were extremely high enrichment. It is seen that Mn and Ca show considerable enriched levels in the soil. Conclusion According to the results obtained, it was found that the concentration of calcium (Ca) is significantly different from those of other elements contained in the analyzed sodic soil samples. The concentration in other sample is natural permissible limit. According to health physics point of view, the results of elemental analysis, the cumulative and summative effects of metals are not believed to play a significant role in the toxicity and pollution in the soil. Human beings have been using salt since time unrecorded in history as a part of his and his animal’s food. In today’s world, beside such uses, it has obtained a position of one of the most important industrial raw material. Therefore, a reasonable salt production rate should be selected when we use saline soils. To precise the elemental distribution of the sodic soil samples from salt production area, the samples should be analyzed seasonally and regionally. Acknowledgements The authors are would like to express my deepest appreciation to Dr Win Swe, Rector, Dr Myo Myo, Pro-rector, Shwebo University for their kind permission and encouragement in writing this paper. We are also sincerely grateful to Prof. Dr Min Swe, Head of Department of Physics, and, Prof. Dr Khin Hnin Ei, Department of Physics, Shwebo University, for their encouragement. References [1]K. H. Northcote, JKM Skene, “Australian soils with saline and sodic properties”. Division of Soils Soil Publication, Australia, (1972). [2]“Different Types of Salts”, (http://en.wikipedia.org/ wiki/x-ray fluorescence). [3]G.F. Knoll, "Radiation Detection and Measurement", John Wiley & Sons, Inc., USA (1979). [4]"X-Ray Fluorescence", wiki/x-ray fluorescence). (http://en.wikipedia.org/ @ IJTSRD | Unique Paper ID – IJTSRD26771 | Volume – 3 | Issue – 5 | July - August 2019 Page 1724