Download
1 / 3
30 likes | 34 Views
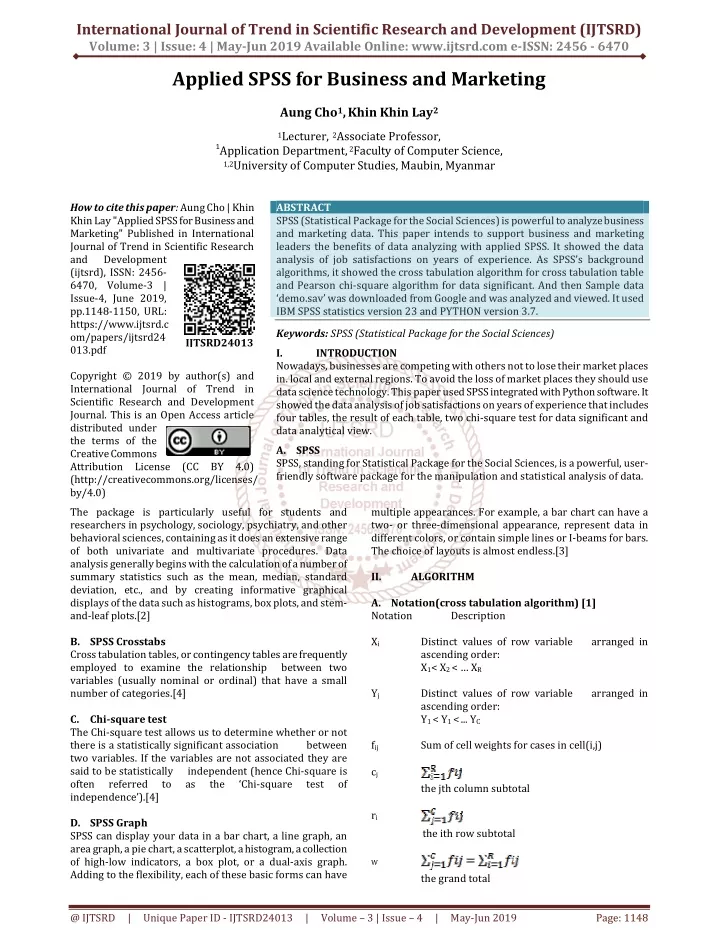
SPSS Statistical Package for the Social Sciences is powerful to analyze business and marketing data. This paper intends to support business and marketing leaders the benefits of data analyzing with applied SPSS. It showed the data analysis of job satisfactions on years of experience. As SPSS's background algorithms, it showed the cross tabulation algorithm for cross tabulation table and Pearson chi square algorithm for data significant. And then Sample data 'demo.sav' was downloaded from Google and was analyzed and viewed. It used IBM SPSS statistics version 23 and PYTHON version 3.7. Aung Cho | Khin Khin Lay "Applied SPSS for Business and Marketing" Published in International Journal of Trend in Scientific Research and Development (ijtsrd), ISSN: 2456-6470, Volume-3 | Issue-4 , June 2019, URL: https://www.ijtsrd.com/papers/ijtsrd24013.pdf Paper URL: https://www.ijtsrd.com/computer-science/data-miining/24013/applied-spss-for-business-and-marketing/aung-cho<br>

E N D
International Journal of Trend in Scientific Research and Development (IJTSRD) Volume: 3 | Issue: 4 | May-Jun 2019 Available Online: www.ijtsrd.com e-ISSN: 2456 - 6470 Applied SPSS for Business and Marketing Aung Cho1,Khin Khin Lay2 1Lecturer, 2Associate Professor, 1Application Department, 2Faculty of Computer Science, 1,2University of Computer Studies, Maubin, Myanmar How to cite this paper: Aung Cho | Khin Khin Lay "Applied SPSS for Business and Marketing" Published in International Journal of Trend in Scientific Research and Development (ijtsrd), ISSN: 2456- 6470, Volume-3 | Issue-4, June 2019, pp.1148-1150, URL: https://www.ijtsrd.c om/papers/ijtsrd24 013.pdf Copyright © 2019 by author(s) and International Journal of Trend in Scientific Research and Development Journal. This is an Open Access article distributed under the terms of the Creative Commons Attribution License (CC BY 4.0) (http://creativecommons.org/licenses/ by/4.0) The package is particularly useful for students and researchers in psychology, sociology, psychiatry, and other behavioral sciences, containing as it does an extensive range of both univariate and multivariate procedures. Data analysis generally begins with the calculation of a number of summary statistics such as the mean, median, standard deviation, etc., and by creating informative graphical displays of the data such as histograms, box plots, and stem- and-leaf plots.[2] B.SPSS Crosstabs Cross tabulation tables, or contingency tables are frequently employed to examine the relationship between two variables (usually nominal or ordinal) that have a small number of categories.[4] C.Chi-square test The Chi-square test allows us to determine whether or not there is a statistically significant association between two variables. If the variables are not associated they are said to be statistically independent (hence Chi-square is often referred to as the independence’).[4] D.SPSS Graph SPSS can display your data in a bar chart, a line graph, an area graph, a pie chart, a scatterplot, a histogram, a collection of high-low indicators, a box plot, or a dual-axis graph. Adding to the flexibility, each of these basic forms can have ABSTRACT SPSS (Statistical Package for the Social Sciences) is powerful to analyze business and marketing data. This paper intends to support business and marketing leaders the benefits of data analyzing with applied SPSS. It showed the data analysis of job satisfactions on years of experience. As SPSS’s background algorithms, it showed the cross tabulation algorithm for cross tabulation table and Pearson chi-square algorithm for data significant. And then Sample data ‘demo.sav’ was downloaded from Google and was analyzed and viewed. It used IBM SPSS statistics version 23 and PYTHON version 3.7. Keywords: SPSS (Statistical Package for the Social Sciences) I. INTRODUCTION Nowadays, businesses are competing with others not to lose their market places in. local and external regions. To avoid the loss of market places they should use data science technology. This paper used SPSS integrated with Python software. It showed the data analysis of job satisfactions on years of experiencethat includes four tables, the result of each table, two chi-square test for data significant and data analytical view. A.SPSS SPSS, standing for Statistical Package for the Social Sciences, is a powerful, user- friendly software package for the manipulation and statistical analysis of data. IJTSRD24013 multiple appearances. For example, a bar chart can have a two- or three-dimensional appearance, represent data in different colors, or contain simple lines or I-beams for bars. The choice of layouts is almost endless.[3] II. ALGORITHM A.Notation(cross tabulation algorithm) [1] Notation Description Xi Distinct values of row variable arranged in ascending order: X1< X2 < … XR Yj Distinct values of row variable arranged in ascending order: Y1 < Y1 <... YC fij cj Sum of cell weights for cases in cell(i,j) ‘Chi-square test of the jth column subtotal ri the ith row subtotal W the grand total @ IJTSRD | Unique Paper ID - IJTSRD24013 | Volume – 3 | Issue – 4 | May-Jun 2019 Page: 1148
International Journal of Trend in Scientific Research and Development (IJTSRD) @ www.ijtsrd.com eISSN: 2456-6470 B.Marginal and Cell Statistics [1] count III. A.Job Satisfactions on Years of Experience SPSS Code CROSSTABS /TABLES=empcat BY jobsat /FORMAT=AVALUE TABLES /STATISTICS=CHISQ /CELLS=COLUMN BPROP /COUNT ROUND CELL /BARCHART. TABLE.I YEARS WITH CURRENT EMPLOYER* JOB SATISFACTION CROSS TABULATION Years of Experience Highly satisfied Less than 5 5 to 15 More than 15 Total TABLE.II CHI-SQUARE TESTS TESTING = Expected Count = row percent column percent total percent C.cross tabulation algorithm [1] Residual Standardized Residual = 100 x ( ) = 100 x ( ) = 100 x ( ) 9.2%e 33.8%c 57.0%e 100.0% Adjusted Residual Asymptotic Significance (2-sided) .000 .000 Value df D.Pearson’s Chi-square(cross tabulation algorithm) [1] Pearson Chi-Square Likelihood Ratio Linear-by-Linear Association N of Valid Cases 1689.561a 1747.380 8 8 = 1525.767 1 .000 The degree of freedom are (R-1) (C-1) Likelihood Ratio The degree of freedom are (R-1) (C-1) Note: when fij, the entire term fij ln(fij/Eij) is treated as 0, because and thus has no effect on the sum. Fisher’s Exact Test If the table is a 2x2 table, not resulting from a larger table with missing cells, then the Fisher exact test is calculated. For more information, see the topic “Significance Levels for Fisher’s Exact Test” on p. 1037. Yates Continuity Corrected for 2 x 2 Tables 6400 Bar Chart-1: Years with current employer * Job satisfaction , if otherwise The degrees of freedom are 1. >0.5W @ IJTSRD | Unique Paper ID - IJTSRD24013 | Volume – 3 | Issue – 4 | May-Jun 2019 Page: 1149
International Journal of Trend in Scientific Research and Development (IJTSRD) @ www.ijtsrd.com eISSN: 2456-6470 B.Data analytical view: As a result of table-1 and bar chart-1, more years of experience, higher job satisfaction. Years of experience and job satisfaction are direct correlation and real association. As a result of table-2, p-value is less than 0.05, so variables are significantly variance. In the business, employees with more experience should share the knowledge and happiness to employees with lower experience. Business leader and owners should award promotion and bonus to all tried employees in the end of the year to get more job satisfactions. C.Job Satisfactions on Most Years of Experience and income level If the control variable ‘income level’ was added on test 3.1 condition, the result was found as the following. TABLE.III MOST YEARS WITH CURRENT EMPLOYER* JOB SATISFACTION *INCOME LEVELCROSS TABULATION More than 15 Years Income Level Highly satisfied Under $25 $25-$49 $50-$74 $75+ Total Bar Chart-2: Years with current employer * Job satisfaction * Income level TABLE.IV CHI-SQUARE TESTS 5.6% 8.7% 16.9% 68.8% 100.0% D.Data analytical view: As a result of table-3 and bar chart-2, higher income, higher job satisfaction. Income level and job satisfaction are direct correlation and real association. As test-3.1 and test-3.2, if there is more job satisfactions, employers have more experience and more income. As a result of table-4, p-value is less than 0.05, so variables are significantly variance. IV. CONCLUSION SPSS data analysis tools are valuable in social science, business and marketing fields. It is very good for presentation report by graphical design. Business leaders can get their goal with good result and can avoid the loss of market places in local and global regions by using SPSS software. References [1]IBM SPSS Statistics 24 Algorithms pdf book [book style] [2] A handbook of statistical analyses using SPSS / Sabine, Landau, Brian S. Everitt, ISBN 1-58488-369-3 [book style] [3]SPSS For Dummies®, 2nd Edition, ISBN: 978-0-470- 48764-8 [book style] [4]SPSS for Social Scientists Robert L. Miller, Ciaran Acton, Deirdre A. Fullerton and John Maltby, ISBN 0–333– 92286–7 [book style] @ IJTSRD | Unique Paper ID - IJTSRD24013 | Volume – 3 | Issue – 4 | May-Jun 2019 Page: 1150