Download
1 / 9
90 likes | 93 Views
Present study aims to identify the most dominating factors in rural school education in an Indian state, West Bengal, to investigate the impact of those factors on overall satisfaction level in rural school education system in West Bengal. In this regard a descriptive research is performed to identify the factors of importance to rural people for pursuing education. Reliability Test has been done checking internal consistency of data, Principal Component Analysis is used to identify major factors, Confirmatory Factor Analysis is applied to frame a model hypothesised on the factors to check the goodness of fit of the model, ANOVA and Two Way MANOVA along with Regression Analysis is executed to investigate their influence level and to frame an equation on the basis of the same. Then an overall framework has been established with the help of the findings of the above analysis for Governmental policy implementation. Dr. Dipa Mitra "An Analytical Framework on Perceived Satisfaction with Present Status of Rural School Education in an Indian State" Published in International Journal of Trend in Scientific Research and Development (ijtsrd), ISSN: 2456-6470, Volume-2 | Issue-1 , December 2017, URL: https://www.ijtsrd.com/papers/ijtsrd5858.pdf Paper URL: http://www.ijtsrd.com/management/organizational-behaviour/5858/an-analytical-framework-on-perceived-satisfaction-with-present-status-of--rural-school-education-in-an-indian-state/dr-dipa-mitra<br>

E N D
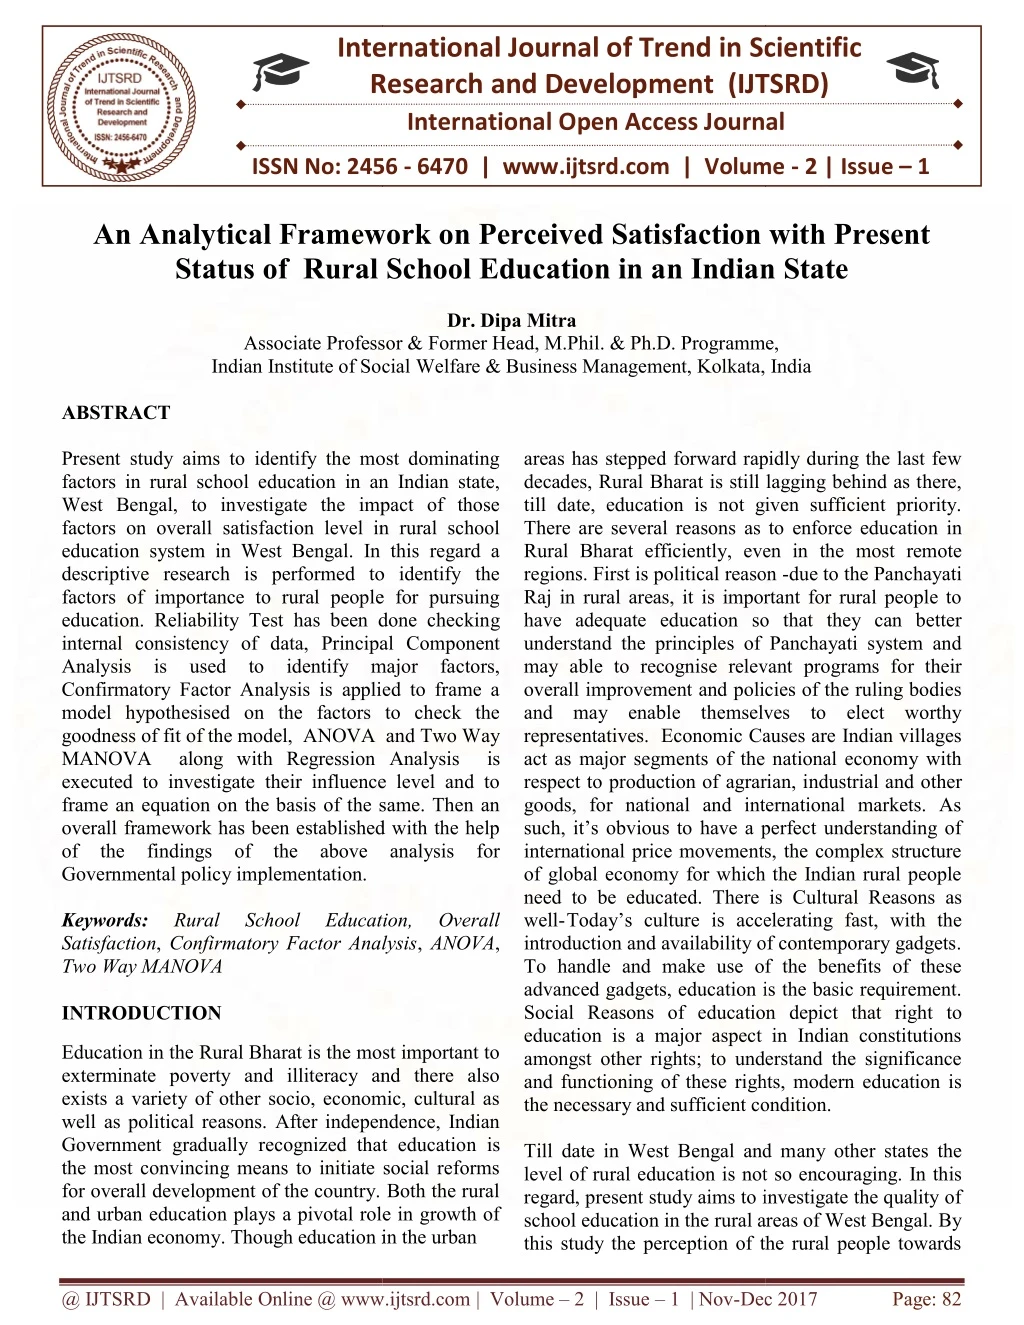
International Research Research and Development (IJTSRD) International Open Access Journal An Analytical Framework on Perceived Satisfaction of Rural School Education in an Indian State International Journal of Trend in Scientific Scientific (IJTSRD) International Open Access Journal ISSN No: 2456 ISSN No: 2456 - 6470 | www.ijtsrd.com | Volume | www.ijtsrd.com | Volume - 2 | Issue – 1 An Analytical Framework o Status of Rural School Education in a n Perceived Satisfaction with Present n Indian State Dr. Dipa Mitra Associate Professor & Former Head, M.Phil. & Ph.D. Programme, Indian Institute of Social Indian Institute of Social Welfare & Business Management, Kolkata, India Welfare & Business Management, Kolkata, India Associate Professor & Former Head, M.Phil. & Ph.D. Programme, Associate Professor & Former Head, M.Phil. & Ph.D. Programme, areas has stepped forward rapidly during the last few decades, Rural Bharat is still lagging behind as there, till date, education is not given sufficient priority. There are several reasons as to enforce education in Rural Bharat efficiently, even in the regions. First is political reason Raj in rural areas, it is important for rural people to have adequate education so that they can better understand the principles of Panchayati system and may able to recognise relevant overall improvement and policies of the ruling bodies and may enable themselves to elect worthy representatives. Economic Causes are Indian villages act as major segments of the national economy with respect to production of agrarian, i goods, for national and international markets. As such, it’s obvious to have a perfect understanding of international price movements, the complex structure of global economy for which the Indian rural people need to be educated. There well- Today’s culture is accelerating fast, with the introduction and availability of contemporary gadgets. To handle and make use of the benefits of these advanced gadgets, education is the basic requirement. Social Reasons of education depict that right to education is a major aspect in Indian constitutions amongst other rights; to understand the significance and functioning of these rights, modern education is the necessary and sufficient condition. Till date in West Bengal and m level of rural education is not so encouraging. In this regard, present study aims to investigate the quality of school education in the rural areas of West Bengal. By this study the perception of the rural people towards this study the perception of the rural people towards ABSTRACT Present study aims to identify the most dominating factors in rural school education in an Indian state, West Bengal, to investigate the impact of those factors on overall satisfaction level in rural school education system in West Bengal. In this regard a descriptive research is performed to identify the factors of importance to rural people for pursuing education. Reliability Test has been done checkin internal consistency of data, Principal Component Analysis is used to identify major factors, Confirmatory Factor Analysis is applied to frame a model hypothesised on the factors to check the goodness of fit of the model, ANOVA and Two Way MANOVA along with Regression executed to investigate their influence level and to frame an equation on the basis of the same. Then an overall framework has been established with the help of the findings of the above analysis for Governmental policy implementation. Keywords: Rural School Satisfaction, Confirmatory Factor Analysis Two Way MANOVA INTRODUCTION Present study aims to identify the most dominating factors in rural school education in an Indian state, West Bengal, to investigate the impact of those ll satisfaction level in rural school education system in West Bengal. In this regard a descriptive research is performed to identify the factors of importance to rural people for pursuing education. Reliability Test has been done checking areas has stepped forward rapidly during the last few decades, Rural Bharat is still lagging behind as there, till date, education is not given sufficient priority. There are several reasons as to enforce education in Rural Bharat efficiently, even in the most remote regions. First is political reason -due to the Panchayati Raj in rural areas, it is important for rural people to have adequate education so that they can better understand the principles of Panchayati system and may able to recognise relevant programs for their overall improvement and policies of the ruling bodies and may enable themselves to elect worthy representatives. Economic Causes are Indian villages act as major segments of the national economy with respect to production of agrarian, industrial and other goods, for national and international markets. As such, it’s obvious to have a perfect understanding of international price movements, the complex structure of global economy for which the Indian rural people need to be educated. There is Cultural Reasons as Today’s culture is accelerating fast, with the introduction and availability of contemporary gadgets. To handle and make use of the benefits of these advanced gadgets, education is the basic requirement. tion depict that right to education is a major aspect in Indian constitutions amongst other rights; to understand the significance and functioning of these rights, modern education is the necessary and sufficient condition. Principal Component Analysis is used to identify major factors, Confirmatory Factor Analysis is applied to frame a model hypothesised on the factors to check the goodness of fit of the model, ANOVA and Two Way MANOVA along with Regression Analysis is executed to investigate their influence level and to frame an equation on the basis of the same. Then an overall framework has been established with the help of the findings of the above analysis for Rural Confirmatory Factor Analysis, ANOVA, School Education, Education, Overall Overall Education in the Rural Bharat is the most important to exterminate poverty and illiteracy and there also exists a variety of other socio, economic, cultural as well as political reasons. After independence, Indian Government gradually recognized that educa the most convincing means to initiate social reforms for overall development of the country. Both the rural and urban education plays a pivotal role in growth of the Indian economy. Though education in the urban the Indian economy. Though education in the urban Education in the Rural Bharat is the most important to exterminate poverty and illiteracy and there also exists a variety of other socio, economic, cultural as After independence, Indian Government gradually recognized that education is the most convincing means to initiate social reforms for overall development of the country. Both the rural and urban education plays a pivotal role in growth of Till date in West Bengal and many other states the level of rural education is not so encouraging. In this regard, present study aims to investigate the quality of school education in the rural areas of West Bengal. By @ IJTSRD | Available Online @ www.ijtsrd.com @ IJTSRD | Available Online @ www.ijtsrd.com | Volume – 2 | Issue – 1 | Nov-Dec 2017 Dec 2017 Page: 82
International Journal of Trend in Scientific Research and Development (IJTSRD) ISSN: 2456-6470 education and the factors that led them to join and continue with the education can be analysed. The tendency of a common rural individual’s perspective towards education is reflected by this study. A support from government can not only lead to development of growth of education in rural India but also our country’s overall development. LITERATURE REVIEW A comparative study is also done to differentiate in the condition between the facilities that the urban students are getting as compared to rural. OBJECTIVES 1.To identify the most dominating factors in rural school education in West Bengal 2.To investigate the impact of those factors on overall satisfaction level in rural school education system in West Bengal 3.To develop a framework on overall satisfaction level in rural school education system on the basis of those significant factors by establishing their association which implementation. METHODOLOGY A questionnaire is designed to gather data from the 359 rural people from all over the state to identify the factors that are of prime concern to them for sending their children to schools. A descriptive research is done to identify the factors of importance to rural people for pursuing education. RELIABILITY TEST has been done checking internal consistency of COMPONENT ANALYSIS is used to identify major factors, CONFIRMATORY FACTOR ANALYSIS is applied to frame a model hypothesised on the factors to check the goodness of fit of the model, ANOVA is used to observe the effect of school and environmental factors on overall satisfaction, TWO WAY MANOVA is applied to check the relation between two major ANALYSIS is performed on the major factors identified to investigate their influence level and to frame an equation on the basis of the same. Then an overall model has been established with the help of the findings of the above analysis. DATA ANALYSIS: Michael L. Arnold, John H. Newman, Barbara B. Gaddy, and Ceri B. Dean(2005) conducted a study on secondary data on rural education research of 12 years in U.S.A. in order to identify the quality of rural research. Of the total 106 papers only 10 papers were considered as high quality research papers and 48 were considered as substandard papers. AbrishamAref and KhadijehAref(2012) performed a research on the education system prevailing in the rural areas of Iran. The major barriers found out to be lack of understanding of education system at the national level, the very bad shape of rural schools and scarcity of infrastructural facilities. The findings suggested that main hindrance may be eliminated if government can implement better education laws. Niraj Kumar Roy (2012) studied identified that there are not sufficient number of rural schools available in India but government is taking steps so that enough schools are available for providing rural education. The study demonstrated that the number of rural schools is increasing in India. Sunny Rawat , AshishChettri (2013) conducted a research in the rural areas of Darjeeling regarding the quality of education and observed that it is growing gradually . The government’s role in providing free education to the students up to 14 years is magnificent. Teachers are motivating the people to send their children to schools but still there are a lot of problems which needed to be improvised to increase the quality of education and life. Nitu Konwar & Subhadeep Chakraborty (2013) researched on the gross enrolment ratio in rural areas for higher education and found that the GER is very poor in rural areas especially in case of females. The source of problems has been identified and steps are suggested to improvise the ratio. J.G. Sreekanthachari and G. Nagaraja (2013) studied to identify the role of education in our country especially in rural sector and tried to discuss the present scenario of education in rural areas , the difference between rural and urban education , the problems faced in rural area and steps taken by the government to improve their condition. may help in policy data, PRINCIPAL factors, REGRESSION RELIABILITY ANALYSIS Table 1: Reliability Statistics Cronbach's Alpha .748 The Cronbach’s Alpha value of .748 reflects a good internal consistency to proceed with the analysis. N of Items 15 @ IJTSRD | Available Online @ www.ijtsrd.com | Volume – 2 | Issue – 1 | Nov-Dec 2017 Page: 83
International Journal of Trend in Scientific Research and Development (IJTSRD) ISSN: 2456-6470 INTERPRETAION OF PRINCIPLE COMPONENT ANALYSIS: Table 2: KMO and Bartlett's Test Kaiser-Meyer-Olkin Measure of Sampling Adequacy. Bartlett's Test of Sphericity df Sig. Here, from the perspective of Barlett's test of spericity, factor analysis is significant and feasible as p value is .000 i.e. less than .05. As Bartlett's test is significant, a more discriminating index of factor analyzability is the KMO. For this data set, KMO value is .883 (very close to 1.0), which is very high, so the KMO also supports factor analysis. FACTOR IDENTIFICATION: Determination based on eigenvalues: In this approach, only those factors with eigenvalues greater than 1 are considered. Other factors are not included in this model. Here, from the SCREE PLOT and the table TOTAL VARIANCE EXPLAINED, 2 factors can be identified whose eigenvalues are more than 1. Determination based on percentage of variance: The number of factors extracted can also be determined in a way so that the cumulative percentage of variance extracted by the factors reaches a satisfactory level. Here according to the analysis, the cumulative percentage of variance extracted by the 2 CONFIRMATORY FACTOR ANALYSIS .883 2478.459 91 .000 Approx. Chi-Square factors is 63.256 %( from the table TOTAL VARIANCE EXPLAINED), satisfactory. FACTOR INTERPRETATION: Factor interpretation is facilitated by identifying the variables that have large loading on the same factor. That factor can be interpreted in terms of variables that load high on it. In the ROTATED COMPONENT MATRIX, Factor 1 has high coefficients .818 for variables Books, .782 for Interaction with Teachers and .711 for Syllabus which are renamed as school factor. Factor 2 has high coefficients .854 for variables Discipline, .735 for Uniform and .698 for Extracurricular Activities which are renamed as Environmental factors As factor 1 is treated as principal component, so, in this case, school factor is the most significant factor followed by the Environmental factorwith respect Rural School Education. which is quite Figure 1: CFA Result (Default model) Minimum was achieved , Chi-square = 66.741 Degrees of freedom = 8 Probability level = .000 @ IJTSRD | Available Online @ www.ijtsrd.com | Volume – 2 | Issue – 1 | Nov-Dec 2017 Page: 84
International Journal of Trend in Scientific Research and Development (IJTSRD) ISSN: 2456-6470 Table 3: Model Fit Summary CMIN Model Default model Saturated model Independence model 6 RMR, GFI Model Default model Saturated model Independence model .400 Baseline Comparisons Model NPAR CMIN 13 21 DF P 8 0 CMIN/DF 66.741 .000 1339.259 15 .000 4.343 .000 89.284 RMR GFI .040 .000 AGFI PGFI .892 .959 1.000 .467 .365 .334 .254 NFI Delta1 .950 1.000 RFI rho1 .907 .000 IFI Delta2 .956 1.000 .000 TLI rho2 .917 .000 CFI .956 1.000 .000 Default model Saturated model Independence model .000 RMSEA Model RMSEA LO HI 90 .149 .440 PCLOSE 90 .095 .402 .001 .421 .000 .000 Default model Independence model This model indicates a good fit. The CMIN table shows a value of less than .5 indicating a good fit for the model. The GFI shows an acceptable value of .more than .95. The NFI and CFI score (.950 and .956 respectively) also indicates a good fit of the model. ANOVA 1: To Test the Impact of School Factors on Overall Satisfaction The RMSEA value of (.001) confirms a good fit of the hypothesised model. This shows minimum difference between the sample covariance and the original covariance of the model. Table 4: ANOVA 1 Levene's Test of Equality of Error Variances Dependent Variable:OVERALL SATISFACTION F df1 df2 356.379 3 495 Tests the null hypothesis that the error variance of the dependent variable is equal across groups. Design: Intercept + interactionteachers Tests of Between-Subjects Effects Dependent Variable:OVERALLSATISFACTION Source Sig. .000 Type III Sum of Squares 131.145a 1587.598 131.145 35.793 4994.000 166.938 df 3 1 3 495 499 498 Mean Square F 43.715 1587.598 43.715 .072 Sig. .000 .000 .000 Corrected Model Intercept Interaction with teachers Error Total Corrected Total a. R Squared = .786 (Adjusted R Squared = .784) 604.552 21955.592 604.552 @ IJTSRD | Available Online @ www.ijtsrd.com | Volume – 2 | Issue – 1 | Nov-Dec 2017 Page: 85
International Journal of Trend in Scientific Research and Development (IJTSRD) ISSN: 2456-6470 By performing ANOVA of interaction of teachers on the overall satisfaction level . The F Ratio of 604.552 with 3,495 df differ significantly. This shows that there exists a significant difference between means of school factors and overall satisfaction. From the post Hoc analysis it can be seen that there are 4 groups which differ significantly. From the outputit can be interpretted that as the parents interaction with teachers increases the overall satisfaction also increases. ANOVA 2 : To Test the Impact Of Environmental Factors On Over All Satisfaction Table 5: ANOVA 2 Levene's Test of Equality of Error Variancesa Dependent Variable:OVERALLSATISFACTION F df1 df2 Sig. 19.828 8 490 .000 Tests the null hypothesis that the error variance of the dependent variable is equal across groups. a. Design: Intercept + environmentalfactors Tests of Between-Subjects Effects Dependent Variable :OVERALLSATISFACTION Source Type III Sum of Squares df Corrected Model 20.274a 8 Intercept 3434.696 1 Environmental factors 20.274 8 Error 146.664 490 Total 4994.000 499 Corrected Total 166.938 498 a. R Squared = .121 (Adjusted R Squared = .107) Mean Square 2.534 3434.696 2.534 .299 F 8.467 11475.190 .000 8.467 Sig. .000 .000 By looking at the Levene’s test of equality table it can be interpreted that it is significant and the assumption of equality has been violated. By performing ANOVA of interaction of teachers on the overall satisfaction level . The F Ratio of 8.467 with 8,490 df differ significantly. This shows that there exists a significant difference between means of environmental factors and overall satisfaction. TWO WAY MANOVA Table 6: Levene's Test of Equality of Error Variancesa F Books 51.718 Teachers 15.073 Syllabus 29.458 Interaction with teachers 91.697 Tests the null hypothesis that the error variance of the dependent variable is equal across groups. df1 221 221 221 221 df2 277 277 277 277 Sig. .000 .000 .000 .000 @ IJTSRD | Available Online @ www.ijtsrd.com | Volume – 2 | Issue – 1 | Nov-Dec 2017 Page: 86
International Journal of Trend in Scientific Research and Development (IJTSRD) ISSN: 2456-6470 a.Design: Intercept + infrastructure + discipline + uniform + staff + hygeine + classrooms + extracuricular + foodprogramme + accessibilitytotheschool + anualhealthprogramme Table 7: Multivariate Table Value .855 685.814a .145 685.814a 5.899 685.814a 5.899 685.814a .058 2.291 .943 2.303 .060 2.311 .045 5.240b .062 2.476 .938 2.490 .065 2.500 .047 5.521b .084 3.358 .918 3.369 .087 3.369 .054 6.278b .068 2.711 .933 2.736 .071 2.756 .057 6.674b .145 5.910 .860 5.992 .156 6.040 .104 12.198b .058 2.315 .942 2.338 .061 2.357 .052 6.111b .053 2.118 .947 2.144 .056 2.166 .052 6.127b .143 5.850 .862 5.929 .155 5.972 .097 11.271b .087 3.494 .915 3.507 .091 3.509 .053 6.226b .106 4.267 .897 4.290 .111 4.296 .068 7.954b Effect Pillai's Trace Wilks' Lambda Hotelling's Trace Roy's Largest Root F Hypothesis df 4.000 4.000 4.000 4.000 12.000 12.000 12.000 4.000 12.000 12.000 12.000 4.000 12.000 12.000 12.000 4.000 12.000 12.000 12.000 4.000 12.000 12.000 12.000 4.000 12.000 12.000 12.000 4.000 12.000 12.000 12.000 4.000 12.000 12.000 12.000 4.000 12.000 12.000 12.000 4.000 12.000 12.000 12.000 4.000 Error df 465.000 465.000 465.000 465.000 1401.000 1230.566 1391.000 467.000 1401.000 1230.566 1391.000 467.000 1401.000 1230.566 1391.000 467.000 1401.000 1230.566 1391.000 467.000 1401.000 1230.566 1391.000 467.000 1401.000 1230.566 1391.000 467.000 1401.000 1230.566 1391.000 467.000 1401.000 1230.566 1391.000 467.000 1401.000 1230.566 1391.000 467.000 1401.000 1230.566 1391.000 467.000 Sig. .000 .000 .000 .000 .007 .007 .006 .000 .003 .003 .003 .000 .000 .000 .000 .000 .001 .001 .001 .000 .000 .000 .000 .000 .000 .000 .000 .000 .000 .000 .000 .000 .000 .000 .000 .000 .000 .000 .000 .000 .000 .000 .000 .000 Intercept Infrastructure Pillai's Trace Wilks' Lambda Hotelling's Trace Roy's Largest Root Pillai's Trace Wilks' Lambda Hotelling's Trace Roy's Largest Root Pillai's Trace Wilks' Lambda Hotelling's Trace Roy's Largest Root Pillai's Trace Wilks' Lambda Hotelling's Trace Roy's Largest Root Pillai's Trace Wilks' Lambda Hotelling's Trace Roy's Largest Root Pillai's Trace Wilks' Lambda Hotelling's Trace Roy's Largest Root Discipline Uniform Staff hygeine classrooms Extra-curricular Pillai's Trace Wilks' Lambda Hotelling's Trace Roy's Largest Root food programme Pillai's Trace Wilks' Lambda Hotelling's Trace Roy's Largest Root Pillai's Trace Wilks' Lambda Hotelling's Trace Roy's Largest Root Pillai's Trace Wilks' Lambda Hotelling's Trace Roy's Largest Root Accessibilitytoth eschool Annual healthprogramm e @ IJTSRD | Available Online @ www.ijtsrd.com | Volume – 2 | Issue – 1 | Nov-Dec 2017 Page: 87
International Journal of Trend in Scientific Research and Development (IJTSRD) ISSN: 2456-6470 a. Exact statistic b. The statistic is an upper bound on F that yields a lower bound on the significance level. c. Design: Intercept + infrastructure + discipline + uniform + staff + hygeine + classrooms + extracuricular + foodprogramme + accessibilitytotheschool + anualhealthprogramme By examining the multivariate table it can be seen that Wilks’ Lambda row showing a significant value (p<0.05) of .17. By looking at the significance level of all the factors it can be said that environmental factors and school factors has a significantly effecting each other. In each of the case Wilk’sLamda is interpreting almost 90% of the effect on each other. REGRESSION ON ALL FACTORS EXTRACTED FROM PRINCIPAL COMPONENT ANALYSIS: Table 8: Regression Table Model Summary Model R R Square Square the Estimate Adjusted R Std. Error of Change Statistics R Square Change .730 F Change 222.095 df1 df2 Sig. F Change dimension0 1 .855a .730 a. Predictors: (Constant), discipline, syllabus, interactionwithteachers, books, uniform, extra-curricular .727 .302 6 492 .000 Coefficientsa Model Unstandardized Coefficients Standardized Coefficients Collinearity Statistics Correlations Zero- order B 1.340.078 -.017 .019 .437 .024 -.040 .019 Std. Error Beta -.027 -.069 -.061 .041 .881 -.071 t 17.274 .000 -.892 -1.551 .122 .161 -2.065 .039 -.051 1.408 .160 .303 33.034 .000 .837 -1.595 .111 .139 Sig. PartialPart -.040 -.021 -.070 -.036 -.093 -.048 .063 .033 .830 .773 -.072 -.037 Tolerance .585 .280 .624 .653 .770 .277 VIF 1.710 3.571 1.602 1.533 1.299 3.607 1(Constant) uniform Extra-curricular books Interactionwithteachers.532 .017 syllabus discipline a. Dependent Variable: OVERALLSATISFACTION A regression analysis is done on the major factors extracted by factor analysis to find its impact on the overall satisfaction level. It can be seen that there exist a significant impact of interaction with teachers and extra- curricular activities in assessing the overall satisfaction level. It is observed from the table that interaction with teachers (53.2%) and extracurricular activities(43.7%) are the most dominating factors influencing overall satisfaction level with respect to education which corroborates with the result of factor analysis. So the regression equation can be drawn as : OVERALL SATISFACTION = 1.340 + 0.532 Interaction with Teachers +0.437 Extra-curricular Activities .373 .073 .032 .022 -.038 .024 @ IJTSRD | Available Online @ www.ijtsrd.com | Volume – 2 | Issue – 1 | Nov-Dec 2017 Page: 88
International Journal of Trend in Scientific Research and Development (IJTSRD) ISSN: 2456-6470 PROPOSED MODEL ON THE FACTORS INFLUENCING THE SATISFACTION LEVEL OF RURAL SCHOOL EDUCATION IN WEST BENGAL Figure 2 satisfaction of the villagers and simultaneously they are also affecting each other. Moreover, in field survey, face to face interaction reveals that they are becoming more aware of the improvement in education systems that are been taken place in the urban societies. Most of the villagers have expressed that they want their children to get out of the backward life they are leading for ages. Government has started many schools and night schools for the children as well as adults of different remote villages of our country. The villagers are now trying to utilise these resources fully and to get maximum benefitted from these plans. They now understanding the need of education and they are looking forward to educate their children from the schools set up by government. But for this they want more empathetic teachers with whom they and their wards may interact freely. Moreover, the little kids of village are more prone to extracurricular activities like sports and cultural programs than monotonous school routine. So if government is taking adequate steps and providing them with funds and infrastructure they will also prosper as the people in urban areas do. Thus this research lays the foundation for future investigation on the satisfaction level in Indian rural school education. One desired step may be to scale up the research by expanding the target area through including more state wise and nation wise comparison to evaluate and benchmark their perception level with the help of perceptual mapping and GAP analysis. CONCLUSION From the study it can be assessed that the perception of rural people towards education is changing in a rapid space.in this regard the study is significant as the villagers are now becoming more concern about the type of books their children are reading and they want their children to lead a more disciplined life. The study indicates the communication system like mobiles and television; they are becoming well informed about the latest developments and technologies result of which some of them are able to understand the importance of school education for sustaining. According to Principal Component Analysis there are total six factors which influence the villagers most to send their children the school. They are Books, Interaction with Teachers and Syllabus which are renamed as school factor; Discipline, Uniform and Extracurricular Activities which are renamed as Environmental factors. Anova test the impact of school factors and environmental factors on overall satisfaction. Two Way Manova depicts that these environmental factors and school factors are significantly effecting each other. Multiple Regression is showing that they are mainly interested in communicating with the teachers and their children’s extracurricular activities. From the aforementioned proposed model illustrates that the significant factors determining the satisfaction level of rural school education in West Bengal. As the model suggests that both the school factors as well as environmental factors are influencing the overall introduction of latest @ IJTSRD | Available Online @ www.ijtsrd.com | Volume – 2 | Issue – 1 | Nov-Dec 2017 Page: 89
International Journal of Trend in Scientific Research and Development (IJTSRD) ISSN: 2456-6470 5)Marchand-Martella, N., Martella, R. C., Orlob, M., & Ebey, T. (2000). Conducting action research in a rural high school setting using peers as corrective reading instructors for students with disabilities. Rural Special Education Quarterly, 19(2), 20-30. Further, efficiency- productivity study of the rural schools may also be carried out with the help of Data Envelopment Analysis crossing the border of the nation and finally after a benchmarking study, Scenario and Causal analysis may be executed using Bayesian Probabilistic Network for Governmental policy implementation. REFERENCES 6)McGranahan, D. A., & Ghelfi, L. M. (1998). Current trends in the supply and demand for education in rural and urban areas. In R. M. Gibbs, 1)Arnold, M. L., Newman, J. H., Gaddy, B. B., & Dean, C. B. (2005, April 27). A look at the condition of rural education research: Setting a difference for future research. Journal of Research in Rural Education, 20(6). Retrieved [date] from http://jrre.psu.edu/articles/20-6.pdf 7)P. L. Swaim, & R. Teixeira (Eds.), Rural education and training in the new rural economy: The myth of the rural skills gap (pp. 131-171). Ames, IA: Iowa State University Press. 8)Roy Niraj K. (2012) ICT–Enabled Rural Education in India International Journal of Information and Education Technology, Vol. 2, No. 5, October 2012 2)Aref and Aref (2012)The barriers of educational development in rural areas of Iran. Indian Journal of Science and Technology.Vol. 5 No. 2 (Feb 2012) ISSN: 0974- 6846 9)Rawat, Chettri(2013), A Study on Rural Education in Darjeeling. International Journal of Science and Research (IJSR) ISSN (Online): 2319-7064 3)Konwar & Chakraborty (2013) Status of Higher Education in Rural Areas of India, A Journal of Radix International Educational and Research Consortium. Volume 2, Issue 1 (January 2013) ISSN: 2250 – 3994 10)Sreekanthachari overview of rural education in India. ADVANCE RESEARCH JOURNAL OF SOCIAL SCIENCE Volume 4 | Issue 1 | June, 2013 | 115-119 and Nagaraja (2013) An 4)Lee, V. E., Smerdon, B. A., Alfeld-Liro, C., & Brown, S. L. (2000). Inside large and small high schools: Curriculum Educational Evaluation & Policy Analysis, 22(2), 147-171. and social relations. @ IJTSRD | Available Online @ www.ijtsrd.com | Volume – 2 | Issue – 1 | Nov-Dec 2017 Page: 90