Download
1 / 5
50 likes | 63 Views
This research is the analysis of computer based simulation design for the semiconductor laser diode. The paper is emphasized by analyzing the band structure and voltage current characteristics of AlGaAs GaAs for the laser diode. In this paper, bandgap variation temperature dependence, voltage current V I , band diagram of the p n junction for laser diode are discussed briefly. On the other hand, this paper is emphasized band structure design and voltage current calculation using the mathematical model. The AlGaAs GaAs device technology is used for high speed optical communication. Thu Rein Ye Yint Win | Tin Tin Hla "Simulation and Analysis of III-V Characteristic and Bandgap Design for Heterojunction Laser Diode" Published in International Journal of Trend in Scientific Research and Development (ijtsrd), ISSN: 2456-6470, Volume-3 | Issue-5 , August 2019, URL: https://www.ijtsrd.com/papers/ijtsrd26542.pdf Paper URL: https://www.ijtsrd.com/engineering/electronics-and-communication-engineering/26542/simulation-and-analysis-of-iii-v-characteristic-and-bandgap-design-for-heterojunction-laser-diode/thu-rein-ye-yint-win<br>

E N D
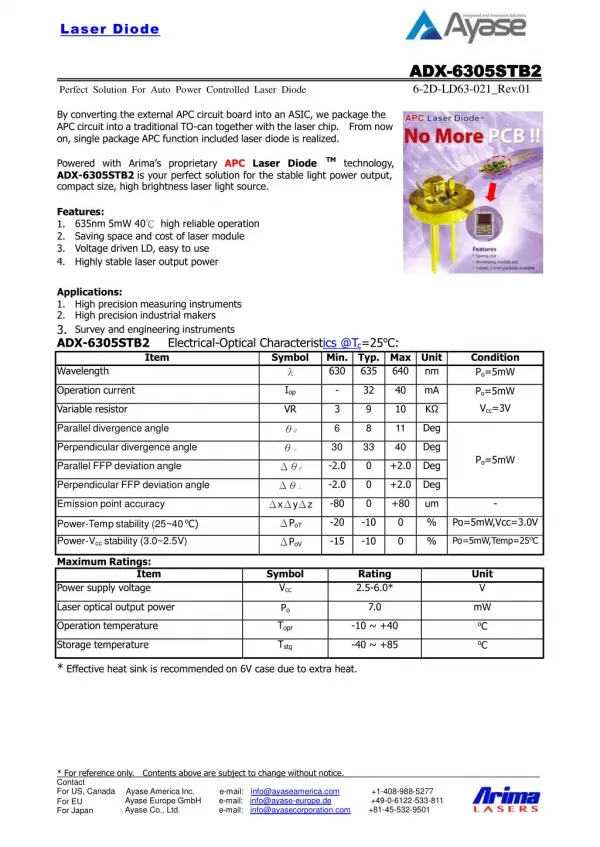
International Journal of Trend in Scientific Research and Development (IJTSRD) Volume 3 Issue 5, August 2019 Available Online: www.ijtsrd.com e-ISSN: 2456 – 6470 Simulation and Analysis of III-V Characteristic and Bandgap Design for Heterojunction Laser Diode Thu Rein Ye Yint Win, Tin Tin Hla Department of Electronic Engineering, Mandalay Technological University, Mandalay, Myanmar How to cite this paper: Thu Rein Ye Yint Win | Tin Tin Hla "Simulation and Analysis of III-V Characteristic and Bandgap Design for Heterojunction Laser Diode" Published in International Journal of Trend in Scientific Research and Development (ijtsrd), ISSN: 2456- 6470, Volume-3 | Issue-5, August 2019, pp.996-1000, https://doi.org/10.31142/ijtsrd26542 Copyright © 2019 by author(s) and International Journal of Trend in Scientific Research and Development Journal. This is an Open Access article distributed under the terms of the Creative Commons Attribution License (CC (http://creativecommons.org/licenses/by /4.0) The laser diodes are fabricated using direct band-gap semiconductors. The laser diode epitaxial structure is grown using one of the crystal grown techniques, usually starting from an N doped substrate, and growing the I doped active layer, followed by the P doped cladding, and a contact layer. The active layer most often consists of quantum wells, which provide lower threshold current and higher efficiency [2]. Optimization of the device design is usually done by computer simulation, and this must be based upon the physical processes which actually occur in the devices and have to use experimental results for material parameters. The band structures of semiconductors materials for p- GaAs/N-AlGaAs, and n-GaAs/N-AlGaAs are discussed with figures. The Fermi level will line up to be a constant across the junction under thermal equilibrium conditions without any voltage bias when the two crystals are in contact [3]. II. THEORETICAL CONCEPTS FOR BAND DESIGN The density of the electrons (i.e., the numbers of electrons per unit volume) in an intrinsic semiconductor is evaluated in an incremental energy range. This density of the electrons dne with energy E distributed over the energy interval is comprised of the density of states and the distribution function, which defines the occupation of the electrons states dE E f E N dne ) ( ) ( = The distribution function which satisfies electrons distribution conditions is the Fermi distribution ABSTRACT This research is the analysis of computer-based simulation design for the semiconductor laser diode. The paper is emphasized by analyzing the band structure and voltage-current characteristics of AlGaAs/GaAs for the laser diode. In this paper, bandgap variation temperature dependence, voltage- current (V-I), band diagram of the p-n junction for laser diode are discussed briefly. On the other hand, this paper is emphasized band structure design and voltage-current calculation using the mathematical model. The AlGaAs/GaAs device technology is used for high-speed optical communication. KEYWORDS: Band structure design, Voltage Current, Bandgap, Temperature effect, Computer-based simulation I. INTRODUCTION Semiconductor devices emit laser light when an electric current is applied to the P-N junction of a compound semiconductor. The semiconductor laser is a type of diode that combines the electrical properties of a diode with properties that produce laser light and are also called “laser diodes”. A laser diode is a semiconductor device similar to a light-emitting diode (LED). The term laser originated as an acronym: Light Amplification by Simulated Emission of Radiation. Laser diode uses p-n junction to emit coherent light in which all the waves are at the same frequency and phase [1]. IJTSRD26542 BY 4.0) Where, k is the Boltzmann constant, T is the absolute temperature in degrees Kelvin, and EF is the energy of the Fermi level. For states with E<<EF, f(E) = 1,so that the states are completely occupied. Conversely, for f(E) = 0, states with E>>EF are not occupied. Half of the states with E=EF are occupied. In order to determine the density of states as a function of the electron energy, the relationship between momentum and energy must be known. In order that no current flows in the equilibrium state, an equal number of states must be occupied in any arbitrary direction at positive and negative momentum. Since the states are equidistant in momentum space, we conclude that the energy must be an even function of the momentum. The number of states between E and EC ( ) 3 3 h Where EC is the conduction band, h is the Planck constant 6.582x10⁻¹⁶eVs and me* is called the effective mass of the electrons. The number of electrons in the conduction band per unit volume of the crystal, n is given by ( ) kT E E C e N n = Where NC is a constant at fixed T known as the effective density of states in the conduction band. ( ) 3 2 =π * e 8 2 V m ( ) 3 2 − N E E E C (3) (1) − (4) F C 1 − kT = ( ) f E E E + exp 1 F @ IJTSRD | Unique Paper ID – IJTSRD26542 | Volume – 3 | Issue – 5 | July - August 2019 Page 996
International Journal of Trend in Scientific Research and Development (IJTSRD) @ www.ijtsrd.com eISSN: 2456-6470 Similarly, the total number of holes in the valence band per unit volume of the crystal, p is given by ( ) kT E E V e N p = Where NV is the effective density of states in the valence band III. NUMERICAL MODEL In this research, two regions of p- and n-type semiconductor materials are analyzed by changing the doping concentration. The band-edge discontinuities of types are varied with the type of semiconductor materials. The following block diagram is the procedure of band structure analysis. Firstly, the effective masses of electron and hole are set to find the effective density of states of conduction and valence band of different materials depending on the various temperature. In order to determine the density of states as a function of the electron energy, we need the relationship between momentum and energy which for electrons in a crystal might be quite different from that for a free electron. The density of state in the conduction band is 2 3 * 2 2 h Where, NC is the density of state in the conduction band, me* is the effective mass of electrons, k is the Boltzmann’s constant=8.854 the Plank’s constant=6.582 temperature) 2 3 * 19 300 m The density of state in the valence band is 2 3 * 19 300 m In heterojunction structure, the two semiconductors are assumed to have different energy bandgap, different dielectric permittivity εs, different work function qφs, and different electron affinities qχ. The work function is defined as the energy is required to remove an electron from Fermi level EF to a position just outside the material (the vacuum level). The electron affinity is the energy required to remove an electron from the bottom of the conduction band E to the vacuum level. The difference in energy of the conduction band edges in the two semiconductors is represented by ΔEC, and the difference in energy in the valence band edges is represented by ΔEV. [4] From Fig.1, ΔEC, and ΔEV can be expressed by ( ) 2 1 χ χ − = ∆ q EC ( 1 1 2 2 χ χ q E q E E g g V + − + = ∆ The different bandgap energy is E E E − = ∆ (11) 2 1 g g g − (5) V F Figure1. Energy band diagram of two isolated semiconductors The Fermi level for both p-type and n-type materials is given by C N Where ND is donor concentration. N (12) − = − ln E E kT D C F N (13) − = − ln E E kT A F V N V π m kT (6) = e N Where NA is acceptor concentration. The intrinsic-carrier concentration is C 2 (14) The barrier potential is and h is (15) ) . T=300K (room The width of the depletion region is (16) m T (7) = × e . 2 51 10 N C 0 (17) m T (8) (18) = × h . 2 51 10 N V 0 Minority carriers diffusion coefficients, carrier lifetimes kT D , , µ = (19) n p n p q (20) Electron and hole diffusion lengths D L , , , τ = Saturation current density (21) n p n p n p (22) (9) (23) ) (10) @ IJTSRD | Unique Paper ID – IJTSRD26542 | Volume – 3 | Issue – 5 | July - August 2019 Page 997
International Journal of Trend in Scientific Research and Development (IJTSRD) @ www.ijtsrd.com eISSN: 2456-6470 B.The band structure of n-GaAs / P- AlxGa1-xAs TABLE 2 PARAMETERS FOR n-GAAS /P-ALXGA1-XAS STRUCTURE Electron effective mass, Hole effective mass, Set , , , , , q, , T,ε, Calculate the carriers concentration & energy levels n-GaAs 0.665 x=0.3 0.5 x=0.3 1.424Ev at 300K 13.1ε0 At x=0.3 Nd = 4x1018 cm-3 2.13 cm-3 P-AlGaAs 0.914 x=0.3 0.587 x=0.3 1.798 eV at 300K 12.2ε0 At x=0.3 NA = 2x1017 cm-3 2.2 cm-3 1.44V 0.238 at at Calculate the band-edge discontinuities at at Calculate the barrier potential Energy Bandgap, Dielectric constant, ε Calculate the intrinsic-carrier concentration Acceptor & donor concentration, Intrinsic-Carrier Concentration , Barrier potential, Width of depletion , Fermi Level Calculate the width of depletion layer C.V-I Characteristics of p-GaAs / N- AlxGa1-xAs Draw the band diagram of specified materials Figure2. The Procedure of band diagram design Figure3. The Determination of V-I Characteristics IV. MATERIAL PARAMETER FOR ALGAAS/GAAS CELL A.The band structure of p-GaAs/ N- AlxGa1-xAs TABLE 1 PARAMETERS FOR P-GAAS / N-ALXGA1-XASSTRUCTURE Electron effective mass, Hole effective mass, TABLE 3 PARAMETERS FOR p-GAAS /N-ALXGA1-XAS STRUCTURE Set acceptor and donor concentration Intinsic concentration, Calculate the intrinsic concentration Hole and elecron mobilities Calculate the electron and hole motilities Diffusion coefficients and life times Diffusion coefficient Carrier life time Calculate the electron and hole diffusion length Hole and elecron diffusion length Saturation current Calculate the saturation current density for PN 9.42 A D.V-I Characteristics of n-GaAs / P- AlxGa1-xAs TABLE 4 PARAMETERS FOR n-GAAS /P-ALXGA1-XAS STRUCTURE Intinsic concentration, p-GaAs 0.665 at x=0.3 0.5 at x=0.3 1.424 eV at 300K 13.1ε0 At x=0.3 Na = 1x1018 cm-3 2.13 cm-3 N-AlGaAs 0..914 at x=0.3 0.587 at x=0.3 1.798 eV at 300K 12.2ε0 At x=0.3 ND = 2x1017 cm-3 2.2 cm-3 1.53V 0.11 Hole and elecron mobilities Diffusion coefficient Energy Bandgap, Carrier life time Hole and elecron diffusion length Saturation current Dielectric constant, ε Acceptor & donor concentration, Intrinsic-Carrier Concentration , Barrier potential, Width of depletion 6.98 A V. A.Band-gap energy as a function of Temperature TEST AND RESULTS @ IJTSRD | Unique Paper ID – IJTSRD26542 | Volume – 3 | Issue – 5 | July - August 2019 Page 998
International Journal of Trend in Scientific Research and Development (IJTSRD) @ www.ijtsrd.com eISSN: 2456-6470 Where Eg = band-gap energy, T and β = fitting parameters (frequently called the Varshni parameters) Figure4. shows the width of the bandgap for GaAs, InP, Si and Ge as the function of temperature. = temperature (K) D.V-I Characteristics of p-GaAs / N- AlxGa1-xAs Figure 7 shows the V-I characteristics curve and the the current equation is I= Figure7. V-I Characteristics of p-GaAs/N-AlGaAs E.V-I Characteristics of n-GaAs / P- AlxGa1-xAs Figure 8 shows the V-I characteristics curve and the the current equation is I= Figure4. The energy gap with temperature B.The band structure of p-GaAs / N- AlxGa1-xAs Figure 5 shows the band diagram of P- and N-type semiconductor materials that are doped Figure8. V-I Characteristics of n-GaAs/P-AlGaAs CONCLUSION The above process is band structure design analysis of AlGaAs/GaAs materials and is based on mathematical equations of semiconductor theory. Figure 4 shows the width of bandgap for GaAs, InP,Si and Ge as the function of temperature. GaAs decrease from 1.424 eV at 300K to the 1.06 eV at 1000K. InP is slightly decrease from 1.36 eV at 300K to 1.08 eV at 1000K. The bandgap energy can vary to different values as the changing of temperature. the energy band structures of (n-GaAs/P-AlGaAs) and (p-GaAs/N- AlGaAs) for laser diode have been drawn in figure 5 and 6. For the energy band of heterostructure, the conduction band is 61.4meV (n-GaAs/P-AlGaAs), 32.2meV (p-GaAs/N-AlGaAs) close to the Fermi level than the valence band. When using a laser diode it is essential to know its performance characteristics. The laser diode specification for the forward voltage across the diode is required in a number of areas of the design. From figure 7 and 8, it can be seen that the voltage across the laser diode in around 1.5 volts. A laser diode is normally operated by applying fixed voltage because Figure5. Band structure of p-GaAs/N-AlGaAs C.The band structure of n-GaAs/ P- AlxGa1-xAs Figure 6 shows the PN junction band diagram that used for GaAs as n-type material and AlGaAs as P-type material. VI. Figure6. Band structure of n-GaAs/P-AlGaAs @ IJTSRD | Unique Paper ID – IJTSRD26542 | Volume – 3 | Issue – 5 | July - August 2019 Page 999
International Journal of Trend in Scientific Research and Development (IJTSRD) @ www.ijtsrd.com eISSN: 2456-6470 the flow of current could depend on that voltage and affected by device temperature. The development of the device with the help of computerized analysis will be observed the physical properties and characteristics of the AlGaAs/GaAs that are used in semiconductor laser diodes. ACKNOWLEDGEMENTS The author would like to express special thanks to Dr. Tin Tin Hla for her valuable suggestion, supervision, encouragement and sharing her experience to write this research. And also, the author is also thankful to all of his teachers from Department of Electronic Engineering, Mandalay Technological University. REFERENCES [1]H. C. Casey, Jr ., and M. B. Panish, Heterostructure Lasers,Part A: Fundamental Principles, Academic Press, Orlando,1978 [2]H. C. Casey, Jr., and M. B. Panish, Heterostructure Lasers, PartB: Materials and Operating Characteristics, Academic Press,Orlando, 1978. [3]H. Kressel and J. K. Butler, Semiconductor Lasers and Heterojunction LEDs, Academic Press, New York, 1977. [4]S. E. Miller and I. Kaminow (eds.), Optical Fiber Telecommunications, Academic Press, Orlando, 1988. [5]S. M. SZE,. “Semiconductor Devices Physics and Technology”, 2nd edition, 2002. @ IJTSRD | Unique Paper ID – IJTSRD26542 | Volume – 3 | Issue – 5 | July - August 2019 Page 1000