Download
1 / 4
40 likes | 45 Views
Data Science is a field that uses algorithms, scientific methods and system to extract knowledge. It also uses various techniques from mathematics, statistics, computer science and information science. It has various application like Recommender Systems, Image Recognition, Speech Recognition, Gaming, Airline Route Planning, Fraud and Risk Detection, Delivery Logistics. The entire digital marketing spectrum. Starting from the display banners on various websites to the digital bill boards at the airports almost all of them are decided by using data science algorithms. Deepak Chahal | Shivam Goel | Atanu Maity "Data Science Applications, Challenges and Related Future Technology" Published in International Journal of Trend in Scientific Research and Development (ijtsrd), ISSN: 2456-6470, Volume-3 | Issue-1 , December 2018, URL: https://www.ijtsrd.com/papers/ijtsrd19166.pdf Paper URL: http://www.ijtsrd.com/computer-science/data-miining/19166/data-science-applications-challenges-and-related-future-technology/deepak-chahal<br>

E N D
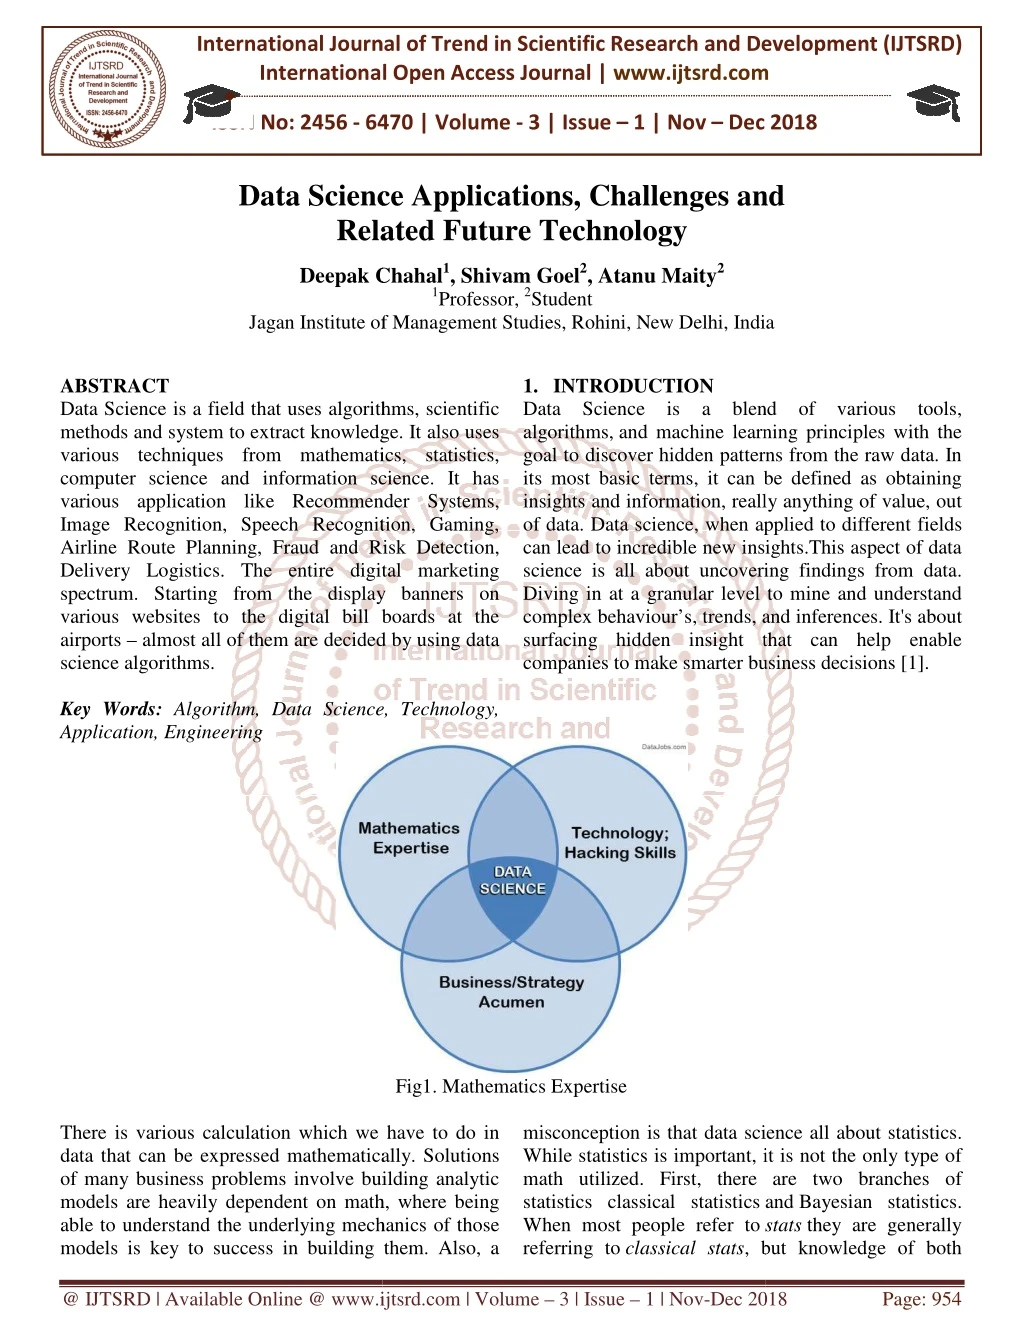
International Journal of Trend in International Open Access Journal International Open Access Journal | www.ijtsrd.com International Journal of Trend in Scientific Research and Development (IJTSRD) Research and Development (IJTSRD) www.ijtsrd.com ISSN No: 2456 - 6470 6470 | Volume - 3 | Issue – 1 | Nov – Dec 2018 Dec 2018 Data Science Applications, Challenges Related Future Technology Related Future Technology ience Applications, Challenges and nd Deepak Chahal Deepak Chahal1, Shivam Goel2, Atanu Maity2 1Professor, 2Student f Management Studies, Rohini, New Delhi, India Jagan Institute of India ABSTRACT Data Science is a field that uses algorithms, scientific methods and system to extract knowledge. It also uses various techniques from mathematics, statistics, computer science and information science. It has various application like Recommender Systems, Image Recognition, Speech Recognition, Gaming, Airline Route Planning, Fraud and Risk Detection, Delivery Logistics. The entire digital marketing spectrum. Starting from the display ba various websites to the digital bill boards at the airports – almost all of them are decided by using data science algorithms. Key Words: Algorithm, Data Science, Technology, Application, Engineering 1.INTRODUCTION Data Science is a blend of various tools, algorithms, and machine learning principles with the goal to discover hidden patterns from the raw data. In its most basic terms, it can be defined as obtaining insights and information, really anything of value, out of data. Data science, when applied to different fields can lead to incredible new insights. science is all about uncovering findings from data. Diving in at a granular level to mine and understand complex behaviour’s, trends, and inferenc surfacing hidden insight that can help enable companies to make smarter business Data Science is a field that uses algorithms, scientific methods and system to extract knowledge. It also uses various techniques from mathematics, statistics, formation science. It has various application like Recommender Systems, Image Recognition, Speech Recognition, Gaming, Airline Route Planning, Fraud and Risk Detection, Delivery Logistics. The entire digital marketing spectrum. Starting from the display banners on various websites to the digital bill boards at the almost all of them are decided by using data Science is a blend of various tools, and machine learning principles with the goal to discover hidden patterns from the raw data. In its most basic terms, it can be defined as obtaining insights and information, really anything of value, out data. Data science, when applied to different fields can lead to incredible new insights.This aspect of data science is all about uncovering findings from data. Diving in at a granular level to mine and understand complex behaviour’s, trends, and inferences. It's about surfacing hidden insight that can help enable companies to make smarter business decisions [1]. Algorithm, Data Science, Technology, Fig1. Mathematics Expertise There is various calculation which we have to do in data that can be expressed mathematically. Solutions of many business problems involve building analytic models are heavily dependent on math, where being able to understand the underlying mechanics of those models is key to success in building them. models is key to success in building them. Also, a various calculation which we have to do in mathematically. Solutions many business problems involve building analytic models are heavily dependent on math, where being able to understand the underlying mechanics of those misconception is that data science all about statistics. While statistics is important, it is not the only type of math utilized. First, there are two branches of misconception is that data science While statistics is important, it is not the only type of math utilized. First, there are two branches of statistics classical statistics When most people refer to referring to classical stats, but knowledge of both , but knowledge of both and Bayesian statistics. stats they are generally @ IJTSRD | Available Online @ www.ijtsrd.com www.ijtsrd.com | Volume – 3 | Issue – 1 | Nov-Dec 2018 Dec 2018 Page: 954
International Journal of Trend in Scientific Research and Development (IJTSRD) ISSN: 2456 International Journal of Trend in Scientific Research and Development (IJTSRD) ISSN: 2456 International Journal of Trend in Scientific Research and Development (IJTSRD) ISSN: 2456-6470 types is helpful. Furthermore, many inferential techniques and machine learning algorithm knowledge of linear algebra. Overall, it is helpful for data scientists to have breadth and depth in their knowledge of mathematics. 2.Technology and Hacking Here we're referring to the tech programmer implies how to think and produce solution creativity and ingenuity in using technical skills to build things and find clever solutions to problems. Data scientists utilize technology in order to wrangle enormous data sets and work with complex algorithms, and it requires tools far more sophisticated than Excel. Data scientists need to be able to code prototype quick solutions, as well as integrate with complex data systems [2]. Core languages associated with data science include SQL, Python, R, and SAS. On the periphery are Java, Scala, Julia, and others. But it is not just knowing language fundamentals. Along these lines, a data science hacker is a solid algorithmic thinker, having the ability to break down messy problems and recompose them in ways that are solvable. This is critical because data scientists operate within a lot of algorithmic complexity. They need to have a strong mental comprehension of high-dimensional data and tricky data control flows. Full clarity on how all the pieces come together to form a cohesive solution. 3.Standardising Data Science Our main problem is the lack of standardisation regarding procedures and techniques. Coming out of education and moving into the industry you can find yourself with knowledge of various methods and approaches, but no clear guide on best practices. science still largely remains an endeavour largely based on intuition and personal experience. In other disciplines there are standards quality of the final result. Data science is closer to software engineering, where the lack of physical components means there are smaller construction costs, and considerably more room to experiment and try different things out[3]. 4.The Data Science Tools 4.1 R Programming R is a programming language and software environment for statistical representation and reporting. R is freely available under the GNU General Public License, under the GNU General Public License, and pre- many inferential compiled binary versions are provided for various operating systems like Linux, Windows and Mac.This programming language was named R, based on the first letter of first name of the two R authors (Robert compiled binary versions are provided for various operating systems like Linux, Windows and Mac.This programming language was named first letter of first name of the two R authors (Robert Gentleman and Ross Ihaka). R allows integration the procedures written in the C, C++, .Net, Python or FORTRAN languages for efficiency 4.2 SQL SQL is a database computer language designed for retrieval and management of data in a relational database. SQL stands for Structured Query Language. This tutorial will give you a quick start to SQL. It covers most of the topics required for a basic understanding of SQL and to get a feel of how it works.SQL is the standard language for Relational Database System. All the Relational Database Management Systems (RDMS) like MySQL, MS Access, Oracle, Sybase, Informix, Postgres and SQL Server use SQL as their standard database language. 4.3 Python Python is a high-level, interpreted, interactive and object-oriented scripting language. Python is designed to be highly readable. It uses English keywords frequently where as other languages use punctuation, and it has fewer syntactical constructions than other languages. 4.4 Hadoop Hadoop is an open-source framework that allows to store and process big data in a distributed environment across clusters of computers using simple programming models. It is designed to scale up from single servers to thousands of machines, each offering local computation and storage. frame-worked application works i that provides distributed storage and computation across clusters of computers [4] 4.5 Sas SAS is a powerful business intelligence and analytical tool. It is a software suite for extracting, analysing and reporting on a wide range of data and derive valuable business insights from it. It includes a whole set of tools for working across the various steps of converting data into business insights 5.Data Mining After the objectives have been defined it’s time to start gathering the data. it’s time to start gathering the data. techniques and machine learning algorithms lean on . Overall, it is helpful for and depth in their . R allows integration with the procedures written in the C, C++, .Net, Python or languages for efficiency e're referring to the tech programmer we how to think and produce solution – i.e., creativity and ingenuity in using technical skills to build things and find clever solutions to problems. SQL is a database computer language designed for the retrieval and management of data in a relational database. SQL stands for Structured Query Language. This tutorial will give you a quick start to SQL. It covers most of the topics required for a basic understanding of SQL and to get a feel of how it rks.SQL is the standard language for Relational Database System. All the Relational Database Management Systems (RDMS) like MySQL, MS Access, Oracle, Sybase, Informix, Postgres and SQL Server use SQL as their standard database language. in order to wrangle mous data sets and work with complex ols far more sophisticated Excel. Data scientists need to be able to code — prototype quick solutions, as well as integrate with . Core languages associated data science include SQL, Python, R, and SAS. On the periphery are Java, Scala, Julia, and others. But it is not just knowing language fundamentals. es, a data science hacker is a , having the ability to break down messy problems and recompose them in ways that are solvable. This is critical because data e within a lot of algorithmic complexity. They need to have a strong mental dimensional data and tricky data control flows. Full clarity on how all the pieces come together to form a cohesive solution. level, interpreted, interactive and oriented scripting language. Python is designed to be highly readable. It uses English keywords frequently where as other languages use punctuation, and it has fewer syntactical constructions than other source framework that allows to data in a distributed ain problem is the lack of standardisation regarding procedures and techniques. Coming out of education and moving into the industry you can find knowledge of various methods and approaches, but no clear guide on best practices. Data ence still largely remains an endeavour largely based on intuition and personal experience. environment across clusters of computers using simple programming models. It is designed to scale up from single servers to thousands of machines, each local computation and storage. A Hadoop worked application works in an environment that provides distributed storage and computation 4]. In other disciplines there are standards to ensure the quality of the final result. Data science is closer to software engineering, where the lack of physical nents means there are smaller construction costs, and considerably more room to experiment and SAS is a powerful business intelligence and analytical tool. It is a software suite for extracting, analysing and a wide range of data and derive valuable business insights from it. It includes a whole set of tools for working across the various steps of ing data into business insights. R is a programming language and software environment for statistical analysis, analysis, R is freely available graphics After the objectives have been defined in a project, @ IJTSRD | Available Online @ www.ijtsrd.com www.ijtsrd.com | Volume – 3 | Issue – 1 | Nov-Dec 2018 Dec 2018 Page: 955
International Journal of Trend in Scientific Research and Development (IJTSRD) ISSN: 2456 International Journal of Trend in Scientific Research and Development (IJTSRD) ISSN: 2456 International Journal of Trend in Scientific Research and Development (IJTSRD) ISSN: 2456-6470 Data mining is the process of gathering the different sources. Some people tend to group data retrieval and cleaning together. At this stage, some of the questions worth considering are - what need for my project? Where does it live? How can I obtain it? What is the most efficient way to store and access all of it?If all the data necessary for the project is packaged and handed to you, you’ve won the lottery. More often than not, finding the right data takes both time and effort. If the data lives in databases, your job is relatively simple - you can query the relevant data using SQL queries, or manipulate it using a data frame tool like Pandas. However, if your data doesn’t actually exist in a dataset, you’ll need to scrape it. Beautiful Soup is a popular library used to pages for data. If you’re working with a mobile app and want to track user engagement and interactions, there are countless tools that can be integrated w the app so that Google Analytics, for example, allows you to define custom events within the app which can help you understand how your users behave and collect the corresponding data. 6.Data Cleaning Now that you’ve got all of your data, we move on to the most time-consuming step of all – preparing the data. This is especially true in big data projects, which often involve terabytes of data to work with. According to interviews with data s process (also referred to as ‘data janitor work’) can often take 50 to 80 percent of their time. So what exactly does it entail, and why does it take so long? The reason why this is such a time consuming process is simply because there are so many possible scenarios that could necessitate cleaning. For instance, the data could also have inconsistencies within the same column, meaning that some rows could be labelled 0 or 1, and others could be labelled no or yes. The data types could also be inconsistent - some of the 0s might integers, whereas some of them could be strings. If we’re dealing with a categorical data type with multiple categories, some of the categories could be misspelled or have different cases, such as having both male and Male. One of the steps that is often forgotten in this stage, causing a lot of problems later on, is the presence of missing data. Missing data can throw a lot of errors in missing data. Missing data can throw a lot of errors in is the process of gathering the data from the model creation and training. One option is to either ignore the instances which have any missing the model creation and training. One option is to either ignore the instances which have values. 7.Data Exploration Now that you’ve got a sparkling clean set of data, you’re ready to finally get started in exploration stage is like the brainstorming of data analysis. This is where you understand the patterns and bias in your data. It could involve pulling up and analyzing a random subset of the data using Pandas, plotting a histogram or distribution curve to see the general trend, or even creating an interactive visualization that lets you dive down into each data point and explore the story behind the Using all of this information, you can hypotheses about your data and the tackling. If you were predicting student scores for example, you could try visualizing the relationship between scores and sleep. If you were predicting real estate prices, you could perhaps heat map on a spatial plot to see if you can catch any trends. 8.Feature Engineering In machine learning, a feature is a measurable property or attribute of a phenomenon being observed. If we were predicting the scores of a student, a possible feature is the amount of more complex prediction tasks such as character recognition, features could be histograms counting the number of black pixels. Feature engineering is the process of using domain knowledge to transform your raw data into informative features that represent the business problem you are trying to solve. This directly influence the accuracy of the predictive model you construct in the next stage. We two types of tasks in feature engineering selection and construction. Feature process of cutting down the features that add more noise than information. Feature construction involves creating new features from the ones that you already have (and possibly ditching the old ones). For example, if you have a feature for age, but your model only cares about if a person is an adult or minor, yo 18, and assign different categories to instances above and below that threshold. to group data . At this stage, some of what data do I need for my project? Where does it live? How can I obtain it? What is the most efficient way to store and access all of it?If all the data necessary for the project is packaged and handed to you, you’ve won the Now that you’ve got a sparkling clean set of data, to finally get started in analysis. The data exploration stage is like the brainstorming of data analysis. This is where you understand the patterns and bias in your data. It could involve pulling up and analyzing a random subset of the data using Pandas, stribution curve to see the general trend, or even creating an interactive visualization that lets you dive down into each data point and explore the story behind the outliers. nding the right data takes both time and effort. If the data lives in databases, your job you can query the relevant data queries, or manipulate it using a data frame tool like Pandas. However, if your data doesn’t exist in a dataset, you’ll need to scrape it. up is a popular library used to scrape web pages for data. If you’re working with a mobile app and want to track user engagement and interactions, there are countless tools that can be integrated within Google Analytics, for example, allows you to define custom events within the app which can help you understand how your users behave and all of this information, you can start to form hypotheses about your data and the problem you are tackling. If you were predicting student scores for example, you could try visualizing the relationship between scores and sleep. If you were predicting real estate prices, you could perhaps plot the prices as a heat map on a spatial plot to see if you can Now that you’ve got all of your data, we move on to In machine learning, a feature is a measurable property or attribute of a phenomenon being observed. If we were predicting the scores of a student, a possible feature is the amount of sleep they get. In more complex prediction tasks such as character gnition, features could be histograms counting the – cleaning and preparing the data. This is especially true in big data projects, which often involve terabytes of data to work interviews with data scientists, this process (also referred to as ‘data janitor work’) can often take 50 to 80 percent of their time. So what exactly does it entail, and why does it take so long? The reason why this is such a time consuming process Feature engineering is the process of using domain knowledge to transform your raw data into informative features that represent the business problem you are trying to solve. This stage will directly influence the accuracy of the predictive model stage. We typically perform tasks in feature engineering Feature construction. Feature selection is the process of cutting down the features that add more so many possible scenarios that could necessitate cleaning. For instance, the data could also have inconsistencies within the same column, meaning that some rows , and others could be . The data types could also be some of the 0s might integers, whereas some of them could be strings. If we’re dealing with a categorical data type with multiple categories, some or have different Feature construction involves creating new features from the ones that you already have (and possibly ditching the old ones). For example, if you have a for age, but your model only cares about if a person is an adult or minor, you could threshold it at assign different categories to instances above such as having categories categories for for One of the steps that is often forgotten in this stage, causing a lot of problems later on, is the presence of @ IJTSRD | Available Online @ www.ijtsrd.com www.ijtsrd.com | Volume – 3 | Issue – 1 | Nov-Dec 2018 Dec 2018 Page: 956
International Journal of Trend in Scientific Research and Development (IJTSRD) ISSN: 2456 International Journal of Trend in Scientific Research and Development (IJTSRD) ISSN: 2456 International Journal of Trend in Scientific Research and Development (IJTSRD) ISSN: 2456-6470 9.Future of Data Science Almost all business nowadays uses data decisions in one way or another. And if they don’t, they will in the nearest future. Because by far this is the most efficient technique to deal with data and gain insights. Since the Harvard Business Review gave the title of ‘the sexiest job of the 21st century’ to Data Scientist, the majority of software engineers and related people tried to adapt it to advance their career. According to Udacity, an online education system, there is a 200 percent year-over-year rise in a job search for ‘Data Scientist’ and a 50 percent year year rise in a job listing for the same 10.Conclusion Data science can add value to any business who can use their data well. From statistics and insights across workflows and hiring new candidates, to helping senior staff make better-informed decisions, data science is valuable to any company in any industry. 11.References 1.https://www.nytimes.com/2014/08/18/technology/ for-big-data-scientists-hurdle janitor-work.html?_r=0 2.https://datajobs.com/what- 3.http://sudeep.co/data-science/Understanding Data-Science-Lifecycle/ 4.https://www.digitalvidya.com/blog/future science/ new candidates, to helping informed decisions, data nowadays uses data-driven decisions in one way or another. And if they don’t, they will in the nearest future. Because by far this is the most efficient technique to deal with data and gain Since the Harvard Business Review gave the sexiest job of the 21st century’ to Data Scientist, the majority of software engineers and related people tried to adapt it to advance their career. According to Udacity, an online education system, science is valuable to any company in any industry. https://www.nytimes.com/2014/08/18/technology/ hurdle-to-insights-is- -is-data-science science/Understanding-the- year rise in a job ch for ‘Data Scientist’ and a 50 percent year-over- https://www.digitalvidya.com/blog/future-of-data- Data science can add value to any business who can use their data well. From statistics and insights across @ IJTSRD | Available Online @ www.ijtsrd.com www.ijtsrd.com | Volume – 3 | Issue – 1 | Nov-Dec 2018 Dec 2018 Page: 957