Download
1 / 10
100 likes | 102 Views
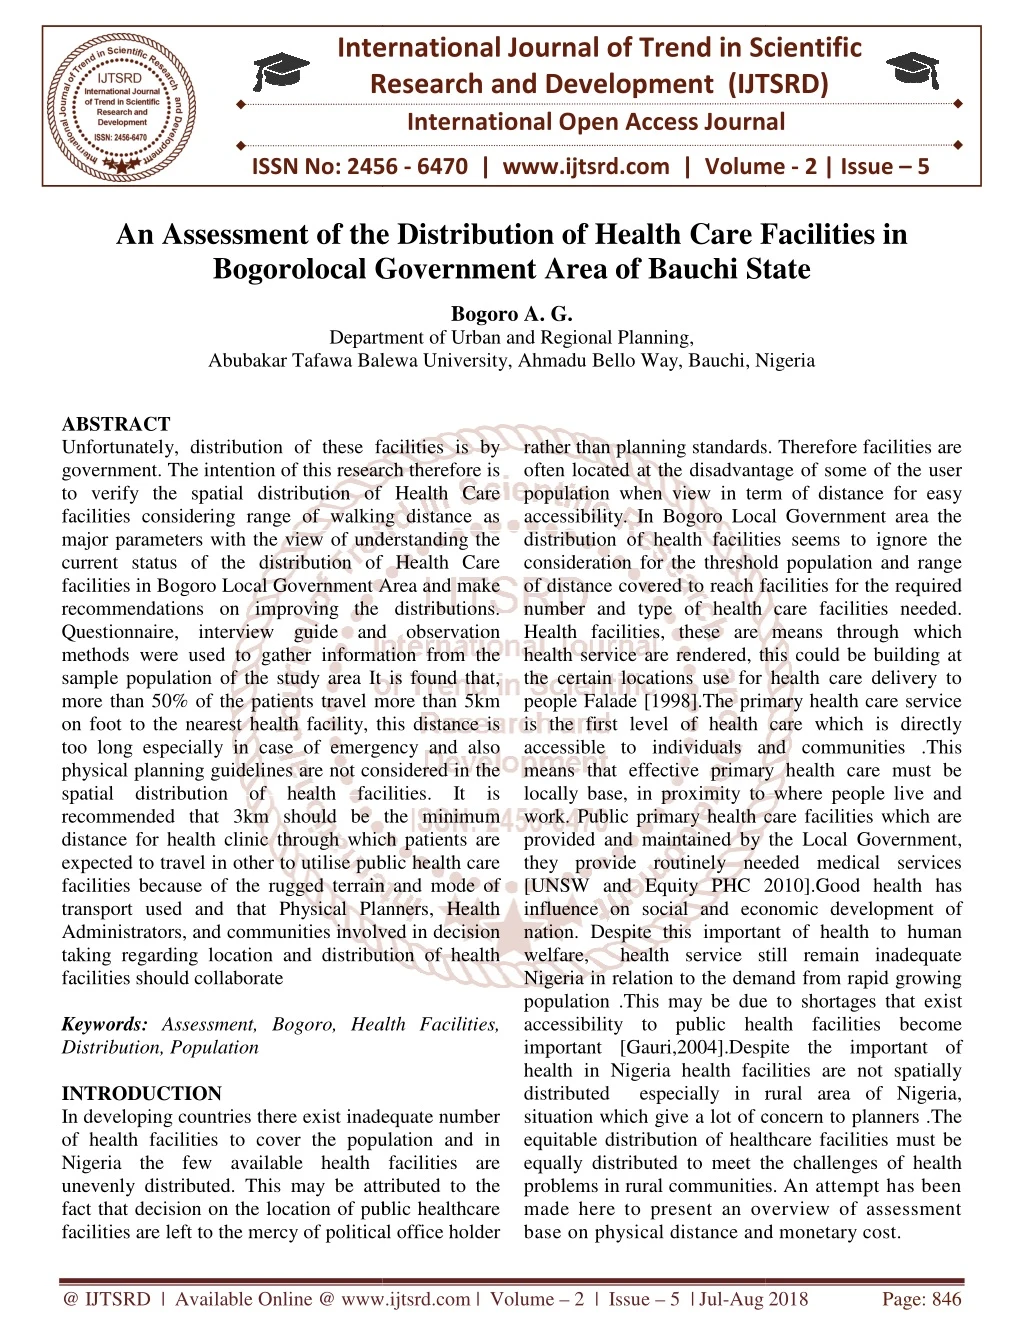
Unfortunately, distribution of these facilities is by government. The intention of this research therefore is to verify the spatial distribution of Health Care facilities considering range of walking distance as major parameters with the view of understanding the current status of the distribution of Health Care facilities in Bogoro Local Government Area and make recommendations on improving the distributions. Questionnaire, interview guide and observation methods were used to gather information from the sample population of the study area It is found that, more than 50 of the patients travel more than 5km on foot to the nearest health facility, this distance is too long especially in case of emergency and also physical planning guidelines are not considered in the spatial distribution of health facilities. It is recommended that 3km should be the minimum distance for health clinic through which patients are expected to travel in other to utilise public health care facilities because of the rugged terrain and mode of transport used and that Physical Planners, Health Administrators, and communities involved in decision taking regarding location and distribution of health facilities should collaborate Bogoro A. G. "An Assessment of the Distribution of Health Care Facilities in Bogorolocal Government Area of Bauchi State" Published in International Journal of Trend in Scientific Research and Development (ijtsrd), ISSN: 2456-6470, Volume-2 | Issue-5 , August 2018, URL: https://www.ijtsrd.com/papers/ijtsrd16981.pdf Paper URL: http://www.ijtsrd.com/humanities-and-the-arts/other/16981/an-assessment-of-the-distribution-of-health-care-facilities-in-bogorolocal-government-area-of-bauchi-state/bogoro-a-g<br>

E N D
International Research Research and Development (IJTSRD) International Open Access Journal An Assessment of the Distribution of Health Care Facilities in Bogorolocal Government Area of Bauchi State Bogoro A. G. Department of Urban and Regional Planning, Balewa University, Ahmadu Bello Way, Bauchi, Nigeria International Journal of Trend in Scientific Scientific (IJTSRD) International Open Access Journal ISSN No: 2456 ISSN No: 2456 - 6470 | www.ijtsrd.com | Volume 6470 | www.ijtsrd.com | Volume - 2 | Issue – 5 An Assessment of the Distribution of Health Care Facilities in Bogorolocal Government Area o An Assessment of the Distribution of Health Care Facilities in f Bauchi State Department Abubakar Tafawa Balewa Nigeria ABSTRACT Unfortunately, distribution of these facilities is by government. The intention of this research therefore is to verify the spatial distribution of Health Care facilities considering range of walkin major parameters with the view of understanding the current status of the distribution of Health Care facilities in Bogoro Local Government Area and make recommendations on improving the distributions. Questionnaire, interview guide and obser methods were used to gather information from the sample population of the study area It is found that, more than 50% of the patients travel more than 5km on foot to the nearest health facility, this distance is too long especially in case of emergen physical planning guidelines are not considered in the spatial distribution of health facilities. It is recommended that 3km should be the minimum distance for health clinic through which patients are expected to travel in other to utilise publ facilities because of the rugged terrain and mode of transport used and that Physical Planners, Health Administrators, and communities involved in decision taking regarding location and distribution of health facilities should collaborate Keywords: Assessment, Bogoro, Health Facilities, Distribution, Population INTRODUCTION In developing countries there exist inadequate number of health facilities to cover the population and in Nigeria the few available health facilities are unevenly distributed. This may be attributed to the fact that decision on the location of public healthcare facilities are left to the mercy of political office holder ercy of political office holder rather than planning standards. Therefore facilities are often located at the disadvantage of s population when view in term of distance for easy accessibility. In Bogoro Local Government area the distribution of health facilities seems to ignore the consideration for the threshold population and range of distance covered to reach fac number and type of health care facilities needed. Health facilities, these are means through which health service are rendered, this could be building at the certain locations use for health care delivery to people Falade [1998].The primary health care service is the first level of health care which is directly accessible to individuals and communities .This means that effective primary health care must be locally base, in proximity to where people live and work. Public primary health care facilities which are provided and maintained by the Local Government, they provide routinely needed medical services [UNSW and Equity PHC 2010].Good health has influence on social and economic development of nation. Despite this important of health welfare, health service still remain inadequate Nigeria in relation to the demand from rapid growing population .This may be due to shortages that exist accessibility to public health facilities become important [Gauri,2004].Despite the importan health in Nigeria health facilities are not spatially distributed especially in rural area of Nigeria, situation which give a lot of concern to planners .The equitable distribution of healthcare facilities must be equally distributed to meet the cha problems in rural communities. made here to present an overview of assessment base on physical distance and monetary cost. physical distance and monetary cost. Unfortunately, distribution of these facilities is by government. The intention of this research therefore is to verify the spatial distribution of Health Care facilities considering range of walking distance as major parameters with the view of understanding the current status of the distribution of Health Care facilities in Bogoro Local Government Area and make recommendations on improving the distributions. Questionnaire, interview guide and observation methods were used to gather information from the sample population of the study area It is found that, more than 50% of the patients travel more than 5km on foot to the nearest health facility, this distance is too long especially in case of emergency and also physical planning guidelines are not considered in the spatial distribution of health facilities. It is recommended that 3km should be the minimum distance for health clinic through which patients are expected to travel in other to utilise public health care facilities because of the rugged terrain and mode of transport used and that Physical Planners, Health Administrators, and communities involved in decision taking regarding location and distribution of health dards. Therefore facilities are often located at the disadvantage of some of the user population when view in term of distance for easy In Bogoro Local Government area the distribution of health facilities seems to ignore the consideration for the threshold population and range of distance covered to reach facilities for the required number and type of health care facilities needed. Health facilities, these are means through which health service are rendered, this could be building at the certain locations use for health care delivery to e primary health care service is the first level of health care which is directly accessible to individuals and communities .This means that effective primary health care must be proximity to where people live and th care facilities which are provided and maintained by the Local Government, they provide routinely needed medical services [UNSW and Equity PHC 2010].Good health has influence on social and economic development of nation. Despite this important of health to human welfare, health service still remain inadequate Nigeria in relation to the demand from rapid growing population .This may be due to shortages that exist accessibility to public health facilities become important [Gauri,2004].Despite the important of health in Nigeria health facilities are not spatially distributed especially in rural area of Nigeria, situation which give a lot of concern to planners .The equitable distribution of healthcare facilities must be equally distributed to meet the challenges of health problems in rural communities. An attempt has been made here to present an overview of assessment Assessment, Bogoro, Health Facilities, In developing countries there exist inadequate number of health facilities to cover the population and in Nigeria the few available health facilities are distributed. This may be attributed to the fact that decision on the location of public healthcare @ IJTSRD | Available Online @ www.ijtsrd.com @ IJTSRD | Available Online @ www.ijtsrd.com | Volume – 2 | Issue – 5 | Jul-Aug 2018 Aug 2018 Page: 846
International Journal of Trend in Scientific Research and Development (IJTSRD) ISSN: 2456-6470 Physical Route Distance This is the actual distance in kilometres required to be covered before reaching a particular public PHC facility. Onorkercorage (1982) argues that primary health care facilities should be located within about 2km considering the important role of health in any National Development. He however noted that despite the proximity of public PHC facilities to the people, they are still required to travel longer distances for specialized treatment in high order facilities-Also in his study of social services provision in urban Ilorin (Kwara State), he noted that the patients in the secondary health facilities are drawn from within 20km distance. Dung, (2004), on assessment of physical route distance, shows that about 92.5% of the patients, attending public PHC services in the study area travels within a distance of 0.1-3.Okm, which means that people are not willing to travel a distance of more than 3km.Kayoed (1989) stated that in public PHC services no body want to travel more than 5km on foot in order to receive health care services. However for preventive service e.g. immunization or health education the distance people want to travel to receive services is much less. Adejuyigbe,(1978). In his study of basic health facilities in rural areas of Ife commended 2km as the maximum distance patients in the rural areas need to cover order to utilize basic health services. From the above paragraphs, it should be inferred that the range of public PHC facilities is likely to be more than 2km. Travel Time to Public PHC Facilities In his previous work of Frank Tenser (2006) showed that there would be a logistic relation between decay in attendance of a specific PHC and travel time, a 50minutes travel time, use of e PHC service is 91% but decays rapidly to 50% at 81minutes, and at 1% at 150 minutes: the logistic relation means that people living <50 minutes from a PHC facility are assigned virtually no delay, but therefore the impedance increases sharply until saturation start to occur at about two hours travel time. Kayode (1989) stated that in public PHC services nobody wants to travel more than half an hour journey on foot to receive health care Threshold Population The threshold population for a particular grade of health center is the minimum that justifies the allocation needed to support a health center, health clinic or hospital it is define as the minimum population necessary to support a health clinic, health center or rural hospital. Distribution of health care facilities should be in accordance with population threshold so as to make the facilities worthwhile. Example of type of health facilities by different population threshold that is estimated of population size to be served with the health clinic health centers and general hospital is given in the table below. Table 1 Population Threshold and Range Standards Facility Threshold population Cottage Hospital Above 90,000 Primary Health Centre Health Care 30,000-50,000 Maternity 20,000-30,000 Dispensary 15,000-20,000 Health Post 10,0000-15,000 Source: Falade, [1998]. Distance decay model is one of the major concepts in urban and regional planning. This is because it is fundamental to the study and appreciation of spatial organization. There are two basic things involve in this study, namely the location pattern and its effect on distance travel, access time and transport cost to public PHC facilities. Therefore the major concepts to be reviewed which are relevant to this study are the distance decay model, nearest neighbor analysis, location allocation model and the spearman’s correlation coefficient. DISTANCE DECAY MODEL This model was formulated by PerterHagget (1969). The mathematical notation of distance decay model represented by F = i/d Where F= Degree of interaction D2 = square of a distance separating the two region/point This can be deduced that the more distance the lesser the degree of interaction between people and service point. Distance will invariable affects the number of patients patronizing a particular public health care facility the number of patient decrease. The reason for this is that the high cost in terms of money, time and energy which people further away from the facility will have to encountered in overcoming distance be regarded as being dependent upon the extent to which the spatial pattern of public health facility minimize aggregate movements cost for potential users, Wasinda (2002), in his research of planning for Rate in km Above 40 30-40 Above 50,000 15-20 4-7 2-3 10-15 @ IJTSRD | Available Online @ www.ijtsrd.com | Volume – 2 | Issue – 5 | Jul-Aug 2018 Page: 847
International Journal of Trend in Scientific Research and Development (IJTSRD) ISSN: 2456-6470 development of health facilities in Biu Emirate of Borno State. Among the factors that effects utilization of health services in developing country poverty. The merit and demerit of distance decay model: Model: The disadvantage of this concept is that the high cost in terms of money time and energy which people further away from the facility will have the incurred in overcoming distance, being regarded as dependent upon the extends to which the pattern of public health facility minimize aggregate movements cost for potential users. These implies that the further the health facilities the less the degree of health patronage, the merit of those that are near to the health facilities the less the degree of health patronage, the merit of this concept is that its only favors’ those near to this health facilities and those that have high income that can overcome; lost and distance in other to patronize particular health services. Pattern of Distribution These patterns of distribution, according to Decay, (1962) use the techniques of nearest neighborhood analysis in the United States, compare the observe pattern with three expected distribution: 1.Random distribution 2.Regular distribution and 3.Cluster distribution. Random distribution This is distribution chosen without any definite plan or pattern, the way in which people and building are arrange over that is the population distribution are not definite. This model is relevant in the study of the distribution pattern in rural areas, that the nearest neighborhood analysis is use to analyze the pattern of distribution of facilities though it has been observed that when the model was applied the concept to town distribution in certain areas in the south west Washington in the US with about 235 settlements, this model which was based on quadrant counts methods, is however faulty because such information loss in the process of transporting maps to quadrant counts. Clusters distribution These are groups of settlement distribution which are closely together from a small group of a particular settlement, therefore due to the spatial nature of settlement distribution in rural area it gives rise to the nearest neighborhood analysis used to analyze the distribution of primary health facilities in rural areas. Peter Hagget, (1971) gave the formula for the nearest neighborhood analysis: Dl= ido/ide Where do =1/n De=1/2h1/2 h=density of facilitie SDi= give a perfects cluster distribution. Nearest Neighbourghood Techniques Clarke Evans (1954) introduced this concept. However it was developed by Decay (1963) and Chorley)(1967) The concept is statistical model which enables pattern to be measured by index (Rn) which ranges from zero for perfectly clustered, through one for random to 2.15 for perfectly uniform pattern. This is a straight line separating points and their nearest neighbors in space as shown in the figure below: Figure 1 Shows nearest neighbourhood techniques. C A=perfectly clustered (Rn=0). B=Random (Rn=1). C=Perfectly Uniform (Rn=2.2.15). Decay and keng, (1962) applied the nearest neighbors techniques in United States. Decay applied the concept of town distribution in certain areas of the S.W Wisconsin in the US with about 235 settlements. Hamlets were 61% and town 85 of the total number of settlements. He compared the observed and the expected random distribution and developed a series of models based upon the random procession the plane to describe the spacing of towns in America Midwest and Japan. His model which was based on quadrants counts methods, is however faulty because such information is lost in the process of transforming map to quadrants counts. In the same light, king used the nearest neighborhood techniques to analyze settlement pattern in 20 sample areas in the United State. He compared the observed linear distance between a place and its nearest neighbor regardless of size. He found a value (Rn) which range from 0.7 for Utah with a relatively clustered pattern to 1.38 for Missiouri which tends towards uniformity. Between these two values the remaining areas indicates that the pattern approximates a random, rather than the hypothesized Uniformity distribution @ IJTSRD | Available Online @ www.ijtsrd.com | Volume – 2 | Issue – 5 | Jul-Aug 2018 Page: 848
International Journal of Trend in Scientific Research and Development (IJTSRD) ISSN: 2456-6470 LOCATION ALLOCATION MODEL This model seeks allocations such that the aggregate distance traveled is minimal. This is the most accessible point for the location of PHC facilities. Massam, (1975) have the sequence of steps for this model as follows: I. Define the extent of the area you want the facility to cover. II. Choose an arbitrary location point that looks reasonable P1 III. Calculate S= ∑i=n m1d1p1 IV. Continue to find the space P1 until the lowest value is found. CORRELATION This deals with scatter diagrams which are present to graphically depict relationship between two variable, linear correlation coefficient is used to determine whether a linear relationship exist between two variables. A correlation related to the other in some way 1.The sample of paired (xiy) data is a random sample 2.The pairs of (xiy) data have a normal distribution. The key feature of such distribution, and for fixed value of y the values of x have normal distribution. Rank correlation: To test whether the ranking of two variables for a sample or population are related that is whether they depend on one another or whether they are the same. The formula is represented below. Rs= 1 1-6Ed2 (critical value for 0>30 therefore 1z ) n (n2-1) Where: Z is for the normal distribution λ = is the ranking correlation £ = is summation of the ranking N = is the number of the wards This model will be used to rank the relationship between population and health facilities in Bogoro to determine whether they relate with each other. Thus this research is set out to study the distribution of public primary healthcare facilities in Bogoro Local Government Area of Bauchi State, with a view to examine the spatial distribution of public healthcare facilities and identify associated planning problems as a basis for making recommendations. METHODS AND MATERIALS Bogoro local Government Area is approximately 9 30’N and 9 45’E between 9 50’N and 9 30’E. The Local Government has 10 political wards namely Bogoro, DutsenLawan, Gobbiya, Bar/mwari, Boi, Dazara, Gambar, Lusa respectively. Bogoro Local Government has three [3] District Village Heads which are Bogoro, Lusa and Boi Districts respectivelyas in fig 1. It was created on 1st October 1996, out of Tafawa Balewa Local Government Area, with the headquarters in Bogoro, it is about 96km south away from the State capital situated at the extreme south of the State, with the population of 83,809 (41776 Male and 42033 Female) 2006 Census. The sample size of 0.1-0.5% recommended by Ikoko [1999] for population above 90,000 he postulated that the larger the population the lower the percentage of population to be taken as sample and vice –versa. Base on this value arrived as at the sample size taking 0.4% of the total population of the study area, with population of 106,169 is 388. This in turn determined the numbers of questionnaire used there for, a total of 388 questionnaires were administered to sample the respondent. The stratified technique were used to sample primary healthcare facilities which are to be selected from thirteen [13] word in Bogoro Local Government Area. Data are collected through primary sources such as reconnaissance survey personal interview, observation and administering questionnaire and secondary sources such as relevant text books journals, maps, pictures, internet, and other related literature. The collected date are analyse and presented through Bar chart, pie chart, diagrams, tables, maps, pictures, etc. Tadnum, Badagari, n-1 @ IJTSRD | Available Online @ www.ijtsrd.com | Volume – 2 | Issue – 5 | Jul-Aug 2018 Page: 849
International Journal of Trend in Scientific Research and Development (IJTSRD) ISSN: 2456-6470 Figure 2 Map of Nigeria Showing Bauchi State @ IJTSRD | Available Online @ www.ijtsrd.com | Volume – 2 | Issue – 5 | Jul-Aug 2018 Page: 850
International Journal of Trend in Scientific Research and Development (IJTSRD) ISSN: 2456-6470 RESULTS AND DISCUSSION The data on the demographic characteristic of the sampled patients namely age sad sex distribution, occupational composition, income levels are treated in the section. Table 2 Showing Age and Sex Distribution of Patients AGE MALEFEMALEM/F 0-4 37 5-9 22 10-14 20 15-19 17 20-24 11 25-26 9 30-34 8 35-39 6 40-44 5 45-49 5 50-54 7 55-59 5 60-64 3 69-Above 3 TOTAL 158 40% Source: Field Survey 2014 The table above shows that Female and infant patronize health care facilities more than Male. These disparities may be explained by the fact that most settlements in the study area are famers, which attribute very high population during the peak of raining season in the area. As decline in farming activities most of the male youth migrate out in search for means of survival, thus leaving women, children and old age in the study area. Table 3 Analyses of Health Facilities in Bogoro Local Government Area. DISTRICT WARD POPULA- TION ENT BOGORO Bar/Mwari 14364 Bar Lafiyan Sara Mwari PMSS Pap Cocin/Clinic Bogoro 13328 Bogoro Bogoro Gimzim DutsenLawan 15417 DutsenLawan % 21.7 15.0 11.3 9.8 7.8 6.8 5.5 5.0 4.0 3.3 3.0 2.3 1.4 1.3 100 47 36 26 22 20 18 12 14 11 8 5 4 3 2 235 60% 84 58 46 39 31 27 22 20 16 13 12 9 6 5 388 59% SETTLEM- TYPE NO. OWNERSHIP Health Clinic Health Clinic Health Clinic Health Clinic Health Clinic Health Clinic General/Hospital Maternity Health Clinic Primary Health Care Health Clinic Primary Health Health Clinic Health Clinic PryHealth Care Health Clinic Health Clinic PryHealth Care Health Clinic 1 1 1 1 1 1 1 2 1 1 Local Govt Local Govt Local Govt School Local Govt COCIN State Govt T/SHIP Local Govtt State Govt Bazanshi Gobbiya UnguwanGyada Dashem Boi Gambar Dambar UnguwanRimi Gyara 1 1 1 1 1 1 1 1 1 Community State Govt Local Govt Local Govt State Govt Local Govt Community Fahimta aids Community Gobbiya Boi Gambar Dazara 13194 9462 6648 9963 BOI @ IJTSRD | Available Online @ www.ijtsrd.com | Volume – 2 | Issue – 5 | Jul-Aug 2018 Page: 851
International Journal of Trend in Scientific Research and Development (IJTSRD) ISSN: 2456-6470 DISTRICT WARD POPULA- TION 6501 SETTLEM- ENT Tadnum Banram Lusa TYPE NO. OWNERSHIP LUSA Tadnum/baram Lusa Maternity Health Clinic Primary Health Care Health Clinic Health Clinic Health Clinic Health Clinic Health Clinic 1 1 1 Local Govt Community ALGON Mbal Dungah Bongah Datsang Gizaki 1 1 1 1 1 Local Govt Community Community Local Govt Fahimta Action Aids Local Govt Community Badagari 5473 Bugun Ndit Health Clinic Health Clinic 1 1 SOUCE: Field Survey, 2014. The distribution of health facilities are as follows: Dispensary/Clinic are 20, maternity facilities 1, primary healthcare facilities 6, which amount to 27 health facilities in the study area. Only one maternity is grossly inadequate considering the population of female within the childbearing age. These are some of the selected healthcare facilities distributed in Bogoro local government. PLATE 4 MBAL HEALTH CLINICS Income Level of Patients. PLATE 1 BOGORO GENERAL HOSPITAL PLATE 2 BOGORO MATERNITY FACILITY The figure above shows that 39.9% earn less than 30,000 per annum while 9.5 earn more than 120 per annum. This shows the low level of economic activities in the study area and this will make accessibility to the facilities more difficult PLATE 3 GOBBIYA PRIMARY HEALTH CARE FACILITY @ IJTSRD | Available Online @ www.ijtsrd.com | Volume – 2 | Issue – 5 | Jul-Aug 2018 Page: 852
International Journal of Trend in Scientific Research and Development (IJTSRD) ISSN: 2456-6470 Occupation Level in the Study Area mode of transportation to primary health care facilities in the study areas: The figure below shows that 42.5 of respondent travel by foot to health facilities. This attributed to the fact that some of the roads are not seasonably motor able especially during raining season walking by foot and use of motorcycle is more pronouns than other means of transport in the study area. Fig. MODE OF TRANSPOTATION USE AND PERCENTAGE The pie chart above is showing the percentages of the occupation, which indicate farming activities as the major occupation in the study area where there is low support; it will result to low productivity. The above table shows the various level of education attainment of the people. From the above data it shows that 4.0% attained secondary school, and also 14.1% attained tertiary. This shows that their high level of literacy that people will choose to visit hospital rather than traditional treatment. Fig.5. Show educational level. 4.9 PHYSICAL DISTANCE COVERED BY THE RESPONDENT IN ORDER TO UTILIZED PRIMARY HEALTH CARE FACILITIES IN THE STUDY AREA Distance is the fundamental variable in the study of distribution of primary health care facilities. Thus indicate the range at which people are willing to travel in order to utilized health facilities, below are the distance covered by respondents in order to utilized health care facilities. As it shown above, 40.90% attended secondary school which will enable them to understand the value of primary health care facilities in the study area. 4.8 MODE OF TRANSPORTATION TO THE PHC FACILITIES IN BOGORO LGA Distribution of public PHC facilities can be view from the mode of transportation available to be use by the patients, this is important because it affects travel time and convenience. The table below shows the various FIG 3 DISTANCE COVERED BY PATIENTS TO NEAREST HEALTH CARE FACILITIES IN THE STUDY AREA The figure shows that 36.8% patients travel less than one km[1km] and 31.7% respondent travel from two [2] to three [3km] to use health facilities .While 0.7% travel 7km above these indicate that most of @ IJTSRD | Available Online @ www.ijtsrd.com | Volume – 2 | Issue – 5 | Jul-Aug 2018 Page: 853
International Journal of Trend in Scientific Research and Development (IJTSRD) ISSN: 2456-6470 respondent travel from 1-4km to health facilities which make easy accessibility in sthe study area. The chart above shows that, more than 50% of the patients travel more than 5km to the nearest health facility, this distance is too long especially in case of emergency.The distributions of primary health care facilities are not in conformity with the planning standard,. Like Boi ward with a population of 9462 has only one health facility. Lack of good access road to the primary health care facilities especially during the raining season, such as river and stream example DutsenLawan, Bazanshi and Kogo. and above to the health facilities in the study area. It was identified that Bogoro LGA have only one [1] maternity facility, the other district suffered in terms of distance covered and bad road when visiting the facility by the women during pregnancy. It was discovered that most of rural roads are not good, many are without culverts and bridges .This has contributed problem for transportation making it very difficult and costly for people to access the available distributed health facilities. Example, River Bazanshi in DutsenLawan Ward of Bogoro District of the study area. CONCLUSION AND RECOMMEDATION For the purpose of patients seeking emergency in most Districts and Wards, maternities should be upgraded to accommodate more patients in all the five Health Care facilities of the three Districts across the study area also the road network should be upgraded in the study area with the provision of culverts, drainage and bridges to enable easy movement to the distributed health care facilities in the study area. According to Kayode [1987] it is recommended that the distribution of healthcare facilities should cover distance of about 5km because people are not willing to travel more than 5km on foot to receive healthcare services. It is recommended that 3km should be the minimum distance for health clinic through which patients are expected to travel in other to utilise public health care facilities because of the rugged terrain and mode of transport, which is mostly foot, so that majority of the patients would find it convenient to access the nearest health facility Finally, there should be collaboration between Physical Planners and Health Administrators, so as to achieve rationality in spatial location and distribution of public health facilities in the study area. Distributions of public health care facilities remain a problem in Nigeria especially in the rural areas, as in the case of Bogoro Local Government Area. This gives some areas under advantage over others. The challenges of public health care distribution at Local Government level is how to get Physical Planners, Health Administrators, and communities involved in decision taking regarding location and distribution of health facilities. If this is achieved it will enhance the distribution of health care facilities in the locations which are not easily accessible to the generally of the populace. Thus if the recommendation of this research are implemented, it will improved the accessibility and distribution of PLATE 5 RIVER BAZANSHI High cost of transportation to primary health care which affect the patients trying to rich the health facilities, where some patients spend more than N150 to access health facilities.eg from BoiJeji to Boi PHC facility, lack of maternity facilities to enable pregnant women have easy access to service when given birth in the district, long distance covered by the patients in other to access primary health care facilities, example, distance from Bongah to Lusa Primary Health Care. The study reveal that majority of the patients that uses these facilities are women and children which most of them are low income earners. The study shows that threshold population in the rural area are difficult to meet doe to the spatial nature of the settlement; however, travel distance to public primary health care facilities is given special consideration. Base on the behavior of patient in regarding to travel distance to utilize primary health care facilities, from the sample facilities which shown in fig the majority[68.5%] of the patients cover distance of 1-3km in order to utilize public health facilities, after this distance people are not willing to travel long distance to utilize health facilities, and also that some patients seeking for emergency health service in the study area find it difficult because of long distance covered or bad road network to meet health facilities in the study area as it shown in fig .[31.1%] patients travel from 4-7km @ IJTSRD | Available Online @ www.ijtsrd.com | Volume – 2 | Issue – 5 | Jul-Aug 2018 Page: 854
International Journal of Trend in Scientific Research and Development (IJTSRD) ISSN: 2456-6470 8.The Federal Ministry of Health (1996).The National Health Policy for Nigeria. 9.Andersen, R.M (1995). Revisiting the Behavioural Model and Access to Medical Care: Does it Matter? Journal of Health and Social Behaviour, 36, 1 -10. 10.Ahs, A.M and We sterling, R. (2006). Health Care Utilization among Persons Who Are Unemployed or Outside the Labour Force. Health Policy, 178 – 193. 11.Chiemelu, N.E. Analysis of the Distribution of Primary Health Care Facilities in Enugu State Nigerian. Journal of Environmental Management and Safety. 12.Ademiluyi I. A. and Alulo S.O (2009): Infrastructural Distribution of Health Care Services in Nigeria: An Overview Journal of Geography and Regional Planning Vol. 2 (5), App – 104 13.Awosika D.O (2002) Ominous Nigeria Health Care System: Is There a Hope for Solution? 14.Jankowski P, and Analysis’s, T. (2001), Collaborative Spatial Decision Making Primary Health Care Management: A Taste Analysis–Driven Approach. Taylor & Francis Publication. public healthcare facilities in the study area. This will in turn means improved rural welfare REFERENCES 1.Andrew G. Onorkerhorage (1999). Access and Utilization of Modern Health Care Facilities in the Petroleum–Producing Region of Nigeria: The Case of Bayelsa State. Research Paper N. 162. 2.Idachaba F.S (1985).Rural Infrastructure in Nigeria. Ibadan University Press. 3.Egunjobi L. (1993). Prospect for Collaboration Between Physical and Health (Lanners, Quarterly Journals of PHC in Nigeria Vol. iii No.1) 4.Andare S. (2004).Journals of the Nigerian Institute of Town Planning. Vol. 8 WHO – UNICEF, (1978). Acima Ata Declaration on Primary Health Care. 5.Gauri A.J. (2013). “Accessibility to Public Primary Health Care Facilities in Akko L.G.A. Gombe State.” Unpublished B. Tech Thesis Department of Urban and Regional Planning ATBU Bauchi. 6.Lashie.M. (1986), Urban Hospital in London. I. R. S. G, London. 7.Dr. Frank Tenser (2006), Methodology for Optimizing Location of New Primary Health Care Facilities in Rural Communities: A Case Study in Kwazulu-Natal South Africa. in @ IJTSRD | Available Online @ www.ijtsrd.com | Volume – 2 | Issue – 5 | Jul-Aug 2018 Page: 855