Download
1 / 5
50 likes | 57 Views
This paper presents study of the stabilization of natural soil with lime. Firstly, Soil samples from Madaya Township are collected and several laboratory tests are carried out to determine the characteristics and engineering properties of the studied soil. Then experimental tests have been conducted for the determination of Atterberg limits and California Bearing Ratio CBR values. The studied soil contains more than 50 of silt clay fraction. So, the studied soil is stabilized with lime contents selected as 5 and 10 by weight of natural soil at maximum dry density. When soil samples are mixed with lime, the values of liquid limit, plasticity index and CBR values are changed. These changes are decreased in swelling and shrinking potential of the soil, decreased in the settlement of the pavements, increase in workability and increase in the bearing capacity of the soils. In this study, the CBR values of soil lime mixtures are 71.4 and 64.4 higher than that of studied soil. It can be seen that the CBR value of lime 5 is greater than lime 10 and natural soil. So, soil lime mixture with lime 5 content is suiTablefor soil stabilization of the street, road and highway. Nyein Nyein Thant | Tin Yadanar Kyaw "Study on the Properties of Natural Soil Stabilized with Various Percentages of Lime Contents" Published in International Journal of Trend in Scientific Research and Development (ijtsrd), ISSN: 2456-6470, Volume-3 | Issue-5 , August 2019, URL: https://www.ijtsrd.com/papers/ijtsrd27871.pdf Paper URL: https://www.ijtsrd.com/engineering/electrical-engineering/27871/study-on-the-properties-of-natural-soil-stabilized-with-various-percentages-of-lime-contents/nyein-nyein-thant<br>

E N D
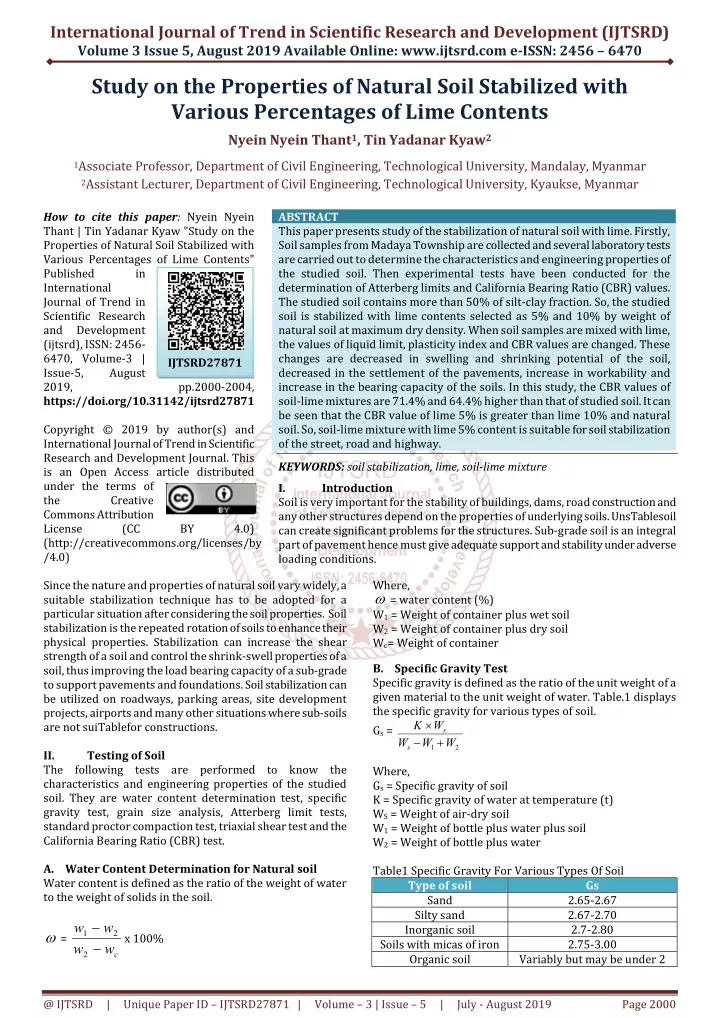
International Journal of Trend in Scientific Research and Development (IJTSRD) Volume 3 Issue 5, August 2019 Available Online: www.ijtsrd.com e-ISSN: 2456 – 6470 Study on the Properties of Natural Soil Stabilized with Various Percentages of Lime Contents Nyein Nyein Thant1, Tin Yadanar Kyaw2 1Associate Professor, Department of Civil Engineering, Technological University, Mandalay, Myanmar 2Assistant Lecturer, Department of Civil Engineering, Technological University, Kyaukse, Myanmar How to cite this paper: Nyein Nyein Thant | Tin Yadanar Kyaw "Study on the Properties of Natural Soil Stabilized with Various Percentages of Lime Contents" Published in International Journal of Trend in Scientific Research and Development (ijtsrd), ISSN: 2456- 6470, Volume-3 | Issue-5, August 2019, https://doi.org/10.31142/ijtsrd27871 Copyright © 2019 by author(s) and International Journal of Trend in Scientific Research and Development Journal. This is an Open Access article distributed under the terms of the Creative Commons Attribution License (CC (http://creativecommons.org/licenses/by /4.0) Since the nature and properties of natural soil vary widely, a suitable stabilization technique has to be adopted for a particular situation after considering the soil properties. Soil stabilization is the repeated rotation of soils to enhance their physical properties. Stabilization can increase the shear strength of a soil and control the shrink-swell properties of a soil, thus improving the load bearing capacity of a sub-grade to support pavements and foundations. Soil stabilization can be utilized on roadways, parking areas, site development projects, airports and many other situations where sub-soils are not suiTablefor constructions. II. Testing of Soil The following tests are performed to know the characteristics and engineering properties of the studied soil. They are water content determination test, specific gravity test, grain size analysis, Atterberg limit tests, standard proctor compaction test, triaxial shear test and the California Bearing Ratio (CBR) test. A.Water Content Determination for Natural soil Water content is defined as the ratio of the weight of water to the weight of solids in the soil. w w 2 ABSTRACT This paper presents study of the stabilization of natural soil with lime. Firstly, Soil samples from Madaya Township are collected and several laboratory tests are carried out to determine the characteristics and engineering properties of the studied soil. Then experimental tests have been conducted for the determination of Atterberg limits and California Bearing Ratio (CBR) values. The studied soil contains more than 50% of silt-clay fraction. So, the studied soil is stabilized with lime contents selected as 5% and 10% by weight of natural soil at maximum dry density. When soil samples are mixed with lime, the values of liquid limit, plasticity index and CBR values are changed. These changes are decreased in swelling and shrinking potential of the soil, decreased in the settlement of the pavements, increase in workability and increase in the bearing capacity of the soils. In this study, the CBR values of soil-lime mixtures are 71.4% and 64.4% higher than that of studied soil. It can be seen that the CBR value of lime 5% is greater than lime 10% and natural soil. So, soil-lime mixture with lime 5% content is suitable for soil stabilization of the street, road and highway. KEYWORDS: soil stabilization, lime, soil-lime mixture I. Introduction Soil is very important for the stability of buildings, dams, road construction and any other structures depend on the properties of underlying soils. UnsTablesoil can create significant problems for the structures. Sub-grade soil is an integral part of pavement hence must give adequate support and stability under adverse loading conditions. IJTSRD27871 pp.2000-2004, BY 4.0) Where, = water content (%) W1 = Weight of container plus wet soil W2 = Weight of container plus dry soil Wc= Weight of container B.Specific Gravity Test Specific gravity is defined as the ratio of the unit weight of a given material to the unit weight of water. Table.1 displays the specific gravity for various types of soil. Gs = W W W s Where, Gs = Specific gravity of soil K = Specific gravity of water at temperature (t) WS = Weight of air-dry soil W1 = Weight of bottle plus water plus soil W2 = Weight of bottle plus water Table1 Specific Gravity For Various Types Of Soil Type of soil Sand Silty sand Inorganic soil Soils with micas of iron Organic soil Variably but may be under 2 K W s 1 2 Gs 2.65-2.67 2.67-2.70 2.7-2.80 2.75-3.00 = 1 2 x 100% w w c @ IJTSRD | Unique Paper ID – IJTSRD27871 | Volume – 3 | Issue – 5 | July - August 2019 Page 2000
International Journal of Trend in Scientific Research and Development (IJTSRD) @ www.ijtsrd.com eISSN: 2456-6470 C.Grain Size Analysis Grain size analysis is the determination of the size range of particles present in a soil, expressed as a percentage of the total dry weight. Two methods are used to find the particle size distribution of soil. 1.Sieve Analysis is used for particle sizes larger than 0.075 mm in diameter, and 2.Hydrometer Analysis is used for particle sizes smaller than 0.075 mm in diameter. D.Atterberg Limit Test The Atterberg limit tests provide measurements of the water content of clayey soils. Atterberg limit tests include: 1.Liquid Limit ( LL ) 2.Plastic Limit ( PL ) 3.Shrinkage Limit (SL ) Liquid Limit (LL) – Liquid limit is defined as the moisture content, in percent, at which the soil changes from a liquid state to a plastic state. Plastic Limit (PL) – Plastic limit is defined as the moisture content, in percent, at which the soil changes from a plastic stage to a semi-solid state. Plasticity index (PI) - Plasticity index is the difference between the liquid limit and plastic limit. PI = LL – PL E.Standard Proctor Compaction Test Use to obtain the maximum dry density of the soil sample and the optimum moisture content. Compaction reduces in soil void ratio by expulsion of air from the voids or by expulsion of water from the voids. γd = 1 γ = V Where, γd = dry unit weight of soil 0 = moist unit weight of soil W = weight of the compacted soil V = volume of the compacted soil = water content of the compacted soils F.Triaxial Shear Test Triaxial shear test is one of the most reliable methods for determining the shear strength parameter. = 3 + f Where, = major principal stress = minor principal stress (confined pressure) = deviator stress at failure (piston stress) Where, PT= total test load Ps = standard test load Table2 Classification System on the Basic of CBR Number CBR number General rating 0-3 Very poor 3-7 Poor to fair 7-20 20-50 good ˃50 Very good III. TestRESULTS OF STUDIED SOIL The test results of studied soil are described in the following Tables. Table3 Water Content Determination of the Studied Soil Uses Sub-grade Grade Sub-base Sub-base, base Base fair Table4 Specific Gravity Test Result for the Studied Soil W The calculated mean specific gravity of the studied soil is 2.68 according to test result. So, it is arranged within 2.67- 2.7 which is silty sand. 1 1 3 f G.California Bearing Ratio (CBR) Test The determination of the potential strength of sub-grade, sub-base, and base course material, including recycle materials for use in road and airfield pavement. Classification system on the basic of CBR number is shown in Table2. CBR = P P × 100 T Figure 1. Grain-Size Distribution Chart for Studied Soil s @ IJTSRD | Unique Paper ID – IJTSRD27871 | Volume – 3 | Issue – 5 | July - August 2019 Page 2001
International Journal of Trend in Scientific Research and D International Journal of Trend in Scientific Research and Development (IJTSRD) @ www.ijtsrd.com www.ijtsrd.com eISSN: 2456-6470 Table5. Results on CBR Test at OMC 5. Results on CBR Test at OMC Clay=12.5% Silt=67.2% Sand=19.3% Gravel=1.0% Figure 2. Flow Curve of Liquid Limit Determina Studied Soil Figure 2. Flow Curve of Liquid Limit Determination for Plastic limit, liquid limit and plasticity index are determined by Atterberg limit tests. PL=21.2%, LL=54.7%, PI=33.5% is high plasticity soil within the PI range of 20 to 40. The liquid limit of the studied soil is 54.7% which is g than 50% and PI value is greater than 23. Therefore the studied soil is in CH group which is inorganic clay of high plasticity. Percent retained of No.200 sieve is 15.4 which is between 15 and 29, and the ratio of sand friction to gravel friction is 14.4 which is greater than 1, so the group name of the studied soil is fat clay with sand. Plastic limit, liquid limit and plasticity index are determined by Atterberg limit tests. PL=21.2%, LL=54.7%, PI=33.5% is high plasticity soil within the PI range of 20 to 40. According to the test results, the percentages of CBR value at standard penetration are 16.0%, 11.5%, 9.4%, 8.0% and 7.3%. The CBR value for 2.5 mm penetration of natural soil is greater than 5 mm penetration. Therefore, 2.5 mm penetration of CBR values, 16.0% is taken as CBR values of this studied soil. So, this soil is IV. Test Results for Natural Soil with Various Percentages of Lime Contents The studied soil is inorganic clay of high plasticity and suitable for sub-base. To improve the performance of natural soil, it is required to stabilize. As silt than 50%, the amount of lime is considered 5% to 10% by weight of natural soil for stabilization. So, the studied soil is mixed with selected lime conten weight of the natural clayey soil in this study. Atterberg limit tests, compaction test, and California Bearing Ratio (CBR) test are carried out for lime stabilized soil compacted at optimum moisture content. A.Atterberg Limit Tests for the Studied Soil with Lime 5% and 10% In this study, the clayey soil with lime 5% and 10% are tested with Atterberg limit tests to know the water content levels at which the soil change from one state to other. levels at which the soil change from one state to other. According to the test results, the percentages of CBR value at standard penetration are 16.0%, 11.5%, 9.4%, 8.0% and 7.3%. The CBR value for 2.5 mm penetration of natural soil is greater than 5 mm penetration. Therefore, 2.5 mm 6.0% is taken as CBR values of this studied soil. So, this soil is suitable for sub-base. The liquid limit of the studied soil is 54.7% which is greater than 50% and PI value is greater than 23. Therefore the studied soil is in CH group which is inorganic clay of high plasticity. Percent retained of No.200 sieve is 15.4 which is between 15 and 29, and the ratio of sand friction to gravel 14.4 which is greater than 1, so the group name of Test Results for Natural Soil with Various Lime Contents The studied soil is inorganic clay of high plasticity and To improve the performance of natural soil, it is required to stabilize. As silt-clay fraction is more than 50%, the amount of lime is considered 5% to 10% by weight of natural soil for stabilization. So, the studied soil is mixed with selected lime contents such as 5% and 10% by weight of the natural clayey soil in this study. Atterberg limit tests, compaction test, and California Bearing Ratio (CBR) test are carried out for lime stabilized soil compacted at for the Studied Soil with Lime In this study, the clayey soil with lime 5% and 10% are tested with Atterberg limit tests to know the water content Figure 3. Water Content and Dry Density Relationship for Studied Soil It can be seen that the maximum dry density (MDD) is 1.68 g/cm3 at the optimum moisture content (OMC) of 20.5%. Figure 3. Water Content and Dry Density Relationship for It can be seen that the maximum dry density (MDD) is 1.68 at the optimum moisture content (OMC) of 20.5%. Figure 5 Liquid Limit of Studied Soil Figure 5 Liquid Limit of Studied Soil with Lime 5% Figure 4. Results for Triaxial Test Figure 4. Results for Triaxial Test From the test results, PL and LL of studied soil with lime (5%) are 19.3% and 48.4% respectively. So, the PI value is 29.1%. The cohesion of the studied soil is 0.93 kg/cm of internal friction is 9°36’. From the test results, PL and LL of studied soil with lime (5%) are 19.3% and 48.4% respectively. So, the PI value is The cohesion of the studied soil is 0.93 kg/cm2 and the angle @ IJTSRD | Unique Paper ID – IJTSRD27871 27871 | Volume – 3 | Issue – 5 | July - August 2019 August 2019 Page 2002
International Journal of Trend in Scientific Research and D International Journal of Trend in Scientific Research and Development (IJTSRD) @ www.ijtsrd.com www.ijtsrd.com eISSN: 2456-6470 Figure 6 Liquid Limit of Studied Soil with Lime 10% Figure 6 Liquid Limit of Studied Soil with Lime 10% Figure 9 Determination of Water Content and Dry Density Figure 9 Determination of Water Content and Dry Density of Studied Soil with Lime (10%) of Studied Soil with Lime (10%) The results of PL and LL of studied soil with lime (10%) are 21.5% and 46.8% respectively. The PI value is 25.3%. Table6 Comparison of Atterberg Limits between Natural Soil and Various Mixture of Soil Atterberg Limits The results of PL and LL of studied soil with lime (10%) are 1.5% and 46.8% respectively. The PI value is 25.3%. According to Figure 9, the maximum dry density is 1.63 g/cm3 at the optimum moisture content of 24.5%. Table7 Comparison results of Compaction Tests between Natural Soil and Various Mixture of Soil soil lime % Natural soil OMC 20.50% MDD (g/cm3) 1.68 1.68 According to Figure 9, the maximum dry density is 1.63 at the optimum moisture content of 24.5%. 6 Comparison of Atterberg Limits between Natural Soil and Various Mixture of Soil-lime rison results of Compaction Tests between Natural Soil and Various Mixture of Soil-Lime Natural soil lime5% 20.50% LL(%) PL(%) PL(%) PI Natural Soil 54.7 21.2 33.5 lime10% 24.50% 1.63 Natural Soil with Lime 5(%) 48.4 19.3 29.1 21.50% 1.66 Natural Soil with Lime 10(%) 46.8 21.5 25.3 Figure 7 Comparison Results of Atterberg Limit Tests Figure 7 Comparison Results of Atterberg Limit Tests Figure 10 Comparison Results of Maximum Dry Density Figure 10 Comparison Results of Maximum Dry Density B.Compaction Tests for Studied Soil with Lime 5% and 10% In this study, the clayey soil with lime 5% and 10% are identified by compaction test to increase its strength. identified by compaction test to increase its strength. Compaction Tests for Studied Soil with Lime 5% and In this study, the clayey soil with lime 5% and 10% are Figure 11 Comparison Results of Optimum Moisture Content Content California Bearing Ratio (CBR) Test for Studied Soil with Lime 5% and 10% In this study, the clayey soil with lime 5% and 10% are evaluated with California Bearing Ratio (CBR) Test to classify the quality of soil for pavement of the fields. Figure 11 Comparison Results of Optimum Moisture C.California Bearing Ratio (CBR) Test for Studied with Lime 5% and 10% In this study, the clayey soil with lime 5% and 10% are evaluated with California Bearing Ratio (CBR) Test to classify the quality of soil for pavement of the fields. Figure 8. Determination of Water Content and Dry Density of Studied Soil with Lime 5% From the above Figure, the maximum dry density is 1 g/cm3 the optimum moisture content of 21.5%. Figure 8. Determination of Water Content and Dry Density of Studied Soil with Lime 5% From the above Figure, the maximum dry density is 1.66 21.5%. @ IJTSRD | Unique Paper ID – IJTSRD27871 27871 | Volume – 3 | Issue – 5 | July - August 2019 August 2019 Page 2003
International Journal of Trend in Scientific Research and D International Journal of Trend in Scientific Research and Development (IJTSRD) @ www.ijtsrd.com www.ijtsrd.com eISSN: 2456-6470 Table8. CBR Results of 5% Lime at OMC 8. CBR Results of 5% Lime at OMC Conclusion In this study, soil sample is taken from Madaya Soil classification is firstly made to know the physical properties of soil. By performing the tests, it can be seen that the studied soil is a type of clay. In this study, the studied soil is clayey soil so it improves their engineering propert greatly upon addition of lime which are arranged from 5% to 10% for stabilization. Atterberg limit test is performed to know physical properties of soil test and CBR test are performed to obtain mechanical properties of soil-lime mixtures. From the test results, liquid limit of soil lime contents 5% and 10% are 48.4% and 46.8% respectively. Thus, liquid limits of mixtures are generally 12% and 14% lower than that of natural soil. The plasticity index of lime content 5% and 10% of mixtures are 29.1% and 25.3% respectively. Therefore, plasticity index of mixtures are generally 13% and 25% lower than that of natural soil. The maximum dry density is 1.66 g/cm 5% mixture and 1.63 g/cm3 at lime 10% mixture. dry density of lime 10% treated clayey soils is lower than that of soil-lime mixture with lime 5%. The optimum moisture contents of soil-lime mixtures with lime 5% and 10% are 21.5% and 24.5% respectively. Optimum moisture contents of lime 10% treated clayey soils is higher than that of soil-lime mixture with lime 5%. When lime content 5% and 10% are added to clayey soils, CBR value of soil 5% mixture is 55.9% rated as good for base course and that of soil-lime 10% mixture is 44.9% which is go sub-base course. So, the CBR values of soil 71.4% and 64.4% higher than that of studied soil. Among them, maximum CBR value is found at soil with lime 5% in this study. So, it should be selected for the street, road and highway in economical point of view. REFERENCES [1][78 Jos] Joseph E. Bowels. Engineering Properties of Soils and Their Measurement. Second Edition.USA. MC Graw-Hill, Inc(1978) In this study, soil sample is taken from Madaya Township. Soil classification is firstly made to know the physical properties of soil. By performing the tests, it can be seen that the studied soil is a type of clay. In this study, the studied soil is clayey soil so it improves their engineering properties greatly upon addition of lime which are arranged from 5% to 10% for stabilization. Atterberg limit test is performed to know physical properties of soil-lime mixtures. Compaction test and CBR test are performed to obtain mechanical ime mixtures. Penetration (mm) Load (kg) CBR% 0 0 0.5 1 1.5 2 2.5 3 4 5 7.5 10 12.5 244 457 600 695 766 823 919 987 1114 1214 1303 55.9 48 42.4 38.2 36.2 From the test results, liquid limit of soil-lime mixtures of lime contents 5% and 10% are 48.4% and 46.8% respectively. Thus, liquid limits of mixtures are generally 12% and 14% lower than that of natural soil. The plasticity and 10% of mixtures are 29.1% and 25.3% respectively. Therefore, plasticity index of mixtures are generally 13% and 25% lower than that of natural soil. The maximum dry density is 1.66 g/cm3 at lime at lime 10% mixture. Maximum dry density of lime 10% treated clayey soils is lower than lime mixture with lime 5%. The optimum lime mixtures with lime 5% and 10% are 21.5% and 24.5% respectively. Optimum moisture ted clayey soils is higher than that lime mixture with lime 5%. When lime content 5% and 10% are added to clayey soils, CBR value of soil- lime 5% mixture is 55.9% rated as good for base course and that lime 10% mixture is 44.9% which is good for base and base course. So, the CBR values of soil-lime mixtures are 71.4% and 64.4% higher than that of studied soil. Among them, maximum CBR value is found at soil-lime mixtures with lime 5% in this study. So, it should be selected for the t, road and highway in economical point of view. According to the test, the value of CBR test for soil mixtures is 55.9% as shown in Table8. So, it is excellent used for base course. Table9. CBR Results of 10% Lime at OMC Penetrations (mm) Load (kg) 0 0.5 1 1.5 2 2.5 3 4 5 7.5 10 12.5 The result of CBR test is 44.9% for soil- lime 10% mixture in Table9. Therefore, this is good for both base and sub course of road. Table10 Comparison results of CBR Test between Soil and Various Mixture of Soil-Lime Soil-Lime (%) Natural Soil Lime 5% CBR (%) 16.0 , the value of CBR test for soil-lime (5%) 8. So, it is excellent used 9. CBR Results of 10% Lime at OMC CBR% 0 130 299 436 539 615 676 784 877 1069 1227 1263 44.9 42.7 40.6 38.6 35.1 lime 10% mixture in 9. Therefore, this is good for both base and sub-base [78 Jos] Joseph E. Bowels. Engineering Properties of Soils and Their Measurement. Second Edition.USA. MC 10 Comparison results of CBR Test between Natural [2][05 Thu] Thu Zar Win. Ma. Study on Engineering Properties of Clay tre Department of Civil Engineering MTU (2005) Department of Civil Engineering MTU (2005) [05 Thu] Thu Zar Win. Ma. Study on Engineering Properties of Clay treated with Lime. ME Thesis. Lime 5% Lime 10% 55.9 44.9 [3]Braja M. Das,: Advanced Soil Mechanics, Third Edition. (2008) Braja M. Das,: Advanced Soil Mechanics, Third Edition. [4]Braja M. Das,: Principal of Geotechnical Engineering, Seventh Edition. California Sacramento, PWS Publishi , PWS Publishing Company (2010). Braja M. Das,: Principal of Geotechnical Engineering, Seventh Edition. California State State University, University, Figure 12 Comparison Results of CBR Test Figure 12 Comparison Results of CBR Test @ IJTSRD | Unique Paper ID – IJTSRD27871 27871 | Volume – 3 | Issue – 5 | July - August 2019 August 2019 Page 2004