Download
1 / 7
90 likes | 114 Views
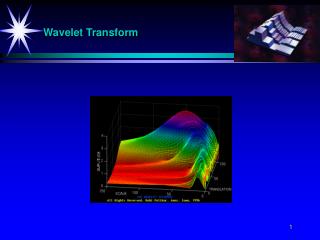
Wavelets are mathematical functions. The wavelet transform is a tool that cuts up data, functions or operators into different frequency components and then studies each component with a resolution matched to its scale. It is needed, because analyzing discontinuities and sharp spikes of the signal and applications as image compression, human vision, radar, and earthquake prediction. Wai Mar Lwin | Thinn Aung | Khaing Khaing Wai "Applications of Wavelet Transform" Published in International Journal of Trend in Scientific Research and Development (ijtsrd), ISSN: 2456-6470, Volume-3 | Issue-5 , August 2019, URL: https://www.ijtsrd.com/papers/ijtsrd27958.pdf Paper URL: https://www.ijtsrd.com/mathemetics/applied-mathematics/27958/applications-of-wavelet-transform/wai-mar-lwin<br>

E N D
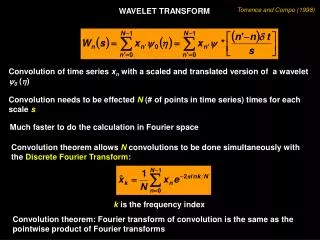
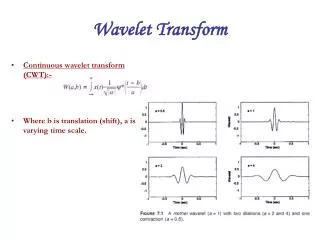
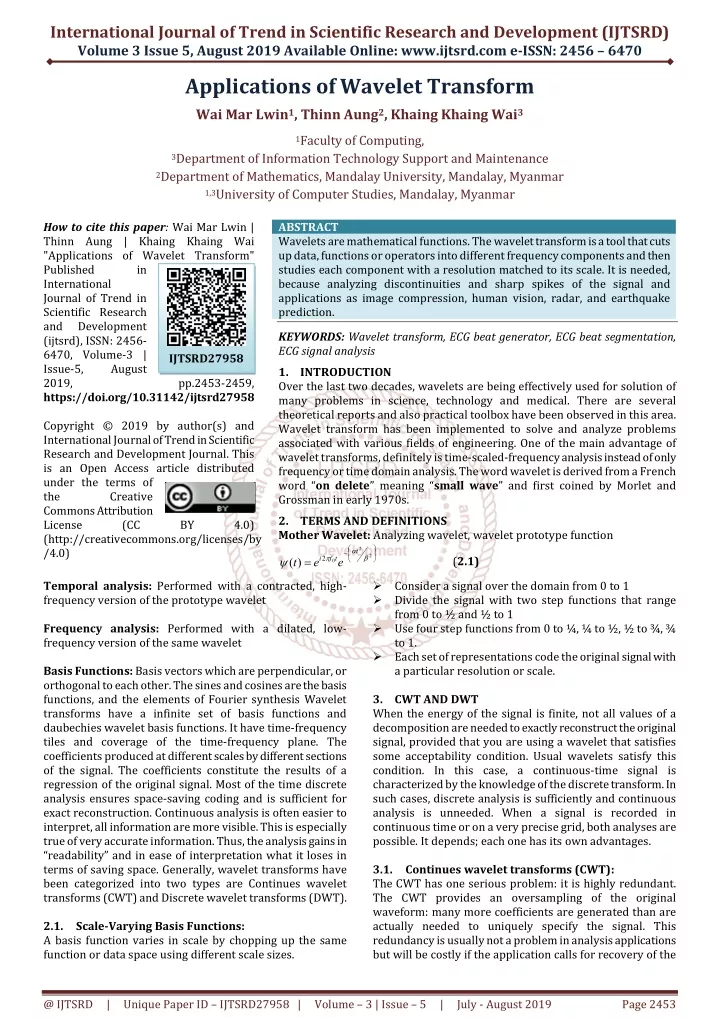
International Journal of Trend in Scientific Research and Development (IJTSRD) Volume 3 Issue 5, August 2019 Available Online: www.ijtsrd.com e-ISSN: 2456 – 6470 Applications of Wavelet Transform Wai Mar Lwin1, Thinn Aung2, Khaing Khaing Wai3 1Faculty of Computing, 3Department of Information Technology Support and Maintenance 2Department of Mathematics, Mandalay University, Mandalay, Myanmar 1,3University of Computer Studies, Mandalay, Myanmar How to cite this paper: Wai Mar Lwin | Thinn Aung | Khaing Khaing Wai "Applications of Wavelet Transform" Published in International Journal of Trend in Scientific Research and Development (ijtsrd), ISSN: 2456- 6470, Volume-3 | Issue-5, August 2019, https://doi.org/10.31142/ijtsrd27958 Copyright © 2019 by author(s) and International Journal of Trend in Scientific Research and Development Journal. This is an Open Access article distributed under the terms of the Creative Commons Attribution License (CC (http://creativecommons.org/licenses/by /4.0) Temporal analysis: Performed with a contracted, high- frequency version of the prototype wavelet Frequency analysis: Performed with a dilated, low- frequency version of the same wavelet Basis Functions: Basis vectors which are perpendicular, or orthogonal to each other. The sines and cosines are the basis functions, and the elements of Fourier synthesis Wavelet transforms have a infinite set of basis functions and daubechies wavelet basis functions. It have time-frequency tiles and coverage of the time-frequency plane. The coefficients produced at different scales by different sections of the signal. The coefficients constitute the results of a regression of the original signal. Most of the time discrete analysis ensures space-saving coding and is sufficient for exact reconstruction. Continuous analysis is often easier to interpret, all information are more visible. This is especially true of very accurate information. Thus, the analysis gains in “readability” and in ease of interpretation what it loses in terms of saving space. Generally, wavelet transforms have been categorized into two types are Continues wavelet transforms (CWT) and Discrete wavelet transforms (DWT). 2.1.Scale-Varying Basis Functions: A basis function varies in scale by chopping up the same function or data space using different scale sizes. ABSTRACT Wavelets are mathematical functions. The wavelet transform is a tool that cuts up data, functions or operators into different frequency components and then studies each component with a resolution matched to its scale. It is needed, because analyzing discontinuities and sharp spikes of the signal and applications as image compression, human vision, radar, and earthquake prediction. KEYWORDS: Wavelet transform, ECG beat generator, ECG beat segmentation, ECG signal analysis 1.INTRODUCTION Over the last two decades, wavelets are being effectively used for solution of many problems in science, technology and medical. There are several theoretical reports and also practical toolbox have been observed in this area. Wavelet transform has been implemented to solve and analyze problems associated with various fields of engineering. One of the main advantage of wavelet transforms, definitely is time-scaled-frequency analysis instead of only frequency or time domain analysis. The word wavelet is derived from a French word “on delete” meaning “small wave” and first coined by Morlet and Grossman in early 1970s. 2.TERMS AND DEFINITIONS Mother Wavelet: Analyzing wavelet, wavelet prototype function ) ( e e t (2.1) Consider a signal over the domain from 0 to 1 Divide the signal with two step functions that range from 0 to ½ and ½ to 1 Use four step functions from 0 to ¼, ¼ to ½, ½ to ¾, ¾ to 1. Each set of representations code the original signal with a particular resolution or scale. 3.CWT AND DWT When the energy of the signal is finite, not all values of a decomposition are needed to exactly reconstruct the original signal, provided that you are using a wavelet that satisfies some acceptability condition. Usual wavelets satisfy this condition. In this case, a continuous-time signal is characterized by the knowledge of the discrete transform. In such cases, discrete analysis is sufficiently and continuous analysis is unneeded. When a signal is recorded in continuous time or on a very precise grid, both analyses are possible. It depends; each one has its own advantages. 3.1.Continues wavelet transforms (CWT): The CWT has one serious problem: it is highly redundant. The CWT provides an oversampling of the original waveform: many more coefficients are generated than are actually needed to uniquely specify the signal. This redundancy is usually not a problem in analysis applications but will be costly if the application calls for recovery of the IJTSRD27958 pp.2453-2459, BY 4.0) 2 t 2 i 2 f t 0 @ IJTSRD | Unique Paper ID – IJTSRD27958 | Volume – 3 | Issue – 5 | July - August 2019 Page 2453
International Journal of Trend in Scientific Research and Development (IJTSRD) @ www.ijtsrd.com eISSN: 2456-6470 original signal. For recovery, all of the coefficients will be required and the computational effort could be excessive. In applications that require bilateral transformations, we would prefer a transform that produces the minimum number of coefficients required to recover accurately the original signal. s how to sub-sample the time-scale plane, the name DWT is usually reserved for a specific setting [15]: The time-scale plane is only evaluated for dyadic scales am and sampling points bm,n, am = 2m , bm,n = amnT = 2mnT, m, n eZ T =1fs. Wavelets are restricted to functions which form an orthonormal Basis (ONB) for the space of interest, which is L2(R) for our considerations. The wavelet used for analysis must be of compact support, i.e., it is only non-zero for a specific interval. 3.3.Numerical Solution For any basic function OM and POM may be computed corresponding to 2M collection points. In general we can say that the decomposition of f(t), (k is parameter of transition): 1 0 n m 0 ) c ( scale , position ) f ( t ( scale , position ) 1 (3.1) s ) CWT ( s , ) x ( t ( t ) dt , x where “ ” is a variable that indicates the transition of the mother wavelet and “s” is a variable for scale of the mother wavelet ) (t . 3.2.Discrete wavelet transforms (DWT): The discrete wavelet transform (DWT) achieves this requirement by restricting the variation in translation and scale, usually to power of 2. When the scale is changed in powers of 2, the discrete wavelet transform is sometimes termed the dyadic wavelet transform. The DWT may still require redundancy to produce a bilateral transform unless the wavelet is carefully chosen such that it leads to an orthogonal family. In this case, the DWT will produce a nonredundant, bilateral transform [Wickerhauser, 1994]. In the DWT, a new concept is introduced termed the scaling function, a function that facilitates computation of the DWT. To implement the DWT efficiently, the finest resolution is computed first. The computation then proceeds to coarser resolutions, but rather than start over on the original waveform, the computation uses a smoothed version of the fine resolution waveform. This smoothed version is obtained with the help of the scaling function. In fact, the scaling function is sometimes referred to as the smoothing function. The definition of the scaling function uses a dilation or a two- scale difference equation: where c(n) is a series of scalars that defines the specific scaling function. This equation involves two time scales (t and 2t) and can be quite difficult to solve. In the DWT, the wavelet itself can be defined from the scaling function: ) 2 ( ) ( 2 ) ( n t n d t n where d(n)is a series of scalars that are related to the waveform x(t) and that define the discrete wavelet in terms of the scaling function. j k 3.2.1.Discrete Wavelet Multiresolution Analysis Due to the fact that the information carried by CWT- coefficients is extremely redundant7, one could think of evaluating the transformation integral only for a subset of scales am and translations bm, n. This means that the timescale plane is sub-sampled for certain scales and time points. However, the transformation should still be invertible, leading to restrictions for the sampling points and the wavelets themselves. Although there exist different ways k 1 2 M 1 (3.5) . f ( t ) C ( t ) C ( t ) n , m n , m 1 (3.6) . f ( t ) dt P ( t ) 3.3.1.Stationary Discrete Wavelet Transform Due to the dyadic down-sampling, which is performed for calculating DWT coefficients, the DWT clearly lacks translation invariance [16]. Translation invariance means that shifting the input signal x[n] by an arbitrary amount of samples simply leads to a shift of the output by the same amount of samples. However, dyadic down-sampling of an exemplary sequence x[n] leads to a different result than for the case that the input signal is shifted by one, [· · · , 0, 0, 0, 1, 1, 1, 0, 0, 0, · · · ] | #2 0{,0z,1,0,0 } vs. [· · · , 0, 0, 1, 1, 1, 0, 0, 0, 0, · · · ] | #2 0{,1z,1,0,0 } Consequently the wavelet and approximation coefficients differ as well. For the stationary discrete wavelet transform (SDWT) the scales are still dyadic, but the translation parameter is not down-sampled anymore (Figure 1). (3.2) 2 ( ( t ) 2 c ( n ) t n ) n (3.3) Figure1: Sub-sampling of the time-scale plane for the SDWT. White circles indicate additional points compared to the DWT. This means that the wavelet coefficients dm[n] and the approximation coefficients cm[n] are now determined for every sample n. Instead of down sampling the signal, as it is done for the DWT, the filter coefficients are now up-sampled as shown for the Haar wavelet in Figure 2. This filter- bank implementation is called Algorithme `a Trous9 and also allows perfect reconstruction as demonstrated for the Haar wavelet in Figure 3. We observe that all parallel paths in Figure 2, which are often referred to as low-pass and high- pass half-band filters, add up to an all-pass in the frequency domain. This means, that we overcome the DWT’s lack of translation invariance by adding redundant information (and destroying orthogonality). (3.4) j 2 j W ( j , k ) f ( x 2 ) 2 ( x k ) Transform and @ IJTSRD | Unique Paper ID – IJTSRD27958 | Volume – 3 | Issue – 5 | July - August 2019 Page 2454
International Journal of Trend in Scientific Research and Development (IJTSRD) @ www.ijtsrd.com eISSN: 2456-6470 Basic procedures during a heart cycle A.Overview of chambers and type of cells. B.Atrial depolarization (P wave). C.Origin of the PR segment (Delay due to the AV node). D.Ventricular depolarization (QRS complex) 5.WAVELET ANALYSIS IN BIOMEDICAL SIGNAL PROCESSING Wavelet analysis in biomedical signal processing ranges from the analysis of the more traditional physiological signals such as the electrocardiogram(ECG), to the very recent imaging modalities including positron emission tomography(PET) and magnetic resonance imaging(MRI) [Wright, 2000]. It is used usually to remove noise, artefacts, or transient features. In ECG processing, the wavelet analysis is used for QRS detection [Li et al., 1995]. In heart sound analysis, the WT is a useful tool for the time-frequency analysis and characterization of the murmurs, which are primarily caused by blood flow turbulence and characteristic of cardiac disease such as aortic stenosis or valve defects [Khadra et al., 1991].In the process of heart disease diagnosis, detection for ECG signal is an important aspect, but the noise of ECG signal is very strong. In order to filter noise of ECG signal effectively and demarcate characteristic points of signal accurately, the denoising algorithm of wavelet transform with threshold and algorithm of modulus maximum-minimum based on wavelet transform to process ECG signal are adopted. The data of MIT/ BIH is used to test the algorithm by simulating. The experimental results show the noise is removed effectively, while the ECG signal is reserved, and feature point can be accurately demarcated, so the efficiency of heart disease diagnoses should be enhanced. ECG Signal Processing, Classification and Interpretation strives to articulate several focal points: Fundamental ideas of Computational Intelligence (CI) together with the relevant principles of data acquisition morphology and use of diagnosis; Techniques and models of CI that are suitable for signal processing; and ECG system-diagnostic interpretation and knowledge acquisition architectures. Systematic exposure of the concepts, design methodology, and detailed algorithms are offered. The individual chapters come with a clearly delineated agenda and a well-defined focus. 5.1.Artificial ECG Beats - GECG2O The GECG2O can be used to test the algorithm’s ability to recognize different morphologies and to correctly extract the corresponding ECG characteristic points for these cases. The most interesting ECG morphologies, such as biphasic waves or variations of the QRS complex, were already introduced in Section 3.3. These test cases were generated via the GECG2O and were successfully processed by the ECG delineation algorithm. Hence, the ability of the algorithm to extract ECG characteristic points for various types of ECG beats was already shown in the sections above and will not be Figure2: Illustration of the SDWT for the Haar Wavelet. A.Decomposition of the sequence x[n] into its wavelet and approximation coefficients (d1 - d3, a3) and B.Reconstruction of the sequence by applying the inverse Transform Figure3: Haar wavelet filters in the frequency domain: Adding up the magnitude responses of the parallel paths results in an all-pass illustrating the possibility 4.APPLIED FIELDS USING WAVELETS Acoustics Astronomy Nuclear engineering Signal and Image processing Neurophysiology Music Magnetic resonance imaging Speech discrimination, Optics Fractals, Turbulence Earthquake-prediction Radar Human vision Pure mathematics applications such as solving partial differential equations @ IJTSRD | Unique Paper ID – IJTSRD27958 | Volume – 3 | Issue – 5 | July - August 2019 Page 2455
International Journal of Trend in Scientific Research and Development (IJTSRD) @ www.ijtsrd.com eISSN: 2456-6470 repeated. Instead, the suitability of the algorithm to detect minimal relative alternations in a patient’s ECG before and after an event (cmp. Figure 4) is illustrated. For that reason the following test scenario is defined: segment and the amplitude of the P wave as a representative for all other parameters. The onset of the P wave was left constant, while the onset of the QRS complex was varied as shown in Table [1] in order to achieve the desired variation of the PR interval. The lower and the upper limits were defined via the GECG2O, while mean and standard deviation of the parameters were calculated as described in Section 3.2.4. We then created 500 ECG beats (approximately 10 minutes) covered in Gaussian noise with SNR = 30 dB for each set. All EC characteristic points were extracted by applying the ECG delineation algorithm. Figure [5] shows a set of randomly picked beats of every set, whereas we observe that there is no obvious difference between these sequences at first glance. The zoom level of the ECG series shown in Figure [5] should be approximately equal to the zoom level of common ECG monitors in hospitals. The extracted ECG characteristic points were compared via estimated probability density functions (pdf) and a two- sample t-Test 9. 5.3.Data Generation Table [1].:Lower and upper limits (LL, UL) for onset of the QRS complex, ST offset and amplitude of the P wave defined via GECG2O. The limits for the PR interval result from QRSon and a constant Pon = 196 mV Figure4: Automatic evaluation of ECG characteristic points 5.2.Minimal prolongation of the PR interval and minimal elevation of the ST segment: The PR interval is an important clinical parameter for the assessment of conduction disturbances. A very popular example is the so called first degree atrio-ventricular block caused by a conduction disturbance in the AV node or the bundle of His (for more details see [9]). This atrio- ventricular block results in a prolongation of the PR interval. Minimal changes of the PR interval over time might provide important information regarding the patient’s state of health for the physician. Hence, it makes sense to detect minimal relative changes of the PR interval. ST segment elevation can be an important indicator for anterior or myocardial infarction as well as for ischemic cardiac diseases (for more details see [9]). Therefore minimal relative changes of the ST level also provide important information for the physician. In order to illustrate the algorithm’s ability to detect minimal relative changes of these parameters, two data sets were created. The first simulates the patient’s ECG before an specific event (normal PR interval, normal ST level) and the second simulates the ECG after a specific event (longer PR interval, ST level elevated). The combination of a prolonged PR interval and the elevation of the ST level does not have a specific medical meaning. These parameters were simply chosen since they have shown to be clinically useful for physicians. The two test ECG sequences were generated as described in Section 3.2.4, whereas lower and upper bounds for all important ECG parameters were defined. These limits do not have a specific meaning, but were chosen to be realistic. Except for the starting point of the QRS complex and the offset of the ST segment (ST level), the boundaries do not differ for the first and second data set. Table [1] shows the chosen parameter setting for the onset of the QRS complex (and the resulting PR interval), the level of the ST Figure 5: Artificially generated noisy ECG with no obvious difference at first glance. (a) Normal PR interval, normal ST level and (b) prolonged PR interval and ST elevation Calculating the CWT of a short sequence The following example, inspired by [14], demonstrates the working principle of the CWT by using the popular Haar wavelet, defined as t 2 1 ) ( 1 0 , 1 1 0 t , t 1 2 , otherwise and shown in Figure 6 (a). The Haar wavelet will be used for explanations throughout this chapter, since it fulfills all requirements for the CWT as well as the DWT. However, it should be mentioned that this wavelet is not of great importance in practice, because of its bad properties in the frequency domain. Nevertheless, due to its simple shape, the Haar wavelet is suited very well for explaining mechanisms, @ IJTSRD | Unique Paper ID – IJTSRD27958 | Volume – 3 | Issue – 5 | July - August 2019 Page 2456
International Journal of Trend in Scientific Research and Development (IJTSRD) @ www.ijtsrd.com eISSN: 2456-6470 which can be applied on more complicated wavelets, e.g., on the complex Morlet wavelet (Figure 6 (b)). Time (or) Space Figure 7: CWT of a short sequence using the Haar wavelet has to hold and it can be shown that |Y(w)| has to decrease significantly for |w|!• [12]. This means that the Fourier transform of y(t) corresponds to a band-pass spectrum, whereas the center frequency and the bandwidth are determined by the scaling factor a. Difference to the STFT In the following, the difference of the CWT to the well known STFT is illustrated. For that reason a very popular and probably the most often used Wavelet for signal analysis is chosen. This so called complex Morlet wavelet4, shown in Figure 6 (b), is a modulated Gaussian function, defined 2 2 ) ( e e t The according WT of the signal x(t), Figure 6: Exemplary wavelets, (a) Real valued Haar wavelet and (b) Complex valued Morlet wavelet Example: Given is a signal x(t) = s(t − 3) − s(t − 6), where s represents the step function. We want to determine the CWT based on the Haar wavelet for the scales a = 1 to 6, choosing the sampling frequency fs = 40Hz in order to obtain a sufficiently good approximation of the CWT. First, the signal x(t) and the Haar wavelet are sampled, leading to the discrete sequence x[n] as well as to discrete versions of the (dilated) wavelet functions shown in Table [2] (only integer scales are represented). Subsequently the CWT is calculated either by correlating the sequence x[n] with the discretized wavelet functions or by convolving x[n] with their time reverse. Thus, the time-reverse of a discretized wavelet function defines its wavelet filter coefficients for a given a. The CWT can then be determined simply by filtering x[n] with these wavelet filters. In order to ensure correct energy representation the result has to be divided by the square root of the scale. t j t 2 0 2 t b 2 t b a 1 j 0 a W ( b , a ) a x ( t ) e e dt 2 2 1 2 1. scaling the window via a 2. scaling the frequency via a is very similar to the Gabor transformof x(t), 1 2 1. fixed window size defined by b 2. modulation with specific frequency The evaluation of these two equations again corresponds to simple bandpass filtering (evaluated at a specific scale a, in case of the WT, and for a specific frequency w, in case of the Gabor transform). To stay mathematically correct, we have to adapt , such that Table [2]: Wavelet functions y(t) for the Haar wavelet filter (scales 1-6). Non-integer dilations are not represented in this table Figure [7] shows the resulting scalogram when calculating the CWT of the sequence x[n] for scales a = 1 to 6. Bright spots indicate a high correlation at a specific scale and time instant. Maximum values occur at scale 6 and time instant 3 s as well as 6 s (the latter case is shown at the top to the right in Figure [7]. It is obvious that the highest correlation occurs for this time-scale setting. Additionally at the top-left of Figure [7] the calculation for another specific time-scale combination is illustrated. Requirements a wavelet needs to fulfill for the CWT To be categorized as wavelet, a function basically has to satisfy the admissibility condition Cy = Z • −• |Y(w)|2 |w| dw < •, (2.4) where Y(w) represents the Fourier transform of the wavelet y(t). This condition has to be fulfilled in order to allow a flawless inverse WT (for more information see [13]). To satisfy (7) Y(0) = Z • −• y(t) dt =0. .For complex valued wavelets we would also have to take the complex conjugate. 3High scales (representing low frequencies) are placed at the bottom of the y axis while low scales (representing high frequencies) are placed at the top. j ) t G ( b , ) x ( t ( t b ) e dt 2 2 2 t b j t x ( t ) e e dt 2 t b 2 t b a 2 1 j 0 a W ( b , a ) a x ( t ) e e dt 2 a a a a x x h(b-t) 1 and , such that ax ( x ( b ) * h ( b )) 2 2 2 t 2 b , j b j ( b t ) G ( b ) e x ( t ) e e dt x x g(b-t) j b e ( x ( b ) * g ( b )) x @ IJTSRD | Unique Paper ID – IJTSRD27958 | Volume – 3 | Issue – 5 | July - August 2019 Page 2457
International Journal of Trend in Scientific Research and Development (IJTSRD) @ www.ijtsrd.com eISSN: 2456-6470 REFERENCES 7. [1]Statistik Austria, “Demographische Prognosen,” http://www.statistik. de/statistiken/bevoelkerung/demographische prognosen/ index.html,2013. [2]G. D. Clifford, F. Azuaje, and P. McSharry, Advanced Methods and Tools for ECG Data Analysis. Norwood, MA, USA: Artech House, Inc., 2006. [3]C. Li, C. Zheng, and C. Tai, “Detection of ECG characteristic points using wavelet transforms,” In IEEE Transactions on Biomedical Engineering, Vol. 42, No. 1, pp. 21–28, January 1995. [4]J. Martinez, R. Almeida, S. Olmos, A. Rocha, and P. Laguna, “A waveletbased ECG delineator: evaluation on standard databases,” In IEEE Transactions on Biomedical Engineering, Vol. 51, No. 4, pp. 570–581, April 2004. [5]P. Laguna, R. G. Mark, A. Goldberg, and G. B. Moody, “A database for evaluation of algorithms for measurement of QT and other waveform intervals in the ECG,” In Proceedings of the Computers in Cardiology (CinC 1997). IEEE, 1997, pp. 673–676. [6]A. L. Goldberger, L. A. Amaral, L. Glass, J. M. Hausdorff, P. C. Ivanov, R. G. Mark, J. E. Mietus, G. B. Moody, C.-K. Peng, and H. E. Stanley, “Physiobank, physiotoolkit, and physionet components of a new research resource for complex physiologic signals,” In Circulation, Vol. 101, No. 23, pp. e215–e220, 2000. [7]E. A. Ashley and J. Niebauer, Cardiology explained. Remedica, 2004. [8]F. Freytag, EKG im Rettungs-und Notdienst. Schattauer Verlag, 2010. [9]M. S. Thaler, The only EKG book you’ll ever need. Lippincott Williams & Wilkins, 2015.91 Bibliography [10]J. Wasilewski and L. Polo ´ nski, “An Introduction to ECG Interpretation,” In ECG Signal Processing, Classification and Interpretation, A. Gacek and W. Pedrycz, Eds. Springer London, 2012, pp. 1–20. [11]H.-P. Schuster and H.-J. Trappe, EKG-Kurs f ¨ur Isabel. Georg Thieme Verlag, 2005. [12]M. Huemer, “Anwendung von Wavelets in der Automatisierungstechnik,” Master’s thesis, Johannes Kepler Universit¨at, Austria, 1995. [13]A. Mertins, Signaltheorie: Signalbeschreibung, Filterb ¨anke, Wavelets, Zeit- Frequenz-Analyse, Parameter-und Signalsch¨ atzung. Wiesbaden: Springer Vieweg, 2013. [14]D. L. Fugal, Conceptual wavelets in digital signal processing: an in-depth, practical approach for the non-mathematician. Space & Signals Technical Pub., 2009. [15]A. Teolis, Computational signal processing with wavelets. Springer Science & Business Media, 2012. [16]P. S. Addison, “Wavelet transforms and the ECG: a review,” In Physiological Measurement, Vol. 26, No. 5, p. R155, 2005. [17]S. G. Mallat, “Multiresolution approximations and wavelet orthonormal bases of L2(R),” In Transactions of the American Mathematical Society, Vol.315, No. 1, pp. 69–87, 1989. [18]——, “A theory for decomposition: the wavelet representation,” In Pattern j b e The factor now, since it only influences the phase delay and we are just interested in the magnitude response in this case. The resulting complex valued filters g(t) and h(t) are shown for two specific analysis frequencies at the top of Figure [8]. We can observe that for the STFT only the frequency of the enclosed exponential function is changed, without changing the width of the window itself. Hence, the bandwidth of the according band-pass filters does not change and the time- frequency resolution is constant for all frequencies (Figure [8] (b),(c) - left). In contrast, for h(t) both, the window and the frequency of the enclosed exponential function are scaled as shown on the right side of Figure [8] (a). Due to a shorter window length for higher frequencies, the time resolution of the WT increases as the frequency increases and vice versa. Fast transient changes in the signal usually correspond to high frequencies in the signal. Hence, the WT with its higher time resolution for high frequencies is in general better suited to detect such fast transient changes in the signal than the STFT. However, as can be observed on the right side of Figure [8] (b) and (c), the frequency resolution clearly decreases for increasing frequencies. Summing up, a very important difference of the STFT and the WT is the way they deal with the so called Gabor limit6. Which strategy is better suited depends on the application. The following example shows a scenario which emphasizes the advantages and disadvantages of the CWT and the STFT (inspired by [13]). in the latter equation can be neglected for x at/web Grundlagen der Figure 8: Comparison of the Gabor transform and the WT. (a) Filters in time domain for lower and higher frequencies. (b) Filters in the frequency domain (magnitude response). (c) Illustration how the STFT and the WT deal with the Gabor limit 6. We have used the discrete and continuous wavelet transform to resolve many problems in biomedical. The DWT in combination with the CWT prove that they can be used as tool for seismic data denoising. Based on the wavelet analysis, a classification system has been constructed that reliably separates groups of healthy and sick patients. Positive results of testing show that high frequency ECG wavelet-components carry essential diagnostic information concerning ECG. CONCLUSION multiresolution signal @ IJTSRD | Unique Paper ID – IJTSRD27958 | Volume – 3 | Issue – 5 | July - August 2019 Page 2458
International Journal of Trend in Scientific Research and Development (IJTSRD) International Journal of Trend in Scientific Research and Development (IJTSRD) @ www.ijtsrd.com www.ijtsrd.com eISSN: 2456-6470 Analysis and Machine Intelligence, IEEE Transactions on, Vol. 11, No. 7, pp. 674–693, July 1989. [19]——, A wavelet tour of signal processing: the sparse way. Academic press, 2008. [20]G. Strang and T. Nguyen, Wavelets and filter banks. SIAM, 1996. [21]W. Sweldens and R. Piessens, “Wavelet sampling techniques,” In Proceedings of the Computing Section, 1993, pp. 20-29. [22]S. G. Mallat, “Multifrequency channel decompositions of images and wavelet models,” In IEEE Transactions on Acoustics, Speech and Signal Processing, Vol. 37, No. 12, pp. 2091–2110, December 1989. [23]W. B¨ani, Wavelets: eine Einf ¨uhrung f ¨ur Ingenieure. Oldenbourg Verlag, 2005. [24]B. Scheller, G. Pipa, H. Kertscho, P. Lauscher, J. Ehrlich, O. Habler, K. Zacharowski, and J. Meier, “Low hemoglobin levels during normovolemia are associated with electrocardiographic changes in pigs,” In Shock, Vol. 35, No. 4, pp. 375–381, 2011. [25]B. Gramatikov, J. Brinker, S. Yi-Chun, and N. V. Thakor, “Wavelet analysis and time-frequency distributions of the body surface ECG before and after angioplasty,” In Computer Methods and Programs in Biomedicine, Vol. 62, pp. 87–98, 2000. [26]A. Koeleman, H. Ros, and T. Van den Akker, “Beat beat interval measurement in the electrocardiogram,” In Medical and Biological Engineering and Computing, Vol. 23, No. 3, pp. 213–219, 1985. [27]E. Mazomenos, T. Chen, A. Acharyya, A. Bhattacharya, J. Rosengarten, and K. Maharatna, “A Time Morphology and Gradient based algorithm for ECG feature extraction,” In Proceedings of the IEEE International Conference on Industrial Technology (ICIT’2012), March 2012, pp. 117–122. [28]R. Andreao, B. Dorizzi, and J. Boudy, “ECG signal analysis through hidden Markov models,” In IEEE Transactions on Biomedical Engineering, Vol. 53, No. 8, pp. 1541–1549, August 2006. [29]Z. Dokur, T. O¨ lmez, E. Yazgan, and O. K. Ersoy, “Detection of ECG waveforms by neural networks,” In Medical engineering & physics, Vol. 19, No. 8, pp. 738 741, 1997. [30]V. Afonso, W. J. Tompkins, T. Nguyen, and S. Luo, “ECG beat detection using filter banks,” In IEEE Transactions on Biomedical Engineering, Vol. 46, No. February 1999. [31]P. Laguna, R. Jan´e, and P. Caminal, “Automatic detection of wave boundaries in multilead ECG signals: validation with the CSE database,” In Computers and biomedical research, Vol. 27, No. 1, pp. 45 [32]T. Ince, S. Kiranyaz, and M. Gabbouj, “A Generic and Robust System for Automated Patient Classification of ECG Signals,” In IEEE Transactions on Biomedical Engineering, Vol. 56, No. 5, pp. 1415 May 2009. [33]Y. Kutlu and D. Kuntalp, “Feature extraction for ECG heartbeats using higher order statistics of WPD coefficients,” In Computer methods and programs in biomedicine, Vol. 105, No. 3, pp. 257– [34]O. Inan, L. Giovangrandi, and G. Kovacs, “Robust Neural-Network- Based Classification of Premature Based Classification of Premature Analysis and Machine Intelligence, IEEE Transactions 693, July 1989. , A wavelet tour of signal processing: the sparse Ventricular Contractions Using Wavelet Transform and Timing Interval Features,” In IEEE Transactions on Biomedical Engineering, Vol. 53, No. 12, pp. 2507 2515, December 2006. [35]Y.-H. Chen and S.-N. Yu, “Selection of effective features for ECG beat recognition based correlations,” In Artificial intelligence in medicine, Vol. 54, No. 1, pp. 43–52, 2012. [36]R. Hoekema, G. J. Uijen, and A. van Oosterom, “Geometrical aspects of the interindividual variability of multilead ECG recordings,” In IEEE Transactions on Biomedical Engineering, Vol. 48, No. 5, pp. 551 May 2001. [37]X. Jiang, L. Zhang, Q. Zhao, and S. Albayrak, “ECG Arrhythmias Recognition Independent Component Analysis Feature Extraction,” In Proceedings of the IEEE TENCON 2006, pp. 1–4. [38]C. Ye, B. Kumar, and M. Coimbra, “Heartbeat Classification Using Morphological and Dynamic Features of ECG Signals,” In IEEE Transactions on Biomedical Engineering, Vol. 59, No. 10, pp. 2930 2941, October 2012. [39]A. Daamouche, L. Hamami, N. Al wavelet optimization approach for ECG signal classification,” In Biomedical Signal Processing and Control, Vol. 7, No. 4, pp. 342 [40]S. Saha and S. Ghorai, “Effect of feature fusion for discrimination of cardiac pathology, the IEEE Third International Conference on Computer, Communication, Control and Information Technology (C3IT’2015), February 2015, pp. 1 [41]T. Tsutsumi, N. Takano, N. Matsuyama, Y. Higashi, K. Iwasawa, and T. Nakajima, “High hidden within QRS complex as an additional predictor of lethal ventricular arrhythmias to ventricular late potential in post–myocardial infarction patients,” In Heart Rhythm, Vol. 8, No. 10, pp. 1509 [42]A. Diery, D. Rowlands, T. R. Cutmore, “Automated ECG diagnostic P wavelets,” In Computer methods and programs in biomedicine, Vol. 101, No. 1, pp. 33 [43]P. McSharry, G. Clifford, L. Tarassenko, and L. Smith, “A dynamical model for electrocardiogram signals,” In IEEE Transactions on Biomedical Engineering, Vol. 50, No. 3, pp. 289 March 2003. [44]J. Sahambi, S. Tandon, and R. Bhatt, “Wavelet based ST segment analysis,” In Medical and Biological Engineering and Computing, Vol. 36, No. 572, 1998. [45]S. Mallat and S. Zhong, “Characterization of signals from multiscale edges,” In IEEE Transactions on Pattern Analysis & Machine Intelligence, No. 7, pp. 710 1992. [46]M. G. Bulmer, Principles of statistics. Courier Corporation, 2012. [47]W. Struhal, A. Javor, C. Brunner, T. Benesch, V. Schmidt, M. R. Vosko, and G. Ransmayr, “The phoenix from the ashes: cardiovascular autonomic dysfunction in behavioral variant of front temporal Journal of Alzheimer’s disease: JAD, Vol. 42, N 1041–1046, 2014. lar Contractions Using Wavelet Transform and Timing Interval Features,” In IEEE Transactions on Biomedical Engineering, Vol. 53, No. 12, pp. 2507– N. Yu, “Selection of effective features for ECG beat recognition based on nonlinear correlations,” In Artificial intelligence in medicine, Vol. 52, 2012. R. Hoekema, G. J. Uijen, and A. van Oosterom, “Geometrical aspects of the interindividual variability of multilead ECG recordings,” In IEEE Transactions on Biomedical Engineering, Vol. 48, No. 5, pp. 551–559, G. Strang and T. Nguyen, Wavelets and filter banks. W. Sweldens and R. Piessens, “Wavelet sampling techniques,” In Proceedings of the Statistical S. G. Mallat, “Multifrequency channel decompositions of images and wavelet models,” In IEEE Transactions on Acoustics, Speech and Signal Processing, Vol. 37, No. X. Jiang, L. Zhang, Q. Zhao, and S. Albayrak, “ECG Arrhythmias Recognition Independent Component Analysis Feature Extraction,” In Proceedings of the IEEE TENCON 2006, November avelets: eine Einf ¨uhrung f ¨ur Ingenieure. System System Based Based on on B. Scheller, G. Pipa, H. Kertscho, P. Lauscher, J. Ehrlich, O. Habler, K. Zacharowski, and J. Meier, “Low hemoglobin levels during normovolemia are associated C. Ye, B. Kumar, and M. Coimbra, “Heartbeat Classification Using Morphological and Dynamic Features of ECG Signals,” In IEEE Transactions on Biomedical Engineering, Vol. 59, No. 10, pp. 2930– hanges in pigs,” In Shock, Chun, and N. V. Thakor, frequency distributions of the body surface ECG before and after angioplasty,” In A. Daamouche, L. Hamami, N. Alajlan, and F. Melgani, “A wavelet optimization approach for ECG signal classification,” In Biomedical Signal Processing and Control, Vol. 7, No. 4, pp. 342–349, 2012. S. Saha and S. Ghorai, “Effect of feature fusion for discrimination of cardiac pathology,” In Proceedings of the IEEE Third International Conference on Computer, Communication, Control and Information Technology ), February 2015, pp. 1–6. T. Tsutsumi, N. Takano, N. Matsuyama, Y. Higashi, K. Iwasawa, and T. Nakajima, “High-frequency powers hidden within QRS complex as an additional predictor of lethal ventricular arrhythmias to ventricular late myocardial infarction patients,” In Heart Rhythm, Vol. 8, No. 10, pp. 1509–1515, 2011. A. Diery, D. Rowlands, T. R. Cutmore, and D. James, “Automated ECG diagnostic P-wave analysis using wavelets,” In Computer methods and programs in biomedicine, Vol. 101, No. 1, pp. 33–43, 2011. P. McSharry, G. Clifford, L. Tarassenko, and L. Smith, “A dynamical model for lectrocardiogram signals,” In IEEE Transactions on Biomedical Engineering, Vol. 50, No. 3, pp. 289–294, s in Biomedicine, Vol. A. Koeleman, H. Ros, and T. Van den Akker, “Beat-to- beat interval measurement in the electrocardiogram,” In Medical and Biological Engineering and Computing, en, A. Acharyya, A. Bhattacharya, J. Rosengarten, and K. Maharatna, “A Time-Domain Morphology and Gradient based algorithm for ECG feature extraction,” In Proceedings of the IEEE International Conference on Industrial Technology 122. R. Andreao, B. Dorizzi, and J. Boudy, “ECG signal analysis through hidden Markov models,” In IEEE Transactions on Biomedical Engineering, Vol. 53, No. 8, Z. Dokur, T. O¨ lmez, E. Yazgan, and O. K. Ersoy, ECG waveforms by neural networks,” In Medical engineering & physics, Vol. 19, No. 8, pp. 738– generating generating synthetic synthetic V. Afonso, W. J. Tompkins, T. Nguyen, and S. Luo, “ECG beat detection using filter banks,” In IEEE Transactions on Biomedical Engineering, Vol. 46, No. 2, pp. 192–202, J. Sahambi, S. Tandon, and R. Bhatt, “Wavelet based ST- segment analysis,” In Medical and Biological Engineering and Computing, Vol. 36, No. 5, pp. 568– P. Laguna, R. Jan´e, and P. Caminal, “Automatic detection of wave boundaries in multilead ECG signals: database,” In Computers and biomedical research, Vol. 27, No. 1, pp. 45–60, 1994. anyaz, and M. Gabbouj, “A Generic and Robust System for Automated Patient-Specific Classification of ECG Signals,” In IEEE Transactions on Biomedical Engineering, Vol. 56, No. 5, pp. 1415–1426, S. Mallat and S. Zhong, “Characterization of signals from multiscale edges,” In IEEE Transactions on Pattern Analysis & Machine Intelligence, No. 7, pp. 710–732, M. G. Bulmer, Principles of statistics. Courier Y. Kutlu and D. Kuntalp, “Feature extraction for ECG heartbeats using higher order statistics of WPD coefficients,” In Computer methods and programs in W. Struhal, A. Javor, C. Brunner, T. Benesch, V. Schmidt, M. R. Vosko, and G. Ransmayr, “The phoenix from the ashes: cardiovascular autonomic dysfunction in front temporal dementia.” In Journal of Alzheimer’s disease: JAD, Vol. 42, No. 3, pp. –267, 2012. O. Inan, L. Giovangrandi, and G. Kovacs, “Robust @ IJTSRD | Unique Paper ID – IJTSRD27958 27958 | Volume – 3 | Issue – 5 | July - August 2019 August 2019 Page 2459