Download
1 / 5
50 likes | 55 Views
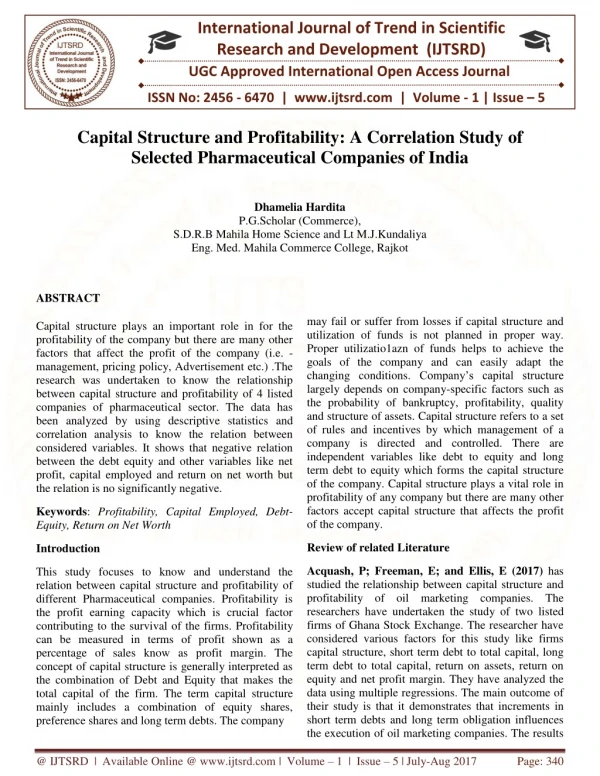
The Indian pharmaceutical industry is the third largest in terms of volume and thirteenth largest in terms of value in the world. Indian Pharmaceutical industry is the largest generic drugs provider at global level. This paper is designed to fulfill mainly two basic objectives. One is to determine long term solvency of selected pharmaceutical companies and the other is to forecast the immediate coming year debt equity ratio of the related companies. The study is purely based on only secondary data. Moreover, the scope of the study is very limited in nature. Ten companies which are listed in both NSE and BSE are selected. Study period is fourteen years i.e. 2003 04 to 2016 17. On the basis of the study major findings of the study and conclusions are drawn. Prof. Dr. Ankita. M. Zadeshvariya "Analysis of Debt Equity Ratio of Selected Pharmaceutical Companies of India" Published in International Journal of Trend in Scientific Research and Development (ijtsrd), ISSN: 2456-6470, Volume-2 | Issue-2 , February 2018, URL: https://www.ijtsrd.com/papers/ijtsrd9683.pdf Paper URL: https://www.ijtsrd.com/management/other/9683/analysis-of-debt-u2013-equity-ratio-of-selected-pharmaceutical-companies-of-india/prof-dr-ankita-m-zadeshvariya<br>

E N D
International Research Research and Development (IJTSRD) International Open Access Journal Equity Ratio of Selected Pharmaceutical Companies of India International Journal of Trend in Scientific Scientific (IJTSRD) International Open Access Journal ISSN No: 2456 ISSN No: 2456 - 6470 | www.ijtsrd.com | Volume www.ijtsrd.com | Volume - 2 | Issue – 2 Analysis of Debt – Equity R atio of Selected Pharmaceutical Ankita. M. Zadeshvariya (M.Com, GSET, Ph.D) Prof. Dr. Ankita Sheth C. D. Barfiwala College of Commerce, Surat, Gujarat, India Assistant Professor, Sheth C. , Gujarat, India ABSTRACT The Indian pharmaceutical industry is the third largest in terms of volume and thirteenth largest in terms of value in the world. Indian Pharmaceutical industry is the largest generic drugs provider at global level. This paper is designed to fulfill mainly two basic objectives. One is to determine long term selected pharmaceutical companies and the other is forecast the immediate coming year debt equity ratio of the related companies. The study is purely based on only secondary data. Moreover, the scope of the study is very limited in nature. Ten companies which are listed in both NSE and BSE are selected is fourteen years i.e. 2003-04 to 2016-17 of the study major findings of the study and conclusions are drawn. Keywords: Pharmaceutical, Debt – Equity, ANOVA analysis INTRODUCTION The Indian pharmaceutical industry is the third largest in terms of volume and thirteenth largest in terms of in the world. Indian Pharmaceutical industry is the largest generic drugs provider at global level. This paper is designed to fulfill mainly two basic determine long term solvency of selected pharmaceutical companies and the other is to financial leverage ratios are calculated. These ratios explain how the capital structure of the concern is made up or the debt equity mix adopted by the se one of the leverage ratios financial leverage ratios are calculated. These ratios explain how the capital structure of the concern is made up or the debt equity mix adopted by the concern. For this purpose one of the leverage the debt equity ratio has been selected. the debt equity ratio has been selected. OBJECTIVES OF THE STUDY: OF THE STUDY: debt equity ratio The paper is designed to fulfill following objectives- s designed to fulfill following basic of the related companies. The study is purely based on only secondary data. Moreover, the scope of the study is very limited in nature. Ten companies which are 1 To determine long-term solvency of the business concern. To predict the future debt companies. term solvency of the business selected. Study period 17. On the basis 2 debt-equity ratio of the of the study major findings of the study and METHODOLOGY: - Equity, Leverage, The study is based on secondary data. The data are collected through annual reports of the companies. Moreover, books, journals, magazines, websites and the previous studies of similar and related subjects are The study is based on secondary data. The data are collected through annual reports of the companies. Moreover, books, journals, magazines, websites and the previous studies of similar and related subjects are referred. The Indian pharmaceutical industry is the third largest in terms of volume and thirteenth largest in terms of value in the world. Indian Pharmaceutical industry is the largest generic drugs provider at global level. Presently the market size of the pharmaceutical industry in India stands at US$ 20 billion. largest provider of generic drugs globally with the Indian generics accounting for 20% of global exports in terms of volume. India’s pharmaceutical industry will touch US$ 45 billion by 2020 according to industry experts. To judge the long term f position of the selected pharmaceutical companies position of the selected pharmaceutical companies, the third largest in terms of volume and thirteenth largest in terms of in the world. Indian Pharmaceutical industry is the largest generic drugs provider at global level. Presently the market size of the pharmaceutical US$ 20 billion. India is the largest provider of generic drugs globally with the Indian generics accounting for 20% of global exports India’s pharmaceutical industry will touch US$ 45 billion by 2020 according to udge the long term financial SCOPE OF THE STUDY:- There are 85 Pharmaceutical companies listed in NSE and 132 in BSE. Different Yardsticks like profit margin, price earnings ratio, return on average equity, total sales, total assets and share capital are used to e of the companies and top 10 pharmaceutical companies have been selected for the years i.e. 2003-04 to 2016-17 are considered as a study period. There are 85 Pharmaceutical companies listed in NSE and 132 in BSE. Different Yardsticks like profit margin, price earnings ratio, return on average equity, total sales, total assets and share capital are used to measure the performance of the companies and top 10 pharmaceutical companies have been select study purpose. Fourteen years i.e. 2003 are considered as a study period. `@ IJTSRD | Available Online @ www.ijtsrd.com @ IJTSRD | Available Online @ www.ijtsrd.com | Volume – 2 | Issue – 2 | Jan-Feb 2018 Feb 2018 Page: 1216
International Journal of Trend in Scientific Research and Development (IJTSRD) ISSN: 2456-6470 10 selected pharmaceutical companies are: 1.Alembic Pharma 2.Aurobindo Pharma 3.Biocon Pharma 4.Cipla Pharma 5.Dr. Reddy’s Lab 6.Jubilant Life Science 7.Piramal Healthcare 8.Sun pharma Ltd 9.Zydus Cadila 10.Lupin Lab DATA ANALYSIS:- Debt Equity Ratio is a debt ratio used to measure a company's financial leverage, calculated by dividing a company's long term liabilities by its share holders' equity. The ratio indicates how much debt a company is using to finance its assets relative to the amount of value represented in shareholders ‘equity. To check the overall financial position of the selected pharmaceutical companies taking together, the total long term debts of all the companies and the total shareholders’ fund of the companies are compared. It indicates the following position. Table 1 Debt Equity Ratio of All the Selected Pharmaceutical Companies Taking Together From the Year 2003-04 to 2016-17 Year Long Term Debts (Rs.in million) Shareholder’s Fund (Rs.in million) Debt Equity Ratio (in percentage) 29932.29 49237.17 67918.05 72437.83 73425.98 96248.88 73168.63 95738.77 51049.29 49968.68 46892.30 63640.08 354103.70 471767.80 113966.39 130036.84 114.10 73426.60 86698.85 109260.23 160997.00 204297.40 228897.40 291679.80 431879.70 467414.50 502234.10 553570.80 802179.70 708347.60 848690.40 390683.86 266357.24 68.18 0.41 0.57 0.62 0.45 0.36 0.42 0.25 0.22 0.11 0.10 0.08 0.08 0.50 0.56 0.34 2003-04 2004-05 2005-06 2006-07 2007-08 2008-09 2009-10 2010-11 2011-12 2012-13 2013-14 2014-15 2015-16 2016-17 AVERAGE STADEV C.V. R 0.62 Sources: Computed from the annual reports of the selected pharmaceutical companies To get the better picture about the debt equity ratio, the following two hypotheses are designed. Ho: There is insignificant difference between average Debt Equity Ratio (in percentage) of each company. H1: There is significant difference between average Debt Equity Ratio (in percentage) of at least one company. `@ IJTSRD | Available Online @ www.ijtsrd.com | Volume – 2 | Issue – 2 | Jan-Feb 2018 Page: 1217
International Journal of Trend in Scientific Research and Development (IJTSRD) ISSN: 2456 International Journal of Trend in Scientific Research and Development (IJTSRD) ISSN: 2456 International Journal of Trend in Scientific Research and Development (IJTSRD) ISSN: 2456-6470 Table 2 Anova Analysis of Debt Equity Ratio Taking Together From Taking Together From the Year 2003-04 to 2016-17 f Debt Equity Ratio of All the Selected Pharmaceutical Companies he Selected Pharmaceutical Companies Debt Equity Ratio Sum of Squares df variance F p-value Between Groups Within Groups Total Between Groups 14.9667 Within Groups 9 130 0.1484 139 1.6630 11.2098 0.0000 11.2098 19.2855 34.2522 Sources: Computed from the annual reports of the selected pharmaceutical companies Sources: Computed from the annual reports of the selected pharmaceutical companies Sources: Computed from the annual reports of the selected pharmaceutical companies TABLE 3 DEBT EQUITY RATIO( IN TIMES)OF SELECTED PHARMACEUTICLE COMPANIES FROM 2003-04 TO 2016-17 TABLE 3 DEBT EQUITY RATIO( IN TIMES)OF SELECTED PHARMACEUTICLE COMPANIES FROM 2003-04 TO 2016-17 2008-09 2009-10 2010-11 2011-12 2012-13 2013-14 2014-15 2015-16 2016-17 AVERAGE 1.24 1.44 0.11 0.15 0.10 1.21 0.50 0.44 0.70 0.73 COMPANY 2003-04 2004-05 2005-06 2006-07 2007-08 0.94 0.78 0.12 0.17 0.03 1.96 0.76 0.02 0.77 0.84 SD CV 84.67 69.58 54.84 111.11 77.14 38.35 82.47 177.50 49.27 91.74 MAX MIN ALEMBIC PHARMA AUROBINDO PHARMA BIOCON LTD. CIPLA LTD. DR.REDDY'S LAB. JUBILANT LIFE SCIECNE PIRAMAL HEALTHCARE SUN PHARMA ZYDUS CADILA LUPIN LAB. 0.74 1.01 0.11 0.13 0.13 0.75 0.65 0.36 0.61 0.88 0.53 1.33 0.13 0.24 0.41 0.76 0.20 1.64 0.59 1.42 0.87 2.13 0.11 0.04 0.08 1.67 0.38 1.19 0.51 0.97 1.24 1.44 0.11 0.15 0.10 1.21 0.50 0.44 0.70 0.73 1.45 1.60 0.12 0.22 0.12 1.89 0.82 0.02 0.68 0.69 1.29 1.02 0.12 0.00 0.10 0.93 0.44 0.00 0.37 0.36 1.19 0.90 0.09 0.07 0.24 1.40 0.02 0.01 0.27 0.31 0.30 0.33 0.06 0.00 0.08 1.22 0.02 0.01 0.28 0.05 0.18 0.35 0.07 0.00 0.00 1.08 0.08 0.00 0.28 0.01 0.08 0.26 0.01 0.00 0.10 0.66 0.07 0.00 0.24 0.00 0.02 0.13 0.00 0.00 0.09 0.89 0.10 0.05 0.13 0.00 0.01 0.43 0.15 0.09 0.27 0.79 1.02 0.03 0.17 0.03 0.01 0.34 0.02 0.00 0.20 0.77 0.54 0.23 0.42 0.59 0.63 0.86 0.09 0.08 0.14 1.14 0.40 0.29 0.43 0.49 0.54 0.60 0.05 0.09 0.11 0.44 0.33 0.51 0.21 0.45 1.45 2.13 0.15 0.24 0.41 1.96 1.02 1.64 0.77 1.42 0.01 0.13 0 0 0 0.66 0.02 0 0.13 0 Sources: Computed from the annual reports of the selected pharmaceutical companies Sources: Computed from the annual reports of the selected pharmaceutical companies Sources: Computed from the annual reports of the selected pharmaceutical companies Figure 1 Column Chart Showing the Debt Equity Ratio he Debt Equity Ratio of Selected Pharmaceutical Companies Taken f Selected Pharmaceutical Companies Taken Together From Together From the Year 2003-04 to 2016-17 DEBT EQUITY RATIO 2.50 2.00 1.50 IN TIMES 1.00 0.50 0.00 YEAR ALEMBIC PHARMA AUROBINDO PHARMA AUROBINDO PHARMA BIOCON LTD. CIPLA LTD. DR.REDDY'S LAB. JUBILANT LIFE SCIECNE JUBILANT LIFE SCIECNE PIRAMAL HEALTHCARE SUN PHARMA SUN PHARMA ZYDUS CADILA LUPIN LAB. LUPIN LAB. `@ IJTSRD | Available Online @ www.ijtsrd.com @ IJTSRD | Available Online @ www.ijtsrd.com | Volume – 2 | Issue – 2 | Jan-Feb 2018 Feb 2018 Page: 1218
The long term debts, shareholders equity and debt equity ratio of all selected pharmaceutical companies taking together is given in table 1. It is analyzed from the table 1 that the shareholders’ fund is continuously increased from 73426.60 million in 2003-04 to 848690.40 million in 2016-17 with the growth rate of 1155.84% except in the year 2015-16 whereas long term debts has increasing trend till 2008-09 but after than it is fluctuating trend till 2014-15 but after then it remain increasing trend during the study period. The highest long term debts mentioned in the year 2016- 17 with 471767.80 million and lowest in the year 2003-04 with 29932.29 million. It is analyzed from the table that the growth rate in shareholders’ equity is comparatively very high than the long term debt which indicates that the net worth of the selected pharmaceutical companies increased faster than the long term debts. It can also be analyzed that during the first six years of the study period, the average debt equity ratio is above than the average ratio of 0.34:1 but after then till 2014-15, it is remained below than the average ratio. In the year 2015-16 and 2016-17 the average ratio remain higher than the average. It seems that the pharmaceutical companies may have changed their financial policy. The standard deviation of long term debts and shareholders’ fund is 130036.84 million and 266357.24 million respectively whereas coefficient of variation is much lower in shareholders’ fund that being 68.18% than that of in long term debts that being 114.10%. It indicates the higher variability in both of them. The coefficient of correlation is 0.62 which express positive relationship between them. Table 2 shows the significant difference between different selected pharmaceutical companies’ Debt Equity ratios by using ANOVA. The researcher get F=11.2098 with p-value=0.000, which is less than pre-defined significant level α (=0.05), So Ho is rejected. It means statistically there is significant difference between the values of debt equity ratio and the null hypothesis is rejected. It signifies that there is difference in the capital structure (owner’s capital and debt capital) of all selected pharmaceutical companies because all selected companies’ Debt equity ratios are showing fluctuating trend during the study period. With comparison to industrial ratio of 0.34:1, Jubilant Life Science has highest average ratio with 1.14:1 and Cipla has lowest average ratio with 0.08:1. debt equity ratio on an average is highest in Jubilant Life Science that being 1.14:1 and lowest ratio in cipla pharma with 0.08:1. The average ratio of the Alembic pharma, Aurobindo pharma, Jubilant life science, Piramal health care, Zydus Cadila and Lupin lab. remained above than the consolidated average ratio of 0.34:1. It indicates that the above companies are highly dependent on long term debts for their requirements of fund rather than shareholders’ fund. It can also be analysed that the security of the creditors of long term debts is not satisfactory as they do not have sufficient cushion on shareholders’ equity. The debt equity ratio on an average is marked in Biocon Ltd. with 0.09:1, Cipla Ltd. with 0.08:1 and Dr.reddy’s lab with 0.14:1 and Sun pharma with 0.29:1. The average ratio of the above three companies is lower than the consolidated average ratio which indicates the security of the creditors of the long term debts is satisfactory. One of the objectives of the research study is to predict future debt-equity ratio of the selected pharmaceutical companies. From the historical value, the future values of the ratio have been found out. Mainly two statistical techniques i.e. trend forecasting and linear regression have been applied. Both the statistical techniques given the same predicted value of debt-equity ratios. Following table give the details about the difference of predicted value for the year 2017-18. Table 4 Predicted Debt Equity Ratios of the Selected Pharmaceutical Companies for the Year 2017-18 NAME OF THE COMPANY DEBT-EQUITY RATIO (IN TIMES) 1.19 1.51 ALEMBIC PHARMA AUROBINDO PHARMA BIOCON PHARMA CIPLA PHARMA DR.REDDY'S LAB. JUBILANT LIFE SCIENCE PIRAMAL HEALTH CARE SUN PHARMA ZYDUS CADILA LUPIN LAB. 0.13 0.17 0.13 1.47 0.50 0.65 0.70 1.03 The debt equity ratio of the individual selected pharmaceutical companies is portrayed in table 3 and the figure 1. It is clear from the table and chart that @ IJTSRD | Available Online @ www.ijtsrd.com | Volume – 2 | Issue – 2 | Jan-Feb 2018 Page: 1219
International Journal of Trend in Scientific Research and Development (IJTSRD) ISSN: 2456-6470 REFERNCES:- CONCLUSION: - Debt Equity ratio measures the concern’s obligation to external suppliers of funds in relation to the funds invested by the owners. It indicates the relative proportion of the external suppliers of funds and owners. It indicates the relative proportion of the external suppliers of funds and owners in financing. The average debt equity ratio of pharmaceutical industry was 0.34:1. During the first six years and also last two years of the study period, it was high than the average ratio. It was also concluded that the higher use of funded debts has adversely affected the profitability particularly during these years of the study period. The highest debt equity ratio was Jubilant life science that being 1.14:1 followed by Aurobindo pharma that being 0.86:1, it is concluded that these companies were highly geared by the long term debts, however the Biocon pharma, Cipla pharma, and Dr.reddy’s lab that being 0.09:1, 0.08:1 and 0.14:1 respectively. It was below than the average ratio which indicates that the relative importance of borrowed funds in company is lower to the above companies. While the Piramal health care has 0.40:1 ratio which was near the average ratio as the industrial ratio 0.34:1 that indicates that the financial positions considered to be sound i.e. the business position is highly solvent. SUGGESION: - 1)Dr. Jain S.C., “Financial Management of Indian Industries”, Prateeksha Publications, Edition- 1986. 2)Kuchhal. S.C. : “Financial Management – An analytical and conceptual approach”, Chaitanya Publishing House, Edition 1987 3)Varma. B.L. : “Analysis of Financial Statements”, Arihant publishers, Edition 1988. 4)Hanks G.F. : “Finding Cash For Your Firm”, Cost and Management, May-1988. 5)Dr. Promod Kumar.: “Analysis of financial statement of Indian Publication Ltd.,Edition- 1992. Industries” Saujaniya 6)Das. P.K. : “A study on Liquidity Management in ranbaxy Laboratories Ltd.”, The Journal of Accounting and Finance, oct 2007- nov 2008, Vol. 22, No. 1. 7)Rupesh Rastogi, Teg Alam & Said Malki:, “The Indian Pharmaceuticle Industry : The Empirical Study”, VSRD International Journal of Business & Management Research, 2011, Vol. 1(7). 8)P.Janaki Ramudu and N.R.Parasuraman: “ Growth in Sales Compared with Changes in Profitability and in Working Capital-A Study of Indian Pharmaceuticle Industry”, Accounting and Finance, Oct 2011-March,2012, Vol. 26,No. 1. The Journal of From the above study, it is observed that out of these all selected pharmaceutical companies particularly Biocon, Cipla and Dr. Reddy’s Lab have very low debt equity ratio compare to the remaining companies. So it is suggested that they try to use capital gearing by issuing more debt so these companies will also give more dividends to their shareholders. 9)Vegbunam Performance Difference Among Commercial Banks in Nigeria – a Multivariate Ratio analysis”, Finance India, 2001 Vol. 25(2), pp. 551-566. R.I.: “Financial Distress and `@ IJTSRD | Available Online @ www.ijtsrd.com | Volume – 2 | Issue – 2 | Jan-Feb 2018 Page: 1220