Download
1 / 5
90 likes | 541 Views
Customer satisfaction is a term frequently used in marketing. In researching satisfaction, firms generally ask customers whether their product or service has met or exceeded expectations". The sample size for the consumer's survey is 150.Tools For Statistical Analysis to Analyze the data and interpret the results by using percentage analysis and ranking. simple Percentage Method, Weighted Average Ranking Method, Chi Square test. To find out the socio economic status of the respondents. To determine the motivating factor for purchasing the product through Zomato. The management can maintain the positive attitude of the Customers in order to improve the sales furthermore which in turn to help the company to move towards the better prospects. Dr. R. Maheswari | G. Swarnalatha | Ms. T. Gayathri "A Study on Customer Satisfaction towards Zomato Online Food Ordering with Special Reference to Coimbatore City" Published in International Journal of Trend in Scientific Research and Development (ijtsrd), ISSN: 2456-6470, Volume-3 | Issue-6 , October 2019, URL: https://www.ijtsrd.com/papers/ijtsrd29211.pdf Paper URL: https://www.ijtsrd.com/management/consumer-behaviour/29211/a-study-on-customer-satisfaction-towards-zomato-online-food-ordering-with-special-reference-to-coimbatore-city/dr-r-maheswari

E N D
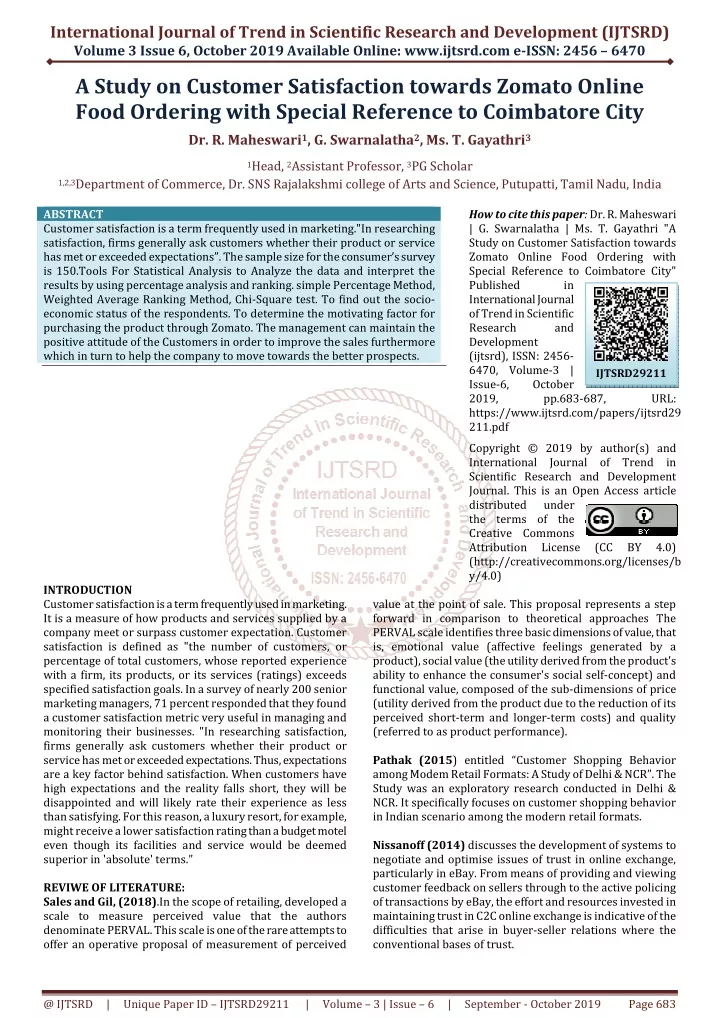
International Journal of Trend in Scientific Research and Development (IJTSRD) Volume 3 Issue 6, October 2019 Available Online: www.ijtsrd.com e-ISSN: 2456 – 6470 A Study on Customer Satisfaction towards Zomato Online Food Ordering with Special Reference to Coimbatore City Dr. R. Maheswari1, G. Swarnalatha2, Ms. T. Gayathri3 1Head, 2Assistant Professor, 3PG Scholar 1,2,3Department of Commerce, Dr. SNS Rajalakshmi college of Arts and Science, Putupatti, Tamil Nadu, India ABSTRACT Customer satisfaction is a term frequently used in marketing."In researching satisfaction, firms generally ask customers whether their product or service has met or exceeded expectations”. The sample size for the consumer’s survey is 150.Tools For Statistical Analysis to Analyze the data and interpret the results by using percentage analysis and ranking. simple Percentage Method, Weighted Average Ranking Method, Chi-Square test. To find out the socio- economic status of the respondents. To determine the motivating factor for purchasing the product through Zomato. The management can maintain the positive attitude of the Customers in order to improve the sales furthermore which in turn to help the company to move towards the better prospects. How to cite this paper: Dr. R. Maheswari | G. Swarnalatha | Ms. T. Gayathri "A Study on Customer Satisfaction towards Zomato Online Food Ordering with Special Reference to Coimbatore City" Published in International Journal of Trend in Scientific Research and Development (ijtsrd), ISSN: 2456- 6470, Volume-3 | Issue-6, October 2019, pp.683-687, https://www.ijtsrd.com/papers/ijtsrd29 211.pdf Copyright © 2019 by author(s) and International Journal of Trend in Scientific Research and Development Journal. This is an Open Access article distributed under the terms of the Creative Commons Attribution License (http://creativecommons.org/licenses/b y/4.0) IJTSRD29211 URL: (CC BY 4.0) INTRODUCTION Customer satisfaction is a term frequently used in marketing. It is a measure of how products and services supplied by a company meet or surpass customer expectation. Customer satisfaction is defined as "the number of customers, or percentage of total customers, whose reported experience with a firm, its products, or its services (ratings) exceeds specified satisfaction goals. In a survey of nearly 200 senior marketing managers, 71 percent responded that they found a customer satisfaction metric very useful in managing and monitoring their businesses. "In researching satisfaction, firms generally ask customers whether their product or service has met or exceeded expectations. Thus, expectations are a key factor behind satisfaction. When customers have high expectations and the reality falls short, they will be disappointed and will likely rate their experience as less than satisfying. For this reason, a luxury resort, for example, might receive a lower satisfaction rating than a budget motel even though its facilities and service would be deemed superior in 'absolute' terms." REVIWE OF LITERATURE: Sales and Gil, (2018).In the scope of retailing, developed a scale to measure perceived value that the authors denominate PERVAL. This scale is one of the rare attempts to offer an operative proposal of measurement of perceived value at the point of sale. This proposal represents a step forward in comparison to theoretical approaches The PERVAL scale identifies three basic dimensions of value, that is, emotional value (affective feelings generated by a product), social value (the utility derived from the product's ability to enhance the consumer's social self-concept) and functional value, composed of the sub-dimensions of price (utility derived from the product due to the reduction of its perceived short-term and longer-term costs) and quality (referred to as product performance). Pathak (2015) entitled “Customer Shopping Behavior among Modem Retail Formats: A Study of Delhi & NCR”. The Study was an exploratory research conducted in Delhi & NCR. It specifically focuses on customer shopping behavior in Indian scenario among the modern retail formats. Nissanoff (2014) discusses the development of systems to negotiate and optimise issues of trust in online exchange, particularly in eBay. From means of providing and viewing customer feedback on sellers through to the active policing of transactions by eBay, the effort and resources invested in maintaining trust in C2C online exchange is indicative of the difficulties that arise in buyer-seller relations where the conventional bases of trust. @ IJTSRD | Unique Paper ID – IJTSRD29211 | Volume – 3 | Issue – 6 | September - October 2019 Page 683
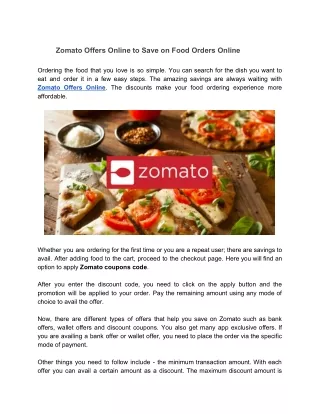
International Journal of Trend in Scientific Research and Development (IJTSRD) @ www.ijtsrd.com eISSN: 2456-6470 Zachary Soreff(2013) director of sales & marketing at Red Letter Days explains the value of an experiential reward: “Experiences offer a more interactive and tuned-in way of promoting a product which, in turn, allows audiences to become more integrated with the brand. They are a popular tool for sales promotion because we are engaging customers emotionally with the brands by giving them a memory to cherish.” Tim Bishop (2012) of exhilaration explains that by “aligning your brand with a relevant experience you can help to create a more exciting perception of your business in the customer’s mind.” Exhilaration are experts in providing vouchers for adrenaline experiences such as Ferrari driving, bungee jumping and adventure weekends but also offer less extreme pursuits including spa days and gourmet cruises. “The impact of sending someone over a mountain with nothing but a bit of elastic to hold onto will certainly be a lasting one” he continued, “but not necessarily one that everybody would enjoy.” RESEARCH METHODOLOGY: Methodology is a plan of action for a research project and explains in detail how data to be collected and analyzed and presented so that they will provide meaningful information. RESEARCH DESIGN The descriptive research is used to identify the satisfaction and expectation of consumer and its impact brand preferences. PERCENTAGE ANALYSIS: TABLE1TABLE SHOWING TYPE OF FOOD PURCHASE THROUGH ZOMATO Type of food Number of respondents Percentage North Indian South Indian Continental Deserts Pastries Beverages Total Source: primary data collected through questionnaire and analyzed through spss. SAMPLING SIZE The sample size for the consumer’s survey is 150. SAMPLING METHOD The Convenience sampling method was adopted for the study with a sample size of 150 respondents from the customers. Convenience sampling techniques has been used to select the respondents. Sample design is non probability sampling design. TOOLS FOR STATISTICAL ANALYSIS Analyze the data and interpret the results by using percentage analysis and ranking. ?simple Percentage Method ?Weighted Average Ranking Method ?Chi-Square test OBJECTIVES: ?To find out the socio-economic status of the respondents. ?To determine the motivating factor for purchasing the product through Zomato ANALYSIS AND INTERPRETATION: ?The effort to establish continuity in research through linking the result of a given study with those of another. ?The establishment of some explanatory concept. 33 53 21 15 18 10 150 22 35 14 10 12 7 100 Interpretation It is concluded that 35% of the respondents said that they choose south indian food to purchase through zomato,22% of the respondents said that they choose north indian food,14% of the respondents said that they choose continental food,12% of the respondents said pastries,10% of the respondents said deserts and 7% of the respondents said that they choose beverages food to purchase through zomato. TABLE2TABLE SHOWING RESPONDENTS PREFERRED MEDIUM TO ORDER FOOD ONLINE Medium Number of respondents Percentage Mobile App 101 67 Web Browser 49 33 Total 150 100 Source: primary data collected through questionnaire and analyzed through spss. Interpretation: It is concluded that 67% of the respondents said that the preferred medium to order food online is mobile app, 33% of the respondents said that the preferred medium to order food online web browser. @ IJTSRD | Unique Paper ID – IJTSRD29211 | Volume – 3 | Issue – 6 | September - October 2019 Page 684
International Journal of Trend in Scientific Research and Development (IJTSRD) @ www.ijtsrd.com eISSN: 2456-6470 TABLE3 TABLE SHOWING OVERALL SATISFACTION ABOUT ONLINE FOOD ORDERING Opinion No. of respondents Percentage Highly Satisfied Satisfied Neutral Dissatisfied Highly Dissatisfied Total Source: primary data collected through questionnaire and analyzed through spss. 51 42 12 24 21 150 34 28 8 16 14 100 Interpretation It is inferred that 34% of the respondents are highly satisfied about online food ordering, 28% of the respondents are satisfied, 16% of the respondents are dissatisfied, 14% of the respondents are highly satisfied and 8% of the respondents are neutral about online food ordering. TABLE4 TABLE SHOWING RESPONDENTS FREQUENCY OF ORDERING FOOD ONLINE Frequency of ordering food Number of respondents Percentage Daily Weekly Once Fortnightly Monthly once Total Source: primary data collected through questionnaire and analyzed through spss. Interpretation: It is concluded that 41% of the respondents order food fortnightly, 20%of the respondents order food online monthly once, 22% of the respondents order food weekly once, 20% of the respondents order food monthly once and 17%of the respondents order food daily. WEIGHTED AVERAGE WEIGHTED AVERAGE WITH RANKING ANALYSIS TABLE SHOWING PROBLEMS FACED BY RESPONDENTS WHILE ORDERING ONLINE FOOD TABLE 5 Weighted average 5 4 3 2 22 20 24 22 110 80 72 44 27 42 35 20 135 168 105 40 63 38 18 20 315 152 54 40 23 23 36 50 115 92 108 100 18 17 28 33 48 85 112 99 96 Source: primary data collected through questionnaire and analyzed through spss. Interpretation From the table it is clear that problems while ordering variety of foods ranked first with the weighted average of 3.81, service charges ranked second with weighted average of 3.16, change in orders ranked third with weighted average 2.87, customer service ranked fourth with weighted average of 2.77, and delivery delay ranked fifth with weighted average 2.45. CHISQUARE TEST 1.To find the significant difference between occupation of the respondents and overall satisfaction about online food ordering. Hypothesis Null hypothesis: There is no statistical significant difference between occupation of the respondents and overall satisfaction about online food ordering. Alternate hypothesis: There is statistical significant difference between occupation of the respondents and overall satisfaction about online food ordering. 25 33 62 30 150 17 22 41 20 100 Problems Total Weighted Average Rank 1 62 62 26 26 11 11 18 Delivery delay 368/150 2.45 V Service charges 474/150 3.16 II Variety of foods 572/150 3.81 I Change in orders 433/150 2.87 III 24 24 Customer service 416/150 2.77 IV @ IJTSRD | Unique Paper ID – IJTSRD29211 | Volume – 3 | Issue – 6 | September - October 2019 Page 685
International Journal of Trend in Scientific Research and Development (IJTSRD) @ www.ijtsrd.com eISSN: 2456-6470 TABLE6 OCCUPATION OF THE RESPONDENTS * OVERALL SATISFACTION ABOUT ONLINE FOOD ORDERING Occupation of the respondents Highly satisfied Satisfied Neutral Dissatisfied Highly dissatisfied Agriculture 3 1 Private employee 26 5 Government employee 20 16 Business people 2 20 Total 51 42 Source: primary data collected through questionnaire and analyzed through spss. Overall satisfaction about online food ordering Total 0 5 3 4 12 0 4 3 17 24 0 5 9 7 21 4 45 51 50 150 Value 32.079(a) 12 34.742 11.843 150 Df Asymp. Sig. (2-sided) .001 .001 .001 Pearson Chi-Square Likelihood Ratio Linear-by-Linear Association No of Valid Cases 12 1 Level of Significant =5% Degree of freedom-(R-1) (C-1) (4-1) (5-1) =12 Table value = 32.079 Calculated value = 34.742 Interpretation: Since the Pearson Chi-square value is .001 which is less than the p value 0.05 at 12degrees of freedom, we reject the Null hypothesis. Hence we infer there is a significant difference between occupation of the respondents and overall satisfaction about online food ordering. 2.To find the significant difference between age of the respondents and overall satisfaction about online food ordering Hypothesis Null hypothesis: There is no statistical significant difference between age of the respondents and overall satisfaction about online food ordering Alternate hypothesis: There is statistical significant difference between age of the respondents and overall satisfaction about online food ordering TABLE7 AGE OF THE RESPONDENTS * OVERALL SATISFACTION ABOUT ONLINE FOOD ORDERING Overall satisfaction about online food ordering Highly satisfied Satisfied Neutral Dissatisfied Highly dissatisfied Below 20 years 6 12 20- 30 years 30 9 30-40 years 9 18 Above 40 years 6 3 Total 51 42 Source: primary data collected through questionnaire and analyzed through spss. Value Pearson Chi-Square 24.971(a) 12 Likelihood Ratio 28.609 Linear-by-Linear Association 1.079 N of Valid Cases 150 Level of Significant =5% Degree of freedom-(R-1) (C-1) (4-1) (5-1) =12 Table value = 24.971 Calculated value = 28.609 Interpretation: Since the Pearson Chi-square value is .013 which is less than the p value 0.05 at 12degrees of freedom, we reject the Null hypothesis. Hence we infer there is a significant difference between age of the respondents and overall satisfaction about online food ordering. Total 29 67 42 12 150 Age of the respondents 6 0 4 2 12 2 19 3 0 24 3 9 8 1 21 df Asymp. Sig. (2-sided) .013 .000 .184 12 1 @ IJTSRD | Unique Paper ID – IJTSRD29211 | Volume – 3 | Issue – 6 | September - October 2019 Page 686
International Journal of Trend in Scientific Research and Development (IJTSRD) @ www.ijtsrd.com eISSN: 2456-6470 FINDINGS: Percentage analysis: ?Most 42% of the respondents said that they agree that advertisement influence online purchase of food.. ?Majority67% of the respondents said that the preferred medium to order food online is mobile app. ?Most 34% of the respondents are highly satisfied about online food ordering ?Most 34% of the respondents are highly satisfied about online food ordering Weighted Average: ?Problems while ordering variety of foods ranked first with the weighted average of 3.81, service charges ranked second with weighted average of 3.16, change in orders ranked third with weighted average 2.87. ?No minimum order factor ranked first with the weighted average of 3.5, promotions ranked second with weighted average of 3.45, fast delivery ranked third with weighted average 3.29. Chisquare Test Analysis: ?There is a significant difference between occupation of the respondents and overall satisfaction about online food ordering. ?There is a significant difference between age of the respondents and overall satisfaction about online food ordering. SUGGESTIONS: ?Advertising plays a very important role in the purchase of a online ordering foods as most Customers are like to purchase because of advertisements. ?As most customers were between the age group of 20- 30 years so the company strategies should focus on that age group 20- 30 years. ?The company should focus on giving better quality product as most customers were very brand loyal and were generally satisfied with the product. CONCLUSION: The company has to focus on building positive image regarding the product on customer’s mind. Satisfied customer will always be the worthy asset to the organisation and thus increasing competitive advantage over the rivalries. In future, researchers could investigate how emotional aspects impact on actual purchase behaviours. The management can maintain the positive attitude of the Customers in order to improve the sales furthermore which in turn to help the company to move towards the better prospects. REFERENCES: [1]Buttle, F. (2004), Customer Relationship Management: concepts and tools, Oxford: Elsevier Butterworth- Heinemann [2]Gronroos, C. (1994), “From Marketing Mix to Relationship Marketing: Towards a Paradigm Shift in Marketing”, Management Decision, 32 (2), pp. 4-20 [3]Nissanoff, D. (2006) Future shop. How the new auction culture will revolutionize the way we buy, sell and get the things we really want. New York, the Penguin Press [4]Sweeney, J.C. &Soutar, G.N. (2001). Consumer perceived value: The development of a multiple item scale. Journal of Retailing. 77, 203–220. [5]Sales, consummator: Unaaplicaciónen equipamientopara el hogar. EstudiossobreConsumo. 82, 63–82. BOOKS ?Philip Kotler, Marketing management. eleventh edition, Pearson Education ?R.S.N. Pillai and Bagavathi, Modern marketing principles and Practices., Second Edition S.chand and Company Ltd, New Delhi. ?RajanSaxena ,Marketing management ,Second Edition ?Kottler, Marketing management, Eight edition V. & Gil, I. (2007).Valorpercibidopor en la compra @ IJTSRD | Unique Paper ID – IJTSRD29211 | Volume – 3 | Issue – 6 | September - October 2019 Page 687