Download
1 / 6
60 likes | 67 Views
The application of Information Technology in government is not only based on the desire to create a more efficient government, but also to improve the public access to information and the quality of services developed by the government. This study measures the extent of the quality of citizens' aspirations service at Badung Communication and Information website. The method used is the E Govqual method, since it was created specifically to assess government owned websites. E Govqual itself has 22 attributes which are divided into five variables namely Ease of Use, Trust, Reliability, Content and Appearance of Information, and Citizen Support. The data collected were analyzed using the Importance Performance Analysis IPA method in order to obtain indicators that are in need of improvement or to be maintained based on users perceptions and expectations. The result of the analysis shows that the citizens' aspirations service at Badung Communication and Information website is still not in accordance to the users expectations. This is shown by the suitability value of 100 , which is 81 and the average result of the gap value of 0, which is 0.84. There are 10 attributes of the main improvements to the citizens' aspirations service at Badung Communication and Information website. Dela Handayani | I Ketut Adi Purnawan | Gusti Made Arya Sasmita "Evaluation of the E-Government Quality of Services (Case Study: X City Government)" Published in International Journal of Trend in Scientific Research and Development (ijtsrd), ISSN: 2456-6470, Volume-4 | Issue-4 , June 2020, URL: https://www.ijtsrd.com/papers/ijtsrd30854.pdf Paper Url :https://www.ijtsrd.com/engineering/information-technology/30854/evaluation-of-the-egovernment-quality-of-services-case-study-x-city-government/dela-handayani<br>

E N D
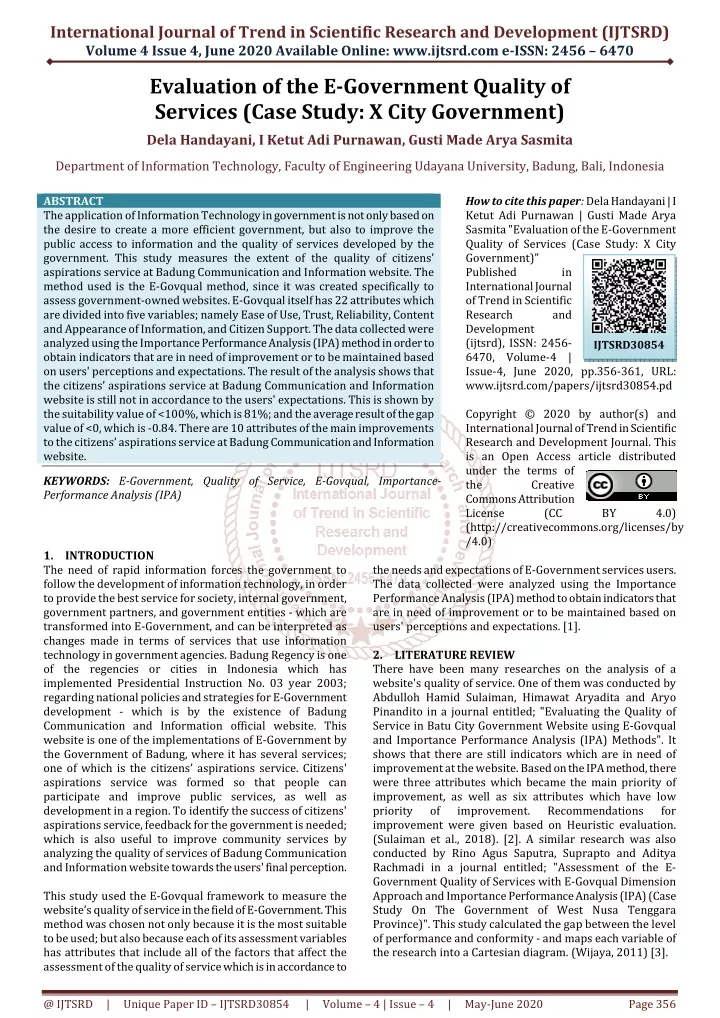
International Journal of Trend in Scientific Research and Development (IJTSRD) Volume 4 Issue 4, June 2020 Available Online: www.ijtsrd.com e-ISSN: 2456 – 6470 Evaluation of the E-Government Quality of Services (Case Study: X City Government) Dela Handayani, I Ketut Adi Purnawan, Gusti Made Arya Sasmita Department of Information Technology, Faculty of Engineering Udayana University, Badung, Bali, Indonesia ABSTRACT The application of Information Technology in government is not only based on the desire to create a more efficient government, but also to improve the public access to information and the quality of services developed by the government. This study measures the extent of the quality of citizens’ aspirations service at Badung Communication and Information website. The method used is the E-Govqual method, since it was created specifically to assess government-owned websites. E-Govqual itself has 22 attributes which are divided into five variables; namely Ease of Use, Trust, Reliability, Content and Appearance of Information, and Citizen Support. The data collected were analyzed using the Importance Performance Analysis (IPA) method in order to obtain indicators that are in need of improvement or to be maintained based on users' perceptions and expectations. The result of the analysis shows that the citizens’ aspirations service at Badung Communication and Information website is still not in accordance to the users' expectations. This is shown by the suitability value of <100%, which is 81%; and the average result of the gap value of <0, which is -0.84. There are 10 attributes of the main improvements to the citizens’ aspirations service at Badung Communication and Information website. KEYWORDS: E-Government, Quality of Service, E-Govqual, Importance- Performance Analysis (IPA) How to cite this paper: Dela Handayani | I Ketut Adi Purnawan | Gusti Made Arya Sasmita "Evaluation of the E-Government Quality of Services (Case Study: X City Government)" Published in International Journal of Trend in Scientific Research and Development (ijtsrd), ISSN: 2456- 6470, Volume-4 | Issue-4, June 2020, pp.356-361, URL: www.ijtsrd.com/papers/ijtsrd30854.pd Copyright © 2020 by author(s) and International Journal of Trend in Scientific Research and Development Journal. This is an Open Access article distributed under the terms of the Creative Commons Attribution License (CC (http://creativecommons.org/licenses/by /4.0) IJTSRD30854 BY 4.0) 1.INTRODUCTION The need of rapid information forces the government to follow the development of information technology, in order to provide the best service for society, internal government, government partners, and government entities - which are transformed into E-Government, and can be interpreted as changes made in terms of services that use information technology in government agencies. Badung Regency is one of the regencies or cities in Indonesia which has implemented Presidential Instruction No. 03 year 2003; regarding national policies and strategies for E-Government development - which is by the existence of Badung Communication and Information official website. This website is one of the implementations of E-Government by the Government of Badung, where it has several services; one of which is the citizens’ aspirations service. Citizens' aspirations service was formed so that people can participate and improve public services, as well as development in a region. To identify the success of citizens' aspirations service, feedback for the government is needed; which is also useful to improve community services by analyzing the quality of services of Badung Communication and Information website towards the users' final perception. This study used the E-Govqual framework to measure the website’s quality of service in the field of E-Government. This method was chosen not only because it is the most suitable to be used; but also because each of its assessment variables has attributes that include all of the factors that affect the assessment of the quality of service which is in accordance to the needs and expectations of E-Government services users. The data collected were analyzed using the Importance Performance Analysis (IPA) method to obtain indicators that are in need of improvement or to be maintained based on users' perceptions and expectations. [1]. 2.LITERATURE REVIEW There have been many researches on the analysis of a website's quality of service. One of them was conducted by Abdulloh Hamid Sulaiman, Himawat Aryadita and Aryo Pinandito in a journal entitled; "Evaluating the Quality of Service in Batu City Government Website using E-Govqual and Importance Performance Analysis (IPA) Methods". It shows that there are still indicators which are in need of improvement at the website. Based on the IPA method, there were three attributes which became the main priority of improvement, as well as six attributes which have low priority of improvement. improvement were given based on Heuristic evaluation. (Sulaiman et al., 2018). [2]. A similar research was also conducted by Rino Agus Saputra, Suprapto and Aditya Rachmadi in a journal entitled; "Assessment of the E- Government Quality of Services with E-Govqual Dimension Approach and Importance Performance Analysis (IPA) (Case Study On The Government of West Nusa Tenggara Province)". This study calculated the gap between the level of performance and conformity - and maps each variable of the research into a Cartesian diagram. (Wijaya, 2011) [3]. Recommendations for @ IJTSRD | Unique Paper ID – IJTSRD30854 | Volume – 4 | Issue – 4 | May-June 2020 Page 356
International Journal of Trend in Scientific Research and Development (IJTSRD) @ www.ijtsrd.com eISSN: 2456-6470 3.RESEARCH METHOD Research method is the basic stages performed in conducting a research. It aims to make the research process more organized, systematic, controlled and directed. Planning in a study is needed; therefore, it can be directed and have a right target. 1.1.Stages of Analysis The research process contains the stages or the whole picture of the research conducted. The overall stages of analysis are explained as follows. A.Choosing a Topic of the Problem The first stage was choosing the Topic of the Problem. This stage is the basic stage of conducting research and collecting evidence in order to strengthen the research background. B.Literature Study The second stage was the literature study. This stage is the stage of collecting supporting theories which underlie a research. Supporting theories can come from books, journals, previous researches, as well as e-books. C.Sampling The next stage was sampling. This stage identifies who can be the respondent and what is the minimum number of respondents needed in a research. The non-probability sampling technique, which is purposive sampling; was used to determine who can become the respondent in this research. D.Determined the E-Govqual Attributes in the Questionnaire This stage is to determine E-Govqual attributes in the questionnaire. Not all E-Govqual attributes were being used as research questionnaires. E.Made a Questionnaire The questionnaire was made by developing the E-Govqual attributes indicator in the questionnaire which had previously been identified based on related theories to become a statement. F.Testing the Questionnaire Instruments The next stage after the questionnaire was distributed to 100 users of Badung Communication and Information website was processing and testing the data. The tests conducted were validity and reliability test, in order to prove that the data collected could truly be reliable and valid; therefore it could be proven right G.Data collecting and processing by IPA The next stage, which was data collection, was conducted by distributing online questionnaires to the residents of Badung. The respondents taken should be a resident of Badung and had ever used the website. H.Identified the Indicators of Improvement This stage contains the indicators of improvement from the result of analysis of research which has been conducted. I.Conclusion and Suggestion This stage contains conclusions from the research that has finished, as well as suggestions from the result of the analysis. 4.LITERATURE REVIEW This part contains concepts and theories which support the research. The tool used was a questionnaire which was designed based on the E-Govqual and IPA (Importance- Performance Analysis) method. It will be discussed as follows. 4.1.E-Govqual E-Govqual is a framework used to measure the website’s quality of services, especially; government institution Figure 1. Research processes @ IJTSRD | Unique Paper ID – IJTSRD30854 | Volume – 4 | Issue – 4 | May-June 2020 Page 357
International Journal of Trend in Scientific Research and Development (IJTSRD) @ www.ijtsrd.com eISSN: 2456-6470 websites which have implemented E-Government. From this research, came several E-Government quality attributes which were included in the six main criteria - known as the dimension of E-Government quality of services in. A.Ease of Use - how easy it is for people to interact or use the E-Government website. B.Trust - how people trust or doubt towards E- Government regarding freedom from the risk of danger during the process of online service. C.Reability-as accessibility, availability and accuracy of information needed by users. The term includes correct technical functions (accessibility and availability) and services with a very promising accuracy. D.Content and Appearance of Information - The quality of the information itself as well as its presentation and layout, such as the proper use of colors, graphics, and size of web pages. E.Citizen Support - can be interpreted about what features are provided on the website, as well as support from employees to help users in finding the information needed 4.2.Importance Performance Analysis (IPA) Importance Performance Analysis is a technique to identify the attributes of products or services that are most needed by users (Martilla and James, 2013). There are three assessment analyzes available in IPA; which are the conformity level analysis to measure how appropriate the service is provided with the expectations that the users’ want, the gap level analysis to measure the gap or difference in a service performance expected by the users with the performance provided, and the quadrant analysis to identify the attributes that need to be prioritized for improvement and / or development to improve the quality of services provided. 'The quadrant' here is the quadrant of Cartesian diagram with the intersection of X and Y axes, therefore four quadrants will be in it. They can be seen in Figure 2. B.Second quadrant Maintain achievement (high importance dan high performance). Attributes in this quadrant are considered very important by the users and the level of performance satisfies the users' desire. C.Third quadrant Low priority (low importance and low performance). Attributes in this quadrant have low level of performance and are considered not too important by the users, therefore; a company does not need to prioritize factors on these attributes. D.Fourth quadrant Overrated (low importance and high performance). Attributes in this quadrant are considered not too important by the users, but the performance is quite satisfying. 5.RESULT AND DISCUSSION 5.1.Analysis of the performance and importance level assessment The website's performance level is assessed based on how the website performance is felt by the users. Meanwhile, the level of importance is assessed based on the users' perception of how important the attributes on the website are. The result of the performance and importance level assessment can be seen in Table 1. Table 1. The performance and importance level assessment Xi (Performance) Ease of Use Dimension EU1 3,83 EU2 3,37 EU3 3,23 EU4 4,2 EU5 3,8 Trust Dimension TRS1 3,1 TRS2 3,67 TRS3 3,47 TRS4 3,47 Reliability Dimension RLB1 4 RLB2 2,53 RLB3 3,33 RLB4 3,27 RLB5 3,37 Content and Appearance of Information Dimension CAI1 2,83 CAI2 3,93 CAI3 3,37 CAI4 3,87 Citizen Support Dimension CS1 2,7 CS2 3,17 CS3 2,9 CS4 3,87 From Table 2, it can be seen that the average value of the performance assessment is 3.42. Meanwhile, the average value of the importance assessment is 4.21. The two values are used as the intersection of the X axis and Y axis in quadrant analysis. Yi Variable GAP (Importance) 4,23 4,37 4,4 3,7 3,93 -0,4 -1 -1,17 -0,5 -0,13 4,37 3,77 4,13 4,23 -1,27 -0,1 -0,66 -0,76 4,13 4,4 4,2 3,8 4,33 -0,13 -1,87 -0,87 -0,53 -0,96 4,27 4,23 4,43 4,03 -1,44 -0,3 -1,06 -0,16 4,33 4,57 4,33 4,53 -1,63 -1,4 -1,43 -0,66 Figure 2. IPA Quadrant Chart A.First quadrant Main priority (high importance dan low perfomance). Attributes in this quadrant are considered very important by the users, but the perceived performance is not in accordance to the users' wishes and the necessity to hold an increase in the quality of service. @ IJTSRD | Unique Paper ID – IJTSRD30854 | Volume – 4 | Issue – 4 | May-June 2020 Page 358
International Journal of Trend in Scientific Research and Development (IJTSRD) @ www.ijtsrd.com eISSN: 2456-6470 5.2.Conformity Level Analysis Conformity level analysis is the percentage comparison between performance and importance assessment. The final result of the average conformity level showed a value of <100%, which is 81%. That means, the citizens' aspirations service on Badung Communication and Information website shows that the quality of the website based on the attribute of the questions is not yet in accordance to the users' expectations. 5.3.GAP Analysis Gap analysis is the difference between performance and importance assessment. The final result of the average gap level showed a value of <0, which is -0.84. That means, the citizens' aspirations service on Badung Communication and Information website which are provided have been good enough and quite in accordance to the expectations of the users. 5.4.Quadrant Analysis Quadrant analysis by using Cartesian diagram with perpendicular intersection of the X and Y axis, therefore four quadrants were formed. The X axis represents the performance assessment and the Y axis represents the importance assessment. The X axis intersection is the average assessment of the overall performance (3.42), while the Y axis intersection is the average assessment of the overall importance (4.21). The result of the quadrant analysis of citizens' aspirations service on Badung Communication and Information website can be seen in Figure 3. Figure 3. Quadrant Analysis A.Quadrant I Quadrant 1 is an indicator which needs to be improved, because in this quadrant - the level of expectations is high, but the performance perceived by the users is low. Therefore, the attributes in this quadrant are the main priority for website improvement and development. Table 2. Questions Indicator in Quadrant 1 Quadrant No. Questions 2 Does the interface of the citizens' aspirations service clear and easy to understand? Does the citizens' aspirations service on the Communication and Information website easy to be operated and able to perform well? Does the citizens' aspirations service on the Communication and Information website provide personal data security when you access the service? Does the speed adequate when you access the citizens' aspirations service on the Communication and Information website? Do the information on the citizens' aspirations service clear and accurate? Is the design/appearance of the citizens' aspirations service on the Communication and Information website attractive? Do the information on the citizens' aspirations service always up-to-date? Does the admin on the Communication and Information website responsive to the users' problems? Does the admin on the Communication and Information website give a quick reply to the users' questions? Does the admin on the Communication and Information website have sufficient knowledge to answer the users' questions? 3 6 11 14 I 15 17 19 20 21 B.Quadrant II Quadrant 2 is an indicator which needs to be maintained. Since its level of expectation and performance are both high, the attributes in this quadrant have been successfully implemented in accordance to the users' expectations. The communication and information party need to ensure that the current performance of citizens' aspirations service can be managed and maintained, therefore it will be better in the future. Table 3 Questions Indicator in Quadrant 2 Quadrant No. Does the citizens' aspirations service on the Communication and Information website easy to be learned and operated? Did the personal data that you have inputted into the citizens' aspirations service form archived safely? Do the information from the citizens' aspirations service on the Communication and Information website useful for you? Does the admin on the Communication and Information website serves you politely and with courtesy? Questions 1 9 II 16 22 @ IJTSRD | Unique Paper ID – IJTSRD30854 | Volume – 4 | Issue – 4 | May-June 2020 Page 359
International Journal of Trend in Scientific Research and Development (IJTSRD) @ www.ijtsrd.com eISSN: 2456-6470 C.Quadrant III Quadrant 3 is an indicator that has low performance and expectations. Since this quadrant's level of expectation and performance are equally low, the communication and information party do not need to make improvements and pay special attention to it. Table 4 Questions Indicator in Quadrant 3 Quadrant No. Does the citizens' aspirations service on the Communication and Information website able to perform well by using browsers on laptops, computers and smart-phones? Does the citizens' aspirations service on the Communication and Information website always able to pop up the first time you access it? D.Quadrant IV Quadrant 4 is an indicator that has high performance, but low users’ expectations. Therefore, quadrant 4 is overrated by the users. Table 5 Questions Indicator in Quadrant 4 Quadrant No. Does the website address (URL) of the citizens' aspirations service on the Communication and Information website easy to remember? Does the citizens' aspirations service on the Communication and Information website in accordance to my needs? 7 Do you only use your personal data to access the citizens' aspirations services? Does the citizens' aspirations service on the Communication and Information website provide security when you input your personal data? Does the citizens' aspirations service on the Communication and Information website can be accessed whenever you need it? Do the information on the citizens' aspirations service provided in a language that you can easily understand? E.Improvement Recommendations Improvement recommendations are given for the main priority attributes that are in quadrant I (top priority), based on the result of the IPA quadrants calculation. The quadrant I attributes can be seen in table 6. Table 6. Improvement Recommendations Quadrant Recommendations The developers should pay attention to the loading speed of the website - there is a need to adjust the appearance of the website interface by changing the size of the page's width. Moreover; the graphic design, factors of colors, layout, type of letters and features that are qualified to speed up the website access will make the website responsive, so that users can feel comfortable in using the website. The developers really need to add a CAPTCHA feature in login form or registration on the website, and when the user(s) have inputted their personal data, an anonymous data should also be required to protect the personal data of the users who do not want to be published. The developers need to update the website information regularly and have interesting content (content that has commercial value, maintained quality, up-to-date and relevant) - so that the information generated can always be clear and accurate for the website users. Speed up replies to questions asked by users. Every question, complaint, request, and other interactions by the users must be answered quickly. Service providers also need to communicate well with users, since through good communication the problems can be quickly resolved The Communication and Information website party should provide regular employee training and development in order to have sufficient knowledge in answering each question from the users so that every complaint from the users can be resolved. According to Hasibuan in Wahyuni (2013), training in case study method can increase employees’ performance; such as forcing employees to identify problems, analyze situations and formulate alternative solutions for the problems. 6.CONCLUSION Based on the analysis of the suitability level of the website, it is found that the suitability level of website performance and users’ expectations is <100%, which is 81%. This percentage indicates that the website's current performance is quite in accordance to users' expectations, but there are a number of indicators that have not met users' satisfaction yet; as indicated by the GAP value of <0. The highest GAP value is on Questions 12 III 13 Questions 4 5 IV 8 10 18 Quadrant I indicator 22, which is the speed when accessing the citizens' aspirations service on the Communication and Information website is very adequate with a value of -1.87. Based on the quadrant analysis of importance performance analysis (IPA), there are 10 question indicators that became the main priority for improvement, since the users’ expectations value is higher than the current website performance. @ IJTSRD | Unique Paper ID – IJTSRD30854 | Volume – 4 | Issue – 4 | May-June 2020 Page 360
International Journal of Trend in Scientific Research and Development (IJTSRD) @ www.ijtsrd.com eISSN: 2456-6470 REFERENCES [1]Albar, Mooduto, H. A., Dahlan, A. A., Yuhefizar, Erwadi dan Napitupulu, D. (2017), “E-Government service quality based on e-GovQual approach case study in West Sumatera province”, International Journal on Advanced Science, Engineering and Information Technology, Vol. 7 No. 6, hal. 2337–2342. Intelligences Tipe Thurstone Dan Likert”, Jurnal Penelitian dan Evaluasi Pendidikan, Vol. 17 No. 2, hal. 259–274. [8]Shanshan, S. (2014), “Assessment of E-government Service Quality under User Satisfaction Orientation: The Establishment of E-Govqual Model”, Asian Journal of Business Management, Vol. 6 No. 2, hal. 111–117. [2]Fuad, A. (2013), “Penilaian Kualitas Layanan E- Government Dengan Menggunakan Dimensi E-Govqual ( Studi Kasus Pemerintah Provinsi Jawa Timur )”, Jurnal Teknik Pomits, Vol. 1 No. 1, hal. 1–6. [9]Sosiawan, E. A. (2008), “Tantangan Dan Hambatan Dalam Implementasi E-Government Di Indonesia”, Seminar Nasional Informatika, Vol. 2008 No. semnasIF, hal. 99–108. [3]Haryani, P. (2016), “Evaluasi Kualitas Layanan E- Government Pemerintah Kota Yogyakarta Dengan Metode E-Govqual Modifikasi”, Simposium Nasional RAPI XV, hal. 379–386. [10]Sugiyono. (2007), “Statistik Untuk Penelitian.pdf”. [11]Sulaiman, A. H., Aryadita, H. dan Pinandito, A. (2018), “Evaluasi Kualitas Layanan Website Pemerintah Kota Batu dengan Metode E-Govqual dan Importance Performance Analysis ( IPA )”, Jurnal Pengembangan Teknologi Informasi dan Ilmu Komputer (J-PTIIK) Universitas Brawijaya, Vol. 2 No. 2, hal. 493–502. [4]Heryana, T. (2013), “Pengaruh Penerapan E- Government Terhadap Pelaksanaan Tata Kelola Pemerintah Di Pemerintah Kabupaten Cianjur”, Jurnal Riset Akuntansi dan Keuangan, Vol. 1 No. 1, hal. 38. [12]Supriyatna, A. dan Maria, V. (2018), “Analisa Tingkat Kepuasan Pengguna dan Tingkat Kepentingan Penerapan Sistem Informasi DJP Online dengan Kerangka PIECES”, Khazanah Informatika: Jurnal Ilmu Komputer dan Informatika, Vol. 3 No. 2, hal. 88. [5]Kepuasan, R. T. (2010), “Kualitas Jasa Yang Mempengaruhi Loyalitas Dan Relevansinya Terhadap Kepuasan”, Jurnal Dinamika Manajemen, Vol. 1 No. 1, hal. 41–46. [6]Napitupulu, D. B. (2016), “Kualitas Layanan E- Government (Sebuah Analisa Di Pemkot X Dengan Pendekatan E-Govqual Dan Ipa)”, Jurnal Penelitian Pos dan informatika, Vol. 6 No. 2, hal. 153. [13]Wijaya. (2011), “Penilaian Kualitas Layanan E- Government Dengan Pendekatan Dimensi EGovqual dan Importance Performance Analysis (IPA) (Studi Kasus Pada Pemerintah Provinsi Nusa Tenggara Barat)”, Jurnal Pengembangan Teknologi Informasi dan Ilmu Komputer, Vol. 2 No. 5, hal. 1794–1802. [7]Setiawati, F. A., Mardapi, D. dan Azwar, S. (2013), “Penskalaan Teori Klasik Instrumen Multiple @ IJTSRD | Unique Paper ID – IJTSRD30854 | Volume – 4 | Issue – 4 | May-June 2020 Page 361