Download
1 / 7
70 likes | 76 Views
This study examined the determinants of agricultural innovations adoption among cooperative and non cooperative farmers in Imo State, Nigeria. The research design used in this study is descriptive survey research design. The area of study was Imo State, and data were gotten from the three zones, namely, Orlu, Owerri and Okigwe. Data were generated from a total population of 1184 registered cooperatives and non cooperative farmers. Using Taro Yamane formula, a total of 464 respondents were selected from both cooperative and non cooperative farmers. Questionnaire was the instrument of data collection. Descriptive statistics and one way Analysis of Variance ANOVA were employed to address the research questions and to test the promulgated hypothesis. The findings revealed that important determinant of adoption include educational level, annual income, farm experience, frequency of contact, cooperative membership, price of the produce, type of media used, government policy, availability of success stories, frequency of training, attitude to novel ideas, household size, extent of livelihood diversification, availability of markets and parents occupation. Determinants of agricultural innovation adoption were also the same for cooperative and non cooperative farmers. Based on the findings made in the study, the study recommends that cooperative extension services need to be revolutionalized and given adequate attention. This can be achieved by developing new framework for cooperative extension and forging a common ground for both cooperative and agricultural extension work. Apart from recruitment and deployment of competent and well motivated staff, there is the need for provision of work gadget and work tools that are in tune with technological changes. Supervision and retraining of extension staff should also become a priority. Michael, Maureen Chinenye | Ojiagu, Nkechi Cordelia | Umebali, E. Emmanuel "Determinants of Agricultural Innovations Adoption among Cooperative and Non-Cooperative Farmers in Imo State, Nigeria" Published in International Journal of Trend in Scientific Research and Development (ijtsrd), ISSN: 2456-6470, Volume-4 | Issue-3 , April 2020, URL: https://www.ijtsrd.com/papers/ijtsrd30329.pdf Paper Url :https://www.ijtsrd.com/engineering/agricultural-engineering/30329/determinants-of-agricultural-innovations-adoption-among-cooperative-and-noncooperative-farmers-in-imo-state-nigeria/michael-maureen-chinenye<br>

E N D
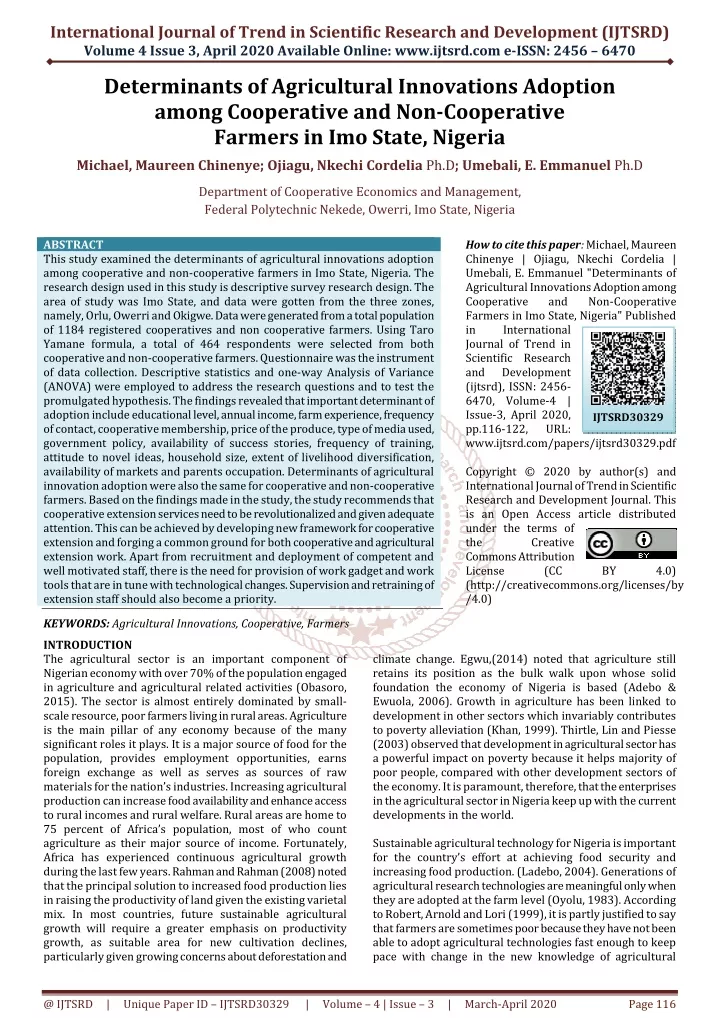
International Journal of Trend in Scientific Research and Development (IJTSRD) Volume 4 Issue 3, April 2020 Available Online: www.ijtsrd.com e-ISSN: 2456 – 6470 Determinants of Agricultural Innovations Adoption among Cooperative and Non-Cooperative Farmers in Imo State, Nigeria Michael, Maureen Chinenye; Ojiagu, Nkechi Cordelia Ph.D; Umebali, E. Emmanuel Ph.D Department of Cooperative Economics and Management, Federal Polytechnic Nekede, Owerri, Imo State, Nigeria ABSTRACT This study examined the determinants of agricultural innovations adoption among cooperative and non-cooperative farmers in Imo State, Nigeria. The research design used in this study is descriptive survey research design. The area of study was Imo State, and data were gotten from the three zones, namely, Orlu, Owerri and Okigwe. Data were generated from a total population of 1184 registered cooperatives and non cooperative farmers. Using Taro Yamane formula, a total of 464 respondents were selected from both cooperative and non-cooperative farmers. Questionnaire was the instrument of data collection. Descriptive statistics and one-way Analysis of Variance (ANOVA) were employed to address the research questions and to test the promulgated hypothesis. The findings revealed that important determinant of adoption include educational level, annual income, farm experience, frequency of contact, cooperative membership, price of the produce, type of media used, government policy, availability of success stories, frequency of training, attitude to novel ideas, household size, extent of livelihood diversification, availability of markets and parents occupation. Determinants of agricultural innovation adoption were also the same for cooperative and non-cooperative farmers. Based on the findings made in the study, the study recommends that cooperative extension services need to be revolutionalized and given adequate attention. This can be achieved by developing new framework for cooperative extension and forging a common ground for both cooperative and agricultural extension work. Apart from recruitment and deployment of competent and well motivated staff, there is the need for provision of work gadget and work tools that are in tune with technological changes. Supervision and retraining of extension staff should also become a priority. KEYWORDS: Agricultural Innovations, Cooperative, Farmers INTRODUCTION The agricultural sector is an important component of Nigerian economy with over 70% of the population engaged in agriculture and agricultural related activities (Obasoro, 2015). The sector is almost entirely dominated by small- scale resource, poor farmers living in rural areas. Agriculture is the main pillar of any economy because of the many significant roles it plays. It is a major source of food for the population, provides employment opportunities, earns foreign exchange as well as serves as sources of raw materials for the nation’s industries. Increasing agricultural production can increase food availability and enhance access to rural incomes and rural welfare. Rural areas are home to 75 percent of Africa’s population, most of who count agriculture as their major source of income. Fortunately, Africa has experienced continuous agricultural growth during the last few years. Rahman and Rahman (2008) noted that the principal solution to increased food production lies in raising the productivity of land given the existing varietal mix. In most countries, future sustainable agricultural growth will require a greater emphasis on productivity growth, as suitable area for new cultivation declines, particularly given growing concerns about deforestation and How to cite this paper: Michael, Maureen Chinenye | Ojiagu, Nkechi Cordelia | Umebali, E. Emmanuel "Determinants of Agricultural Innovations Adoption among Cooperative and Farmers in Imo State, Nigeria" Published in International Journal of Trend in Scientific Research and Development (ijtsrd), ISSN: 2456- 6470, Volume-4 | Issue-3, April 2020, pp.116-122, URL: www.ijtsrd.com/papers/ijtsrd30329.pdf Copyright © 2020 by author(s) and International Journal of Trend in Scientific Research and Development Journal. This is an Open Access article distributed under the terms of the Creative Commons Attribution License (CC (http://creativecommons.org/licenses/by /4.0) Non-Cooperative IJTSRD30329 BY 4.0) climate change. Egwu,(2014) noted that agriculture still retains its position as the bulk walk upon whose solid foundation the economy of Nigeria is based (Adebo & Ewuola, 2006). Growth in agriculture has been linked to development in other sectors which invariably contributes to poverty alleviation (Khan, 1999). Thirtle, Lin and Piesse (2003) observed that development in agricultural sector has a powerful impact on poverty because it helps majority of poor people, compared with other development sectors of the economy. It is paramount, therefore, that the enterprises in the agricultural sector in Nigeria keep up with the current developments in the world. Sustainable agricultural technology for Nigeria is important for the country’s effort at achieving food security and increasing food production. (Ladebo, 2004). Generations of agricultural research technologies are meaningful only when they are adopted at the farm level (Oyolu, 1983). According to Robert, Arnold and Lori (1999), it is partly justified to say that farmers are sometimes poor because they have not been able to adopt agricultural technologies fast enough to keep pace with change in the new knowledge of agricultural @ IJTSRD | Unique Paper ID – IJTSRD30329 | Volume – 4 | Issue – 3 | March-April 2020 Page 116
International Journal of Trend in Scientific Research and Development (IJTSRD) @ www.ijtsrd.com eISSN: 2456-6470 development. The farmers should be adequately informed in this connection, trained in new innovation and be provided with the modern equipments and tools to enhance adoption and as a result, increase production. Adoption of new technologies was found to be dependent on the interaction of a number of factors and organized delivery of inputs and outputs, provision of technical advices, stable price and credit for participating farmers are all important determinants of farmers’ adoption of innovation. (Ladebo, 2004). In the viewpoint of Onyenweaku (1991), profitability and advice from change agents were the major reasons for adoption, while the characteristics of the innovation itself “relative advantage, costs, complexity, visibility, divisibility and compatibility” are the major factors that affect the adoption of any innovation. Justina (2010), Rogers (1962) and Van Den Ban and Hawkins (1991) further observed that an innovation or technology to be adopted must pass through process of adoption which involves awareness, interest, evaluation, trial and adoption. Agricultural technology is changing fast from conventional methods and techniques to modern scientific methods and techniques. Farid et al., (2014) noted that several factors may have influence on the extent of adoption of farm practices such as characteristics of farm practice; the adopters; the change agent; and the socio-economic, biological, and physical environment in which the technology take place. Socio-psychological trait of farmers also plays an important role in technology adoption. The age, education attainment, income, family size, tenure status, credit use, value system, and beliefs are usually positively related to adoption. From the existing literature it is evident that adoption of technologies in farming practices is affected by certain factors (Ziervogel et al., 2005; Hansen et al., 2007; Salehin et al., 2009). The farmer’s attitude towards change, land, sources of information, membership of farmer’s organizations, educational level, farm income, farmer’s exposure, are the important socio-economic factors influencing adoption of farm innovations (Rousan, 2007). Factors that trigger adoption of new technologies comprise of age, education, sex, higher income level, risk orientation and decision making ability of farmers (Feder & Slade, 1984). Factors limiting adoption of new farm technology includes conservative lifestyle, illiteracy, and belief system. Agricultural cooperatives encourage members to engage in joint cultivation of food and cash crops, among others. In view of the low financial capacity and high level of underdevelopment, an individual farmer cannot achieve the desires for large-scale production. It is, therefore, in the farmers’ interest that resources are pulled together so as to gain a tremendous collective advantage and thus widen the industrial base of the economy and the management techniques of the farmers (Enikaselu et al, 2005). Successive governments in Nigeria recognize that cooperative societies are essential for the development of the agricultural sector. This laudable goal was supported by the establishment of the Agricultural Development Programmes (ADPs) and the River Basin and Rural Development Authorities (RBRDAs). Both ADPs and RBRDAs always organize farmers under their programmes into cooperative groups for better co- ordination of the farmer’s activities. The cooperatives approach to group action has been effectively utilized by these two programmes. Although, the primary objective of forming group farming cooperatives in ADPs and RBRDAs is to increase agricultural production, it has been possible to get them involved in marketing of their produce as well. Statement of the Problem Agricultural sector employs about 60% of Africa’s workforce, yet 1/4 of the world’s undernourished and hungry people live in Africa. Despite impressive economic growth rates across Africa, many of the continent’s people remain food insecure. Africa’s food insecurity is growing worse with population estimations at 2.4 billion in 2050. With vast land on the continent, famine and starvation should be a thing of the past. Major reason adduced for this situation is the use of outdated and ineffective farming methods. All over the globe, both for agricultural cooperative farmers and non- agricultural cooperative farmers, the methods of agriculture have changed considerably, with problems of diseases, unreliable rainfall and climate resulting in floods and drought. There is an urgent need to employ modern innovative technologies to help optimize yields and increase production. Unlike in other regions of the world, productivity of agriculture in Nigeria is poor (Obasoro, 2015). This has resulted to increase emphasis on agricultural transformation using agricultural innovation. This shift towards an innovation systems orientation was precipitated by the realization that despite stronger national research systems, agricultural productivity remained low as a result not only of the lack of appropriate technologies and the lack of access to those technologies, inputs, credit and access to markets and rural infrastructure, but also because of gaps in information and skills that prevented rural producers from effectively utilizing and adopting technologies (Sanginga et al., 2009). Research has shown that the extent to which these farmers adopt new innovation in the study area is low. There is therefore, the need to evaluate the extent to which the claim that cooperatives play critical roles in technology adoption can be accepted. To the best of the researcher’s knowledge, there are few empirical studies in the literature that specifically assessed the effects of agricultural innovation systems on improving production of rural farmers in Nigeria context. Unfortunately, in the few studies that do exist, the analytical methods employed were mainly qualitative. This study is apt not only because it came at the time when the government is doing all it could to transform agriculture but also because of the need to capture the increasing role of cooperative societies in knowledge transfer. There is the need to understand the level of awareness of these agricultural innovations among cooperative and non- cooperative farmers, as well as understand the extent of adoption of agricultural innovation among cooperative and non-cooperative farmers. There is also the need to empirically determine the effect of agricultural innovation adoption on productivity of cooperative and non-cooperative farmers. Objectives of the Study The main objective of the study is to examine and also compare the determinants of agricultural innovations adoption among cooperative and non-cooperative farmers in Imo State, Nigeria. Research Hypotheses H0: There is no significant difference in the determinants of adoption of agricultural innovations among cooperative and non-cooperative farmers. @ IJTSRD | Unique Paper ID – IJTSRD30329 | Volume – 4 | Issue – 3 | March-April 2020 Page 117
International Journal of Trend in Scientific Research and Development (IJTSRD) @ www.ijtsrd.com eISSN: 2456-6470 METHODOLOGY Research Design The research design used in this study is descriptive survey. Here, data was gathered from a large number of respondents who constitute the sample to be the representative of the population of interest. These data collected were important in understanding the fact and events better and gives better interpretation and explanation, as well as make predictions about variables easy. In gathering the data, a cross-sectional research design was deployed whereby a one-time observation was made on the elements of the sample and on those variables which were relevant to this research. Area of Study The area of study is Imo State. It is one of the 36 states in Nigeria, set in the heart of Igbo land, and arguably the most strategic of the five States in South East Nigeria. The important cities in the State are Owerri, Okigwe and Orlu. it has an estimated population of about 4,769,239 as of 2006 (source: National Census Commission 2006 ).. The State shares boundary with Anambra in the North, Abia in the East and Rivers State in the South. The State Slogan is Heartland and It is currently referred to as the entertainment capital of Nigeria because of its high density of spacious hotels, high street casinos, production studios and high quality centres of relaxation. It is the home to an annual beauty pageant called "Miss Heartland". Owerri is the State capital. It was also the last of four capitals of the Republic of Biafra in 1969. The capital of the Secessionist State was continuously being moved as Nigerian troops captured the older capitals. The State sits in the rain forest and produces many agricultural products, such as yams, cassava, taro, corn, rubber and palm products. The State sits on huge crude oil and natural gas reserves like most of the Igbo land areas. Imo State has 27 Local Government Areas which are divided into three zones that is Orlu zone, Owerri zone and Okigwe zone. Orlu zone covers local government areas like Oguta, Orsu, Ideato North, Ideato south, Oru East, Oru West, Njaba, Nwangele, Nkwere, Isu, Umuna, Ohaji Egbema. In Okigwe zone we have these Local Government Areas: Okigwe, Onuimo, Isiala Mbano, Iheme, Ihiteuboma, Obowo, Umuna. Owerri zone has the following Local Government Areas: Mbaitoli, Ikeduru, Owerri Municipal, Owerri West, Owerri North, Ngor Okpala, Abor Mbaise, and Ezinihite. The State is agrarian in nature with over 60% of the population into one form of agriculture or the other. Farming took place more in rural areas and most of the farmers in the State belong to cooperatives popular crop, farming techniques, literacy level etc. Population of the Study The population of the study consists of all registered agricultural cooperatives in Imo State and non-cooperative farmers registered in the Ministry of Agriculture Imo State. From the data gotten from the State Ministry of Cooperative that is Ministry of Commerce and Industry in 2017, there was a total of 1184 registered agricultural cooperatives that are active and functional. The researcher has a total population of 2678 non-cooperative farmers, gotten from the register of All Farmers Association of Nigeria Imo State branch. These 1184 agricultural cooperatives have membership strength of 38,520. They all formed the population of the study. Sample Size Determination and Sampling Technique Multistage sampling technique was used in this study. All agricultural cooperatives in the area were categorized into the three agricultural zones in the state. . In stage one, the Local Government Areas that were predominantly agrarian, where these agricultural cooperatives were based was purposively selected from each of the three agricultural Zones: Owerri Zone, Orlu Zone and Okigwe Zone. In stage two, ten percent of the cooperatives in these Local Government Areas were selected using simple random sampling technique. Thirdly, ten percent of the members of these selected cooperatives were also selected using simple random sampling technique. The choice of 10% is supported by Alreck and Settle (1995) who states that it is seldom necessary to sample more than 10% of the population. Due to the comparative nature of the study, 10% of active registered farmers in the local governments were also selected. These farmers live in the same areas the selected cooperatives members live and share similar socio-economic characteristics. Table1. Showing Agricultural Zones, Number of Cooperatives and members selected No. of Agricultural Cooperatives 24 21 25 820 510 29 21 21 642 436 26 24 22 609 473 213 6534 4715 To determine the sample size, Taro Yamani formular was used. The formular was n= N/1+N(e)2 Where n = desired sample size No of No of registered individual selected 61 62 51 48 54 44 55 49 47 471 No of members No. of registered individual farmers No of members selected Zones cooperative selected 2 2 3 3 2 2 3 2 2 21 Owerri Ikeduru Ezinihite Ngor Okpala Okigwe Obowo Onuimo Iheme Orlu Njaba Nkwere Oru West Total 720 714 610 628 72 71 82 92 63 64 78 68 60 653 928 630 483 539 782 689 546 490 @ IJTSRD | Unique Paper ID – IJTSRD30329 | Volume – 4 | Issue – 3 | March-April 2020 Page 118
International Journal of Trend in Scientific Research and Development (IJTSRD) @ www.ijtsrd.com eISSN: 2456-6470 N = population generated for the study E = Acceptable error limit (0.05%) Substituting the formular for Cooperative Farmers, 653/1+ (653 X 0.0025) = 248 Substituting the formular for Non-cooperative Farmers 471/ 1+(471 x 0.0025) = 216 Sources of Data Two main sources of data were employed to gather data for this study. These are secondary and primary sources: (1) Secondary Sources: Secondary data were sourced from already existing materials such as textbooks, government publications and bulletins, journals, unpublished theses and dissertations, discussion papers, etc. (2) Primary Sources: First-hand data were collected from primary sources. The main instrument for this task was structured questionnaire which contained uniform questions made up of appropriate combination of Likert formatted and some open ended questions which were administered on all the respondents. Instrument for Data Collection The instrument used for data collection is a structured questionnaire designed by the researcher, in line with the objectives of the study. Information obtained was with respect to socio-economic characteristics of the farmers such as age, gender, education, farm size, household size, and income. Other information obtained included responses about their adoption behaviour and their productivity behaviour. Data for evaluation of effect of adoption was obtained through the employment of Likert-type scale with five levels: Strongly Agree (5); Agree (4); Undecided (3); Disagree (2); and Strongly Disagree (1) to obtain responses from the respondents. The cooperative members were requested to indicate their level of agreement with each of the items relating to savings pattern in the questionnaire. A total of 248 copies of questionnaires were distributed to cooperative farmers while 216 were distributed to non-cooperative farmers. However, only 206 were dully filled from cooperative farmers and 196 for non-cooperative farmers. Method and Tools for Data Analysis Descriptive statistics such as frequency distribution, means and percentages was used to analyze the data obtained to address the objectives of the study. Also inferential statistics, such as One-Way Analysis of Variance (ANOVA), t-test and regression was employed to address the research questions and to test the promulgated hypotheses. Specifically, mean rating and descriptive statistics were used to address the research questions, while ANOVA, t-test was used to test the hypotheses at 5% level of significance. Objective number one was achieved using one-way ANOVA. Decision Rule: Accept the null hypothesis if the f-value is not significant (f > 0.05) Objective number two was achieved using t-test DATA PRESENTATION AND ANALYSIS Socio-Economic Characteristics of the Respondents In this chapter, data collected were presented and analyzed. Research questions and hypothesis were respectively answered and tested based on the data collected. Table 2: Socio-economic characteristics of cooperative and non cooperative farmers studied. Variables Sex Male Female Total Age Less than 25 26- 40 41-65 Above 65 Total Marital status Single Married Widowed/divorced Total Frequency Percentage (%) 164 41 238 59 402 100.00 41 10 111 28 184 46 66 16 402 100.00 91 23 194 48 116 29 402 100.00 @ IJTSRD | Unique Paper ID – IJTSRD30329 | Volume – 4 | Issue – 3 | March-April 2020 Page 119
International Journal of Trend in Scientific Research and Development (IJTSRD) @ www.ijtsrd.com eISSN: 2456-6470 Farm size Less than I hectare 3 hectare Above 3 hectare Total Educational qualification No formal education Primary Secondary Tertiary Total Household size 1-3 4-6 7-9 10-12 Above 12 Total Years of cooperative membership Non members 0-5 years 6-10 years 11-15 years 16-20 years Above 21 years Total Output Less than 1ton 1-3 tons 4-10 tons Above 10tons Total Annual income Less than 500,000 500,001 – 1 million 1 m- 3 million Above 3 million Total 152 187 63 402 45 172 108 77 402 53 94 158 73 24 402 38 47 15 100.00 11 43 27 19 100.00 13 23 39 18 5 100 49 13 24 09 05 100 11 42 35 12 100 13 41 31 15 100 196 54 96 33 20 402 44 168 141 49 402 53 166 123 60 402 Source: Field Survey, 2018 Socio-economic profile of the respondents as shown in Table 2 reveals that 59% of the respondents were female while 41% were male. The blend of both male and female was proportionate as there were more females than males in most cooperatives that operate in the area studied. About 84% of the respondents belong to active population bracket (25-65 years). Ten percent of the sample selected was less than 25 years old while 5% were above 65 years. In terms of marital status, 23% of the respondents were single, while 48% were married. Surprisingly, 29% were widowed /divorced. Majority of respondents had more than three hectares of land. Thirty percent cultivate less than three hectares whereas 15% worked on more than three hectares. Result showed that over 80% of the respondents had formal education. Nineteen percent attempted tertiary education, while 11% did not attempt any formal education. Furthermore, the profile showed that majority of the respondents had large household size. Sixty-two percent had 4-9 persons in their household, whereas only 13% had 1-3 persons. Table 2 revealed that 41% of the respondents do not belong to cooperative societies, while 51% were cooperative members. Majority of the farmers who belonged to cooperative have spent between 6-10 years in the cooperative. In terms of volume of agricultural production of the respondents, 77% produce between 2-10 tonnes. Annual income profile of the respondents showed that 72% earn between 500,000 – 3 million naira. Thirteen percent earn less than 500,000, while 15% earn above 3 million naira. Table 3: Determinants of agricultural innovation adoption among cooperative and non cooperative farmers Mean (Cooperative) (X) Education Level 4.2 Annual Income 4.9 Farm experience 4.39 Frequency of contact with extension staff 3.87 Remark (Cooperative) (X) Accepted Accepted Accepted Accepted Mean (Non - Cooperatives) (X) 4.51 4.3 3.4 3.93 Remark (Non cooperative) (X) Accepted Accepted Accepted Accepted Determinants @ IJTSRD | Unique Paper ID – IJTSRD30329 | Volume – 4 | Issue – 3 | March-April 2020 Page 120
International Journal of Trend in Scientific Research and Development (IJTSRD) @ www.ijtsrd.com eISSN: 2456-6470 Cooperative Membership Farm size Price of the produce Type of Media Government policy Source of funding Availability of success stories Market value of farm assets Frequency of training Attitude to novel ideas Household size Extent of livelihood diversification Location of the farmers Availability of markets Motive for farming Parents’ occupation 3.92 3.2 3.3 4.1 3.9 2.8 4.8 2.7 4.31 3.82 3.52 3.78 2.48 3.2 2.73 3.2 Accepted Accepted Accepted Accepted Accepted Rejected Accepted Rejected Accepted Accepted Accepted Accepted Rejected Accepted Rejected Accepted 3.63 2.47 3.2 3.8 3.6 3.2 4.5 2.9 3.92 4.0 3.71 3.3 3.4 3.6 2.51 3.3 Accepted Rejected Accepted Accepted Accepted Accepted Accepted Rejected Accepted Accepted Accepted Accepted Accepted Accepted Rejected Accepted Source: Field Survey, 2018 Table 3: reveals that important determinants of adoption include educational level, annual income, farm experience, frequency of contact, cooperative membership, price of the produce, type of media used, government policy, availability of success stories, frequency of training, attitude to novel ideas, household size, extent of livelihood diversification, availability of markets and parents occupation. Interestingly, farm size, market value of farm assets, location of farmers and motives for farming were not important determinants of adoption of agricultural innovation in the area studied. Hypothesis 1 Ho: There is no significant difference in determinants of adoption of agricultural innovation among cooperative and non- cooperative farmers. Table 4: ANOVA table (One way) comparing determinants of agricultural innovation adoption among cooperative and non-cooperative farmers Sum of Squares Attitude to novel ideas Between Groups Within Groups Total Education Between Groups Within Groups Total Farm size Between Groups Within Groups Total Frequency of contact Between Groups Within Groups Total Availability of markets Between Groups Within Groups Total Membership of cooperative Between Groups Within Groups Total Location of the farm Between Groups Within Groups Total Farm experience Between Groups Within Groups Total Price of the produce Between Groups Within Groups Total Motive for farming Between Groups Within Groups Total Parents occupation Between Groups Within Groups Total Df 5 397 402 5 397 402 5 397 402 5 397 402 5 397 402 5 397 402 5 397 402 5 397 402 5 397 402 5 397 402 5 397 402 Mean Square .350 .244 7.022 6.452 8.992 1.168 1.476 .479 3.125 .734 5.639 .628 2.778 2.215 3.206 2.043 39.108 1.534 .280 .227 .807 .338 F Sig. .209 .366 .210 .109 .061 1.752 144.873 146.625 35.108 3832.611 3867.718 44.960 693.734 738.693 7.382 284.511 291.893 15.624 436.001 451.625 28.195 372.803 400.998 13.888 1315.710 1329.598 16.030 1213.803 1229.833 195.541 911.332 1106.873 1.398 135.076 136.473 4.035 200.950 204.985 1.436 1.088 5.699 3.082 4.257 5.985 0.910 1.254 1.569 3.490 1.229 2.385 .282 .027 .100 .094 .087 @ IJTSRD | Unique Paper ID – IJTSRD30329 | Volume – 4 | Issue – 3 | March-April 2020 Page 121
International Journal of Trend in Scientific Research and Development (IJTSRD) @ www.ijtsrd.com eISSN: 2456-6470 Type of media in use Household size Annual income Training attendance Source of fund for farming Value of productive assets Success stories Attitude of extension agents Between Groups Literacy level of farmers Between Groups Within Groups Total Between Groups Within Groups Total Between Groups Within Groups Total Between Groups Within Groups Total Between Groups Within Groups Total Between Groups Within Groups Total Between Groups Within Groups Total 11.944 672.254 684.198 5.548 481.645 487.193 28.710 1088.783 1117.493 18.366 1004.967 1023.333 5.920 615.273 621.193 13.003 331.956 344.958 7.330 236.055 243.385 21.271 1090.794 1112.065 13.646 431.419 445.065 5 2.389 1.132 1.110 .811 5.742 1.833 3.673 1.692 1.184 1.036 2.601 .559 1.466 .397 4.254 1.836 2.729 .726 2.111 1.368 3.133 2.171 1.143 4.653 3.689 2.317 3.758 1.03 .234 .008 .066 .336 .720 1.03 .092 .082 397 402 5 397 402 5 397 402 5 397 402 5 397 402 5 397 402 5 397 402 5 397 402 5 397 402 Within Groups Total Between Groups Within Groups Total Source: Field Survey, 2018 ANOVA table in Table 4 revealed that determinants of adoption were same for both cooperative and non-cooperative farmers. The hypothesis tested was not significant at 5% level. Therefore, we accept the null hypotheses and conclude that there is no significant difference in determinants of adoption of agricultural innovation among cooperative and non-cooperative farmers. Findings and Recommendations Important determinant of adoption include educational level, annual income, farm experience, frequency of contact, cooperative membership, price of the produce, type of media used, government policy, availability of success stories, frequency of training, attitude to novel ideas, household size, extent of livelihood diversification, availability of markets and parents occupation. Determinants of agricultural innovation adoption were also the same for cooperative and non-cooperative farmers. Based on the findings made in the study, the study recommends that cooperative extension services need to be revolutionalized and given adequate attention. This can be achieved by developing new framework for cooperative extension and forging a common ground for both cooperative and agricultural extension work. Apart from recruitment and deployment of competent and well motivated staff, there is the need for provision of work gadget and work tools that are in tune with technological changes. Supervision and retraining of extension staff should also become a priority. REFERENCES [1]Adebo, G. M & Ewuola, S. O. (2006). Effect of training on improved farm practices by farmers in Ondo State, Nigeria. Journal of Agricultural Extension, 9: 43 – 49. [3]Khan, H. A (1999). Sectoral growth and Poverty Alleviation: A Multiplier Techniques Applied Development, 27(3), 521 – 530. Decomposition South to Africa. World [4]Ladebo, O. J. (2004). Job Behaviour and attitude of agricultural faculty: Beyond the influence of biographical factors. Journal of Extension System, 20 (2),89 – 103. [5]Onyenwaku, C. E & Mbaba, A.C (1991). The Adoption of seed yam minisett multiplication technology by farmers in Anambra State, Nigeria. Journal of Agricultural Extension, 627: 26 – 27. [6]Rahman, S. & Rahman, M. (2008) Impact of land fragmentation and resource ownership on productivity and efficiency: The case of rice producers in Bangladesh. Land Use Policy 26 (2008) 95–103. [7]Thirtle, C., Lin, L. & Piese, J. (2003). The impact of research led agricultural productivity growth on poverty reduction in Africa, Asia and Latin America. World Development, 31 (2) pp. 1957 – 1975. [8]Van den Ban & Hawkin, H.S (1991). Agricultural Extension Second Edition Blackwell Science Ltd. London, pp.96 – 119. [2]Justina, M. U (2010). Agricultural Extension: The Human Development Computer Edge. Enugu. Perspective. First Edition. @ IJTSRD | Unique Paper ID – IJTSRD30329 | Volume – 4 | Issue – 3 | March-April 2020 Page 122