Download
1 / 8
80 likes | 89 Views
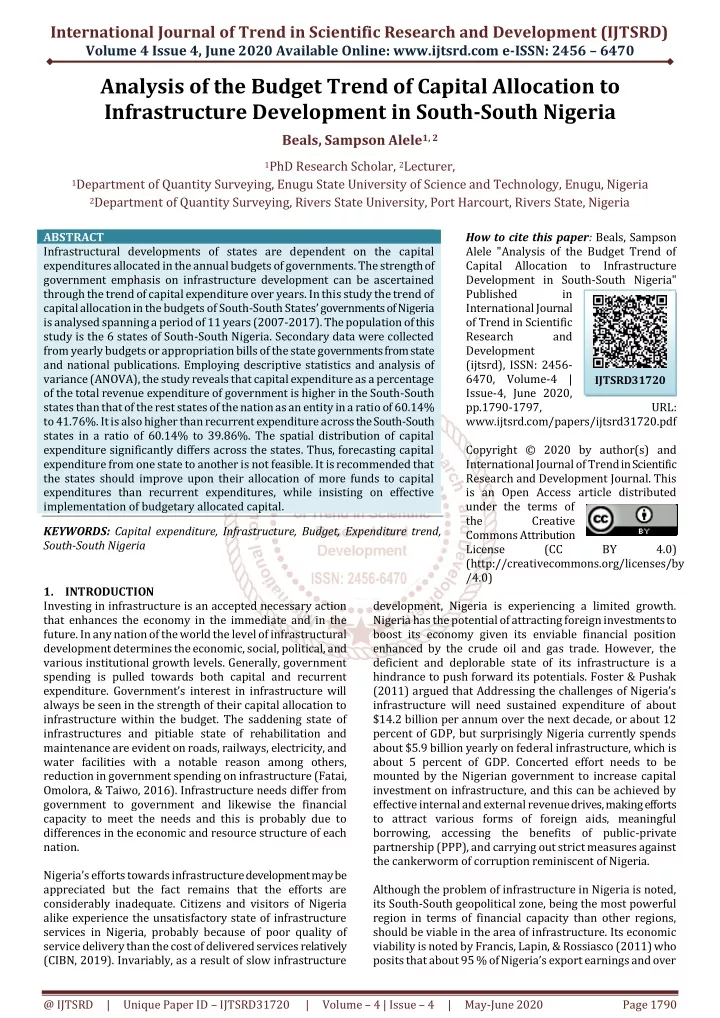
Infrastructural developments of states are dependent on the capital expenditures allocated in the annual budgets of governments. The strength of government emphasis on infrastructure development can be ascertained through the trend of capital expenditure over years. In this study the trend of capital allocation in the budgets of South South States' governments of Nigeria is analysed spanning a period of 11 years 2007 2017 . The population of this study is the 6 states of South South Nigeria. Secondary data were collected from yearly budgets or appropriation bills of the state governments from state and national publications. Employing descriptive statistics and analysis of variance ANOVA , the study reveals that capital expenditure as a percentage of the total revenue expenditure of government is higher in the South South states than that of the rest states of the nation as an entity in a ratio of 60.14 to 41.76 . It is also higher than recurrent expenditure across the South South states in a ratio of 60.14 to 39.86 . The spatial distribution of capital expenditure significantly differs across the states. Thus, forecasting capital expenditure from one state to another is not feasible. It is recommended that the states should improve upon their allocation of more funds to capital expenditures than recurrent expenditures, while insisting on effective implementation of budgetary allocated capital. Beals, Sampson Alele "Analysis of the Budget Trend of Capital Allocation to Infrastructure Development in South-South Nigeria" Published in International Journal of Trend in Scientific Research and Development (ijtsrd), ISSN: 2456-6470, Volume-4 | Issue-4 , June 2020, URL: https://www.ijtsrd.com/papers/ijtsrd31720.pdf Paper Url :https://www.ijtsrd.com/management/accounting-and-finance/31720/analysis-of-the-budget-trend-of-capital-allocation-to-infrastructure-development-in-southsouth-nigeria/beals-sampson-alele<br>

E N D
International Journal of Trend in Scientific Research and Development (IJTSRD) Volume 4 Issue 4, June 2020 Available Online: www.ijtsrd.com e-ISSN: 2456 – 6470 Analysis of the Budget Trend of Capital Allocation to Infrastructure Development in South-South Nigeria Beals, Sampson Alele1, 2 1PhD Research Scholar, 2Lecturer, 1Department of Quantity Surveying, Enugu State University of Science and Technology, Enugu, Nigeria 2Department of Quantity Surveying, Rivers State University, Port Harcourt, Rivers State, Nigeria ABSTRACT Infrastructural developments of states are dependent on the capital expenditures allocated in the annual budgets of governments. The strength of government emphasis on infrastructure development can be ascertained through the trend of capital expenditure over years. In this study the trend of capital allocation in the budgets of South-South States’ governments of Nigeria is analysed spanning a period of 11 years (2007-2017). The population of this study is the 6 states of South-South Nigeria. Secondary data were collected from yearly budgets or appropriation bills of the state governments from state and national publications. Employing descriptive statistics and analysis of variance (ANOVA), the study reveals that capital expenditure as a percentage of the total revenue expenditure of government is higher in the South-South states than that of the rest states of the nation as an entity in a ratio of 60.14% to 41.76%. It is also higher than recurrent expenditure across the South-South states in a ratio of 60.14% to 39.86%. The spatial distribution of capital expenditure significantly differs across the states. Thus, forecasting capital expenditure from one state to another is not feasible. It is recommended that the states should improve upon their allocation of more funds to capital expenditures than recurrent expenditures, while insisting on effective implementation of budgetary allocated capital. KEYWORDS: Capital expenditure, Infrastructure, Budget, Expenditure trend, South-South Nigeria How to cite this paper: Beals, Sampson Alele "Analysis of the Budget Trend of Capital Allocation to Infrastructure Development in South-South Nigeria" Published in International Journal of Trend in Scientific Research and Development (ijtsrd), ISSN: 2456- 6470, Volume-4 | Issue-4, June 2020, pp.1790-1797, www.ijtsrd.com/papers/ijtsrd31720.pdf Copyright © 2020 by author(s) and International Journal of Trend in Scientific Research and Development Journal. This is an Open Access article distributed under the terms of the Creative Commons Attribution License (CC (http://creativecommons.org/licenses/by /4.0) IJTSRD31720 URL: BY 4.0) 1.INTRODUCTION Investing in infrastructure is an accepted necessary action that enhances the economy in the immediate and in the future. In any nation of the world the level of infrastructural development determines the economic, social, political, and various institutional growth levels. Generally, government spending is pulled towards both capital and recurrent expenditure. Government’s interest in infrastructure will always be seen in the strength of their capital allocation to infrastructure within the budget. The saddening state of infrastructures and pitiable state of rehabilitation and maintenance are evident on roads, railways, electricity, and water facilities with a notable reason among others, reduction in government spending on infrastructure (Fatai, Omolora, & Taiwo, 2016). Infrastructure needs differ from government to government and likewise the financial capacity to meet the needs and this is probably due to differences in the economic and resource structure of each nation. Nigeria’s efforts towards infrastructure development may be appreciated but the fact remains that the efforts are considerably inadequate. Citizens and visitors of Nigeria alike experience the unsatisfactory state of infrastructure services in Nigeria, probably because of poor quality of service delivery than the cost of delivered services relatively (CIBN, 2019). Invariably, as a result of slow infrastructure development, Nigeria is experiencing a limited growth. Nigeria has the potential of attracting foreign investments to boost its economy given its enviable financial position enhanced by the crude oil and gas trade. However, the deficient and deplorable state of its infrastructure is a hindrance to push forward its potentials. Foster & Pushak (2011) argued that Addressing the challenges of Nigeria’s infrastructure will need sustained expenditure of about $14.2 billion per annum over the next decade, or about 12 percent of GDP, but surprisingly Nigeria currently spends about $5.9 billion yearly on federal infrastructure, which is about 5 percent of GDP. Concerted effort needs to be mounted by the Nigerian government to increase capital investment on infrastructure, and this can be achieved by effective internal and external revenue drives, making efforts to attract various forms of foreign aids, meaningful borrowing, accessing the benefits of public-private partnership (PPP), and carrying out strict measures against the cankerworm of corruption reminiscent of Nigeria. Although the problem of infrastructure in Nigeria is noted, its South-South geopolitical zone, being the most powerful region in terms of financial capacity than other regions, should be viable in the area of infrastructure. Its economic viability is noted by Francis, Lapin, & Rossiasco (2011) who posits that about 95 % of Nigeria’s export earnings and over @ IJTSRD | Unique Paper ID – IJTSRD31720 | Volume – 4 | Issue – 4 | May-June 2020 Page 1790
International Journal of Trend in Scientific Research and Development (IJTSRD) @ www.ijtsrd.com eISSN: 2456-6470 80 % of federal government revenue accrue from the oil sector in the zone and Niger Delta as a whole. Surprisingly Nwogwugwu, Alao &Egwuonwu (2012) among others have tagged the region as suffering from infrastructural decay and low human development. Six states make up the South-South region namely: Akwa-Ibom, Bayelsa, Cross River, Delta, Edo and Rivers states. Three other states – Abia, Imo, and Ondo added to the south-south zone makes it the Niger Delta area of Nigeria. It will be of interest to investigate the capital investment trend of the South-South region over a time series in order to determine its emphasis on infrastructure development. Is infrastructure deficit a result of insufficient budgetary capital allocation over the years or perhaps something else? This is the primary question this study seeks to answer. The period of study covered eleven years (2007- 2017). 2.PROBLEM FORMULATION, HYPOTHESIS Limited and poor public utilities in Nigeria are observable (Mohammed, 2011; World Economic Forum (WEF), 2010, cited in Akanbi (2013); Edame and Fonta, 2014). The budget figures of Nigeria over the years has raised recurrent expenditure above capital expenditure which is meant for infrastructural development (Nwosu and Okafor, 2014; Idahosa and Nchuchuwe, 2005). The arguments of these authors point to the problem of capital allocation (insufficient capital allocation) as a major problem in the budgetary planning of infrastructure provision. The South- South region of Nigeria is also in the experience of infrastructure deficit and degradation (Okinono, Salleh, and Din, 2015; Nwogwugwu, Alao & Egwuonwu, 2012). The reasons may not be farfetched. This research therefore, is aimed at analysing the capital expenditure trend of South-South States of Nigeria (2007- 2017) by means of the annual budget. The underlining interest is to investigating the direction of government’s emphasis in the development of infrastructure through budgetary planning and makes suggestions on relevant improvements. The objectives are: A.To ascertain the public capital budgetary allocation strength in South-South region of Nigeria in relation to that of the rest regions of Nigeria. B.To examine the weight of capital expenditure viz-a-viz recurrent expenditures governments of Nigeria. C.To examine the capital expenditure trend in the budgets of South-South state governments of Nigeria. Three hypotheses are put forward: H1 : Capital expenditure as percentage of total Government revenue is lesser in South-South States than that of the rest regions of Nigeria. H2 : Capital expenditures as percentage of total Government revenue are lesser than recurrent expenditures in the budgets of South-South state governments of Nigeria. H3 : There is no significant difference in the budget allocation of aggregate capital expenditure among the South-South state governments of Nigeria 3.LITERATURE REVIEW 3.1.Theoretical Basis Public expenditure is spending carried out by government of nations, among others for the provision of infrastructure for the public. In the 20th century, on the issue of determining levels of income and distribution in the economy, John Maynard Keynes argued the role of public expenditure. His theory called the Keynesian theory opines that striking a balance between public revenue and expenditure by the government will yield maximum satisfaction to the public (Nwanne, 2015). In other words, there is the need for Governments at all levels to raise revenue from various sources for public-sector capital expenditures. Musgrave (1964) also propounded the Musgrave theory of public expenditure which posits that per capita income decrease leads to decrease in the demand for public services. The underlining fact is that Government will be consciously compelled to increase expenditure on public services once per capital income levels and of course demand for public services rise. These theories among other ones point to the fact that public capital expenditure for public infrastructure development is influenced by government revenue and necessarily government priority to budget capital allocation. 3.2.Budgeting and Budget Analysis The value of budgets to various institutions, including government, cannot be over emphasised. In simple terms, a budget is a plan of how financial resources are to be allocated and used during a specified period of time. A budget is simply the statement of expected income and expenditure over a time period, usually a year of the government (Ojo, 2012). In the opinion of Adeniji (2014), a budget is a plan quantified in monetary terms prepared and approved prior to a defined period of time usually showing income to be generated as planned and/or expenditure to be attrected during that period and the capital to be invilved to attain a required objective. With respect to industrial organizations, Banga and Sharma (2011) opined that budget should be based on estimated future requirement for a definite period of time, and should be prepared by taking the help of previous statistical data. Thus, they defined budget as “forecasting and preplanning for the next period using past experience, market trends and present position.” The foregoing definitions highlight the fact that a budget is an approved estimate based on forecast of a planned revenue generation and expenditure for the economic benefit of an organization within a period of time. The budget is a type of operating plan that covers (or at least should cover) all financially relevant information on revenue and expenditure and also serves as the basis for financial reporting. A sound budget that adheres to national or international budgetary standards and procedures is a good indicator of strong financial management capabilities. Budgeting is an art of budget making or the process of actualizing a budget. Budgeting helps you to plan for both short term and long term and ensures that your expenditure is less than your revenue. Budgeting continues to be recognized as one of the most critical policy making processes, reflecting national priorities and previous policy choices (Guess & LeLoup, 2010). Budgeting is important in governance and policy making. It is the most central activity of government and it affects all aspects of government action in a most profound manner and thus, it could be considered to be at the technical core of government activities (Gibran & Sekwat, 2009). In the opinion of Onah & Edame (2008), in Edame & Ejue (2013), budgeting can be viewed from some perspectives that includes: as an allocation mechanism, as a process that organizes the appropriation of money, as a technical tool for controlling expenditures, as a ritual many OBJECTIVES AND of South-South state @ IJTSRD | Unique Paper ID – IJTSRD31720 | Volume – 4 | Issue – 4 | May-June 2020 Page 1791
International Journal of Trend in Scientific Research and Development (IJTSRD) @ www.ijtsrd.com eISSN: 2456-6470 political and government figures go through to a nearby fore- ordained concluding processes, and as a measurement of certain outputs of the government system. Several budgeting approaches exist in government principal among which (in the Nigerian context) is the incremental budgeting/traditional line item budgeting.In the traditional line item approach government departments are given budget “ceilings” or “envelops” as expenditure limits within which they must keep their budget estimates, having regard to any increments on specific line items from the previous year due to inflation (Feese, 2016).The incremental budget approach though having its short-comings has continued to be used, and in fact most recurrent budgets in government tend to be made on incremental basis (Ogboru, 2016). Budget analysis involves detailed review of the budget. Generally, the following are specific things budget analysis involves: Collection, studying and interpretation of budget data, correlating the budget data in relationship to other relevant information such as State policies and programmes, and establishing findings and results (Parliament of the Republic of South Africa, 2011). Budget analysis is an effective tool for fishing out and bringing to the notice of government discrepancies in government revenue and expenditure, and for drawing government’s attention to their stated policy priorities. In other words, government’s expenditure is easily monitored in this process of budget analysis. Generally speaking, budget measures/financial measures often are used to give meaning to budgetary and financial data. By standardizing budgetary data against another factor or sets of factors, analysts derive meaning, often stated as a ratio or percentage, from the relationship (Lewis, 2003). 3.3.The Public Sector and Physical Infrastructure The value of infrastructure to the development of any nation is varied: it boosts economic growth and vise-versa, enhances the productivity of workers, helps better social life, provides needed comfort and wellbeing to people, serves as good instrument for effective leadership, etc. The term Public sector that encompasses public infrastructure simply refers to the part of the economy that is controlled by the government for the purpose of providing basic government services (Obara, 2013, as cited in Lawyer 2013). It comprises publicly controlled or funded enterprises or agencies that deliver goods, services or public ventures. The Institute of Internal Auditors (2011) states that the public sector consists of an expanding ring of organizations, with government at the centre, followed by agencies and public enterprises. Quality infrastructure facilities produce socioeconomic environment that is conducive to the boosting of private sector initiatives. Wilkins and Zurawski (2014) opined thatphysical infrastructure can be classified in various ways, but a standard grouping is: Municipal Infrastructure, such as street lighting, urban roads, bridges infrastructure (pipes, sewage works, flood management systems, etc); Utilities, such as gas, water and electricity; Transportation, such as highways and rail; and Social Infrastructure, such as schools and hospitals. It is worthy to note that though government is at the centre of the public sector, its physical infrastructure drives serve the private sector as well and the private sector in turn boosts infrastructure developments. 3.4.Public Infrastructure Condition in South-South Nigeria United Nations Development Programmes (UNDP) (2006) posits that the South-South region of Nigeria provides one- fifth of the energy needs of the United States, yet energy availability is poor and there is an almost total lack of roads in this region whose wealth is funding gigantic infrastructural development in other parts of Nigeria and expensive peacekeeping activities in other parts of Africa. In terms of infrastructural development, Okinono, Salleh, and Din (2015) compared the south-south region to other regions of Nigeria which do not produce oil and lamented the discouraging position of the South-South. The South-South zone of Nigeria contributes about 80% of Nigerian’s national wealth (Nwogwugwu, Alao & Egwuonwu, 2012). The natural environment of the people of the area is disrupted by oil exploration thereby affecting their means of livelihood. Oil exploration has sparked off agitations and protests from angry youths who feel government’s attention to the well being of the people and to infrastructural development of the area is grossly inadequate compared to the inputs of the area in the wealth of the nation. Such youthful agitations have moved further to militancy, cultism, destruction of government properties, and sabotage of various governments’ economic processes. This has given rise to economic, social and political instability of the area. Indeed the region is suffering from infrastructural decay and low human development (Nwogwugwu, Alao &Egwuonwu, 2012). Details about the state of infrastructures in the six (6) geopolitical zones of Nigeria are presented in table 1 below. From the table, it is evident that the south-south region compared to other regions of Nigeria is in a discouraging position in terms of infrastructure. In terms of infrastructural development assessed in percentages, the South-South zone is second to the least (after South East zone) in the infrastructural areas of education, water resources, and health. On a general note infrastructural development enhances employment, and infrastructural lack influences unemployment. The table is quite explicit in pointing to the fact that the South-South zone of Nigeria is least in unemployment rating of 9.5 within the ages of 19-24 of the population as compared to other zones of the Country. One thing is evident: the availability of required infrastructure for the region is quite insufficient with respect to the fast growing demographic needs. 3.5.Empirical Review Using descriptive analysis, Ogujiuba & Ehigiamusoe (2014) examined the 2012 Federal implementation of capital budget in Nigeria. Only 51% of the total appropriated funds for capital expenditures, from the findings, were utilized as at the end of 2012. The level of performance observed in the study is inadequate to enhance rapid economic development and minimize poverty. In analysing the trends of budgetary provision for construction projects in Gombe state, Nigeria, Sani , Usman, , Kunya & Shehu (2018) tried to find out the relationship between total budget size, capital budget expenditure and construction budget allocations. Using Pearson Product-Moment Correlation technique with SPSS, the finding shows that as the amount of budget size and capital expenditure increases allocation to construction sector tends to increase. Kuntari Government Budget and subterranean @ IJTSRD | Unique Paper ID – IJTSRD31720 | Volume – 4 | Issue – 4 | May-June 2020 Page 1792
International Journal of Trend in Scientific Research and Development (IJTSRD) @ www.ijtsrd.com eISSN: 2456-6470 and Chariri (2019) in Indonesia carried out a study for ascertaining factors that influence capital expenditure in rural areas and found out that general allocation fund, locally-generated revenue, revenue sharing fund, and special allocation fund positively influence capital expenditure. The findings were a product of using multiple regression analysis on a secondary data of 35 local government areas. Nwanne (2015) investigated the effect of government capital expenditure on the manufacturing sector output in Nigeria using quantitative time series data and multiple regression techniques in the analysis. Result reveals that capital expenditure affects the manufacturing sector output in Nigeria significantly in some specific areas like road and telecommunication but insignificantly in the power subsector. Babatunde (2018) investigated government spending on infrastructure using primary and secondary data comprising of reported annual spending on selected infrastructure and annual Gross Domestic Products for 1980 to 2016 for Nigeria. Unit root and co- integration tests were used to treat the data using Augmented Dickey–Fuller and Phillip–Perron model. The data analysis was carried out with descriptive statistics with findings that indicated that government spending on infrastructures of education and Table 1: State of Infrastructures in the Six Geopolitical zones of Nigeria Niger Delta (South-South) health, transport and communication, has significant influence on economic growth. Using time series data from 1970 to 2011, Nwosu and okafor (2014) examined on one hand the relationship between both total revenue expenditure of government and disaggregated government expenditure of recurrent and capital expenditures. The methods of analyses of the study were co- integration techniques and VAR models that included an Error Correction Mechanism (ECM). The existence of long run equilibrium relationships between government expenditure variables and revenues variables was indicated by the Co-integration while the VAR results reveal total government expenditure, capital and recurrent expenditures as having long run one directional relationships with total revenue. Okolo, Edeme, & Emmanuel (2018) examined the impact of capital expenditure development in Nigeria, utilising time series from 1970 to 2017 using autoregressive distributed lag (ARDL) model. Results showed that construction expenditure, capital expenditure, and non-oil revenue have the potential of enhancing infrastructural development in the long-run though such is being hindered by external debt. on infrastructural Parameters South West South East North West North Central North East Unemployment (19-24) 9.5 4.5 6.6 2.2 4.3 3.2 Access to School 70.0 87.5 58.9 70.3 70.6 70.1 Access to safe water source 45.5 73.1 40.3 50.2 48.5 80.3 Access to medicals 44.6 72.3 36.5 54.2 60.1 47.3 Source: Eneh (2011) cited in Okinono, Din, and Salleh (2015). Infrastructure and Human Development in Nigeria: A Study of the South- South Geo-Political Zone. The summary of the empirical reviews points to the basic fact of government spending having an influence on infrastructure provision and invariably national economy. The studies carried out in this area are tilted towards various purposes and objectives with varied methodologies involving either descriptive or other statistical tools. This research is not divulged from the norms but special in the area of combining descriptive statistics and analysis of variance (ANOVA) in analysing financial data of South-South Nigeria within the specifics of this study, an attempt that is so far rare. 4.METHODOLOGY This study utilises the quantitative type of research method. The research design adopted is descriptive as well as hypotheses testing. Secondary sources of data were used in this research and data were obtained from published state annual budgets. The population and sample size in this study is the 6 (six) states of the South-South region of Nigeria. the period of study was 11years (2007-2017) and the proposed methods of data analysis used is descriptive statistical analysis for basic trend analysis and analysis of variance (ANOVA) with SPSS for assessing the spatial distribution and the significant difference of capital investments across the states. 5.DATA, RESULTS AND TESTS OF HYPOTHESIS Table 2 is a summary of Nigeria’s state governments’ and Federal capital territory (FCT) average Finances (in N Billion) for the period of study. Nigeria’s 36 states and a federal capital territory reveal from the figure that recurrent expenditure (20524.60 equals 56.73% of total revenue) is more than capital expenditure (15653.73 equals 43.27% of total revenue). The notable aspect of this research is in keenly obtaining the expenditure situation of the South-South states as a separate document from the lumped document involving all the states. Deducting the South-South states values from that of all the states leaves a set of values for the other 30 states (including FCT) alone. The South-South states expenditure situation and that of the other states (including FCT) are presented side by side in Table 3. The table shows that capital expenditure is higher in the South-South states having 60.14% of total revenue than recurrent expenditure of 39.86% of total revenue. The expenditure situation of the other states is on the opposite, having capital expenditure lesser with a value 41.76% of total revenue than recurrent expenditure of 58.24% of total revenue. @ IJTSRD | Unique Paper ID – IJTSRD31720 | Volume – 4 | Issue – 4 | May-June 2020 Page 1793
International Journal of Trend in Scientific Research and Development (IJTSRD) @ www.ijtsrd.com eISSN: 2456-6470 Table 2: Summary of Nigeria’s State Governments’ and Federal Capital Territory (FCT) Average Finances (in N Billion Year Capital Expenditure Recurrent Expenditure Total Revenue Expenditure 2007 854.79 2008 1455.7 2009 1284.16 2010 1522.4 2011 1375.2 2012 1965.3 2013 1890.41 2014 1862.52 2015 1201.82 2016 1201.5 2017 1039.93 Total 15653.73 Percentage of Total Govt. Revenue 43.27% Source: 2018 CBN Statistical Bulletin: Public Finance Statistics (Table B.2.1) 1217.43 1505.63 1426.06 1648.4 2055.7 1664.4 1948.43 2120.48 2267.34 2007.74 2662.99 20524.60 56.73% 2072.22 2961.33 2710.22 3170.8 3430.9 3629.7 3838.84 3983 3469.16 3209.24 3702.92 36178.33 Table 3: Summary of South-South and the Other State Government’s Finances of Nigeria (in N Billion) South-South States of Nigeria Capital Expenditure Expenditure Expenditure 2007 86.95 62.13 149.08 2008 144.57 88.97 231.02 2009 152.06 96.72 248.78 2010 139.52 100.35 239.87 2011 157.03 116.82 273.85 2012 207.58 115.95 323.53 2013 221.09 103.41 324.50 2014 208.17 122.02 330.19 2015 151.29 130.25 281.54 2016 147.09 122.29 269.38 2017 175.20 130.31 305.51 Total 1790.55 1186.70 2977.25 Percentage of Total Govt. Revenue Source: South-South States –Collated/Computed from States’ Budget Publications (2007-2017); Other States – Deduced from table 1 above (i.e. Values of entire States of Nigeria plus FCT in Table 1 minus Values of South-South States in Table 2) Test of Hypothesis 1: In satisfyingobjective 1 which is to ascertain the public capital budgetary allocation strength in South- South region of Nigeria in relation to that of the rest regions of Nigeria, hypothesis 1 is stated that Capital expenditure as percentage of total Government revenue is lesser in South-South States (60.14%) than that of the rest regions of Nigeria (41.76%). Table 3 indicates a rejection of the hypothesis as capital expenditure in South-South states is actually higher than that of the rest states of Nigeria in relation to total government revenue. Test of Hypothesis 2: Objective 2 is poisedto examine the weight of capital expenditure viz-a-viz recurrent expenditures of South-South state governments of Nigeria. Hypothesis 2 which tests the objective states that capital expenditure as percentage of total Government revenue is lesser than recurrent expenditures in the budgets of South-South state governments. The descriptive analysis in table 3 reveals that capital expenditure (60.14%) is actually higher than recurrent expenditure (39.86%), thus the hypothesis is rejected. Test of Hypothesis 3: Objective 3 is intended to examine the capital expenditure trend in the budgets of South-South state governments of Nigeria. Table 4 displays the Average expenditure of South-South states for 11 years (2007-2017). The recurrent and capital expenditures add up to the total revenue expenditure. The table clearly indicates that expenditures are more capital (60.14% of total revenue) than recurrent (39.86% of total revenue). The regions emphasis on infrastructural development, at least at the budget level, is worth commending. Further scrutiny of the table reveals the weight of capital expenditures on public infrastructures across the states. Edo, Bayelsa, Cross River, Delta, Akwa Ibom, and Rivers, in ascending order, indicates their emphasis on infrastructure development. However, assessing the states from their capital expenditure as a percentage of total revenue expenditure, the order of capital expenditure priority from the least is: Bayelsa, Delta, Edo, Akwa Ibom, Cross River, and Rivers. Other States of Nigeria (including FCT) Capital Expenditure Expenditure 767.84 1155.30 1311.13 1416.66 1132.10 1329.34 1382.88 1548.05 1218.17 1938.88 1757.72 1548.45 1669.32 1845.02 1654.35 1998.46 1050.53 2137.09 1054.41 1885.45 864.73 2532.68 13863.18 19337.90 Year Recurrent Total Revenue Recurrent Total Revenue Expenditure 1923.14 2727.79 2461.44 2930.93 3157.05 3306.17 3514.34 3652.81 3187.62 2939.86 3397.41 33201.08 60.14% 39.86% 41.76% 58.24% @ IJTSRD | Unique Paper ID – IJTSRD31720 | Volume – 4 | Issue – 4 | May-June 2020 Page 1794
International Journal of Trend in Scientific Research and Development (IJTSRD) @ www.ijtsrd.com eISSN: 2456-6470 Table 4: Average expenditure of South-South states for 11 years (2007-2017), in Billions Total Revenue Expenditure Expenditure Akwa Ibom 379.13 136.21 Bayelsa 216.32 134.30 Cross River 155.46 52.72 Delta 317.39 142.06 Edo 137.69 61.02 Rivers 399.54 113.62 Total 1,605.53 639.93 Source: Collated/computed by author (2019) from States and National published data Recurrent Capital Expenditure 242.92 82.02 102.74 175.33 76.67 285.92 965.60 States % of total % of total 35.93 62.08 33.91 44.76 44.32 28.44 39.86% 64.07 37.92 66.09 55.24 55.68 71.56 60.14% Figure 1 is a bar chart representation of the trend of south-south states average capital expenditure (in billions of Naira) over an eleven year period (2007-2017). The positions the various states occupy from the figure are easily noticeable. Figure 1: Average Capital expenditure trend in South-South states across 11 years 250 Capex (in billions) 200 150 100 50 0 Figure 2: Average Capital expenditure trend across South-South states 2007 2008 2009 2010 2011 2012 Years 2013 2014 2015 2016 2017 Figure 2 shows the trend of capital expenditure across south-south states, with capital expenditure (capex) on the vertical (Y) axis and the years on the horizontal(X) axis. Hypothesis 1 states that there is no significant difference in the budget allocation of capital expenditure among the South-South states of Nigeria. It is necessary to test this hypothesis since visual observation of the data shows series of variances. How significant these variances are is the central issue here. Table 5 below shows the ANOVA test result table indicating an F value of 23.032 and p value of 0.000 which is less than 0.05. This suggests that the result is significant at 5% level and the null hypothesis can thus be rejected at 95% confidence interval. This means that there is a statistically significant difference in the spatial distribution of capital expenditure across the six states of south-south geopolitical region of Nigeria. 6.FINDINGS AND DISCUSSION The summary of result of all the tests of hypothesis in this study is presented in table 6. The ANOVA test result of hypotheses 3 shows that there is significant difference in the budget allocation of capital expenditure among the South-South states of Nigeria. Findings of this study show that there is a statistically significant difference in the distribution of capital expenditure across the six states of south-south geopolitical region of Nigeria. This difference might likely be due to different weight of emphasis placed on infrastructural development by the various states. Revenue capacity (Federal allocation plus internally generated revenue, IGR) variations are another likely reason for the difference in capital expenditure distribution across the states. Further, political and management influences can result in shifting emphasis on other expenditures including debt servicing at the expense of capital expenditure varying from state to state. @ IJTSRD | Unique Paper ID – IJTSRD31720 | Volume – 4 | Issue – 4 | May-June 2020 Page 1795
International Journal of Trend in Scientific Research and Development (IJTSRD) @ www.ijtsrd.com eISSN: 2456-6470 Table 5: ANOVA Test Result for Differences in Capital Expenditure Distribution in South-South States ANOVA CAPEX Sum of Squares Between Groups 490607.382 Within Groups 255610.850 Total 746218.231 Table 6: Summary of Test of Hypothesis Results Statistical Tool H1: Capital expenditure as percentage of total Government revenue is lesser in South-South States than that of the rest regions of Nigeria. H2: Capital expenditures are lesser than recurrent expenditures in the budgets of South-South state governments of Nigeria. H3: There is no significant difference in the budget allocation of capital expenditure among the South-South states of Nigeria. Df 5 60 65 Mean Square 98121.476 4260.181 F Sig. 23.032 .000 Location of Result Decision on Hypothesis Hypothesis Remarks Descriptive Table 3 Reject Descriptive Table 3 Reject Significant P = 0.000 F = 23.032 ANOVA Table 5 Reject However the regions emphasis on infrastructural development, at least at the budget level, is worth commending as results show that capital expenditures occupy more of the regions expenses (60.14% of total expenditure) than recurrent expenditure (39.86% of total expenditure). Earlier, Eneh (2011) cited in Okinono, Din, and Salleh (2015) pointed to the infrastructural deficiency of the south-south region in comparison to the other regions of Nigeria as was showcased in table 1. The results of this study with higher values of expenditure given to capital expenditure seem to negate the position of Eneh (2011). However, capital expenditure could be high yet its impact not be felt because of either misappropriation of funds or high cost of providing infrastructure typical of difficult terrains of the south-south. A disaggregated analysis study carried out by Nwosu and Okafor (2014) on government revenue and expenditure in Nigeria from 1970 to 2011, earlier mentioned in literature, suggests that to a large extent capital expenditure is low when compared to recurrent expenditure. However, the findings of this study which is limited to south-south Nigeria suggest the opposite. The reason might not be farfetched since the south-south region occupies a very rich position in terms of federal government allocation plus 13% oil derivative amount and IGR effort of the states. Rivers state is highest in capital expenditure followed by Cross rivers, Akwa Ibom, Edo, Delta, and Bayelsa. This order likely suggests their emphasis on infrastructural development. Government spending of 36 states of Nigeria including Federal capital territory (FCT) combined, suggest higher recurrent expenditure than capital expenditure. The situation remains same when South-South states are pulled out. On the South-South states end however, the situation changes as capital expenditure is higher than recurrent expenditure. The enviable economic viability of the states, being oil producing states, may have given rise to this higher capital spending of governments. However, the fact that literature still points to insufficient and degenerating infrastructural position of the South-South states suggests any or all of the following: insufficient capital allocation, allocated capital not implemented as planned, and corruption. 7.CONCLUSION AND RECOMMENDATIONS The study concludes that capital expenditure of South-South states as a percentage of total government revenue is higher than that of the rest states of Nigeria as an entity. Average aggregate capital expenditure of the South-South states is also proved to be higher than their recurrent expenditure. Further, capital expenditure across the six states of south- south geopolitical region of Nigeria is significantly different in their spatial distribution. Thus there is difficulty in rightly forecasting capital spending of one state from another. Capital expenditure occupies more of the regions expenses than recurrent expenditure, thus depicting the regions emphasis on infrastructural development, at least on the budgeting side. Rivers state is highest in capital expenditure (as a percentage of total revenue expenditure) followed by Cross rivers, Akwa Ibom, Edo, Delta, and Bayelsa. This order suggests their emphasis on infrastructural development. The study recommends that South-South state governments should by all possible means beef up their capital allocation to infrastructure development to measure up with the demands of the growing society. In the effort of achieving this, effective implementation of budgetary allocation plans must be put in place and all forms of corruption barred. REFERENCES [1]Agbakoba O, & Ogbonna H (2004). Local Government Administration and Development in Nigeria,A capacity Building Manuals, Lagos: Hurilaws Publications. [2]Aigheyisi, O. S. (2013). The Relative Impacts of Federal Capital and Recurrent Expenditures on Nigeria’s Economy (1980-2011). American Journal of Economics, 3(5), 210-211 [3]Adeniji, A. A. (2014). A Performance Management. Lagos: Value Analysis Publishers. [4]Akanbi, O. A. (2013)Does Governance Matter In Infrastructure: Evidence from Sub-Saharan Africa, International Business & Economics Research Journal, 12(1), 6-8 [5]Babatunde, S. A. (2018). Government spending on infrastructure and economic growth in Nigeria. Economic Research-Ekonomska Istraživanja, 31 (1), 997–1000. @ IJTSRD | Unique Paper ID – IJTSRD31720 | Volume – 4 | Issue – 4 | May-June 2020 Page 1796
International Journal of Trend in Scientific Research and Development (IJTSRD) @ www.ijtsrd.com eISSN: 2456-6470 [6]Banga, T. R & Sharma, S. C (2011). Industrial Organization and Engineering Economics,New Delhi: Khanna Publishers. [7]CIBN (2019). Infrastructure Development and Growth in Nigeria: Prospects and Challenges. The Chartered Institute of Bankers of Nigeria (CIBN) Annual Lecture. June 20, 2019. files/publications/ 1561107087 speeches. pdf. [8]Edame, G. E. & Ejue, M. O. (2013). Budgeting role, infrastructural development and economic growth in Nigeria. European journal of business and social sciences, 2 (6), 1-15. [9]Edame, G. E. & Fonta, W.M. (2014). The Impact of Government Expenditure on Infrastructure in Nigeria: A Co-integration & Error Correction Specification. International Journal of African and Asian Studies - An Open Access International Journal, 3, 4-7. [10]Fatai, O. O., Omolora, Y. J., & Taiwo, A. B. (2016). Infrastructure Finance and Development in Nigeria. Arabian Journal of Business and Management Review (Nigerian Chapter), 3 (12), 43-45. [11]Feese, B. T. (2016). The quantity surveyor’s role in the budgeting process in Nigeria-best practice director, budget monitoring and evaluation, federal ministry of budget and national planning, 4. [12]Foster, V. & Pushak, N. (2011). Nigeria’s Infrastructure: A Continental Perspective. Africa Infrastructure Country Diagnostic (AICD) Country Report, A Publication of The International Bank Development / https://ppiaf.org/documents/3154/download. 1-4. [13]Francis, P., Lapin, D., & Rossiasco, P. (2011). Securing Development and Peace in the Niger Delta: A Social and Conflict Analysis for Change, Washinton DC: Woodrow Wilson International Centre for Scholars, 9. [14]Gibran, J. M & Sekwat, A (2009). Continuing the Search for a Theory of Public Budgeting Journal of Public Budgeting, Accounting Management 21.4 (Winter 2009), 631. [15]Guess, G. M. & LeLoup, L. T (2010). Comparative Public Budgeting. Albany, US: SUNY Press. [16]Idahosa, S. A. & Nchuchuwe, F.F (2005); Local Government Finances in Nigeria: Issues in Generation, Utilization, Accountability and Service Delivery. Nigerian Journal of Policy and Development, 4, 100 -132. [17]Kuntari, Y., Chariri, A. and Prabowo, T. J. W. (2019). Capital Expenditure of Local Governments. Academy of Accounting and Financial Studies Journal, 23 (1), 1-2. [18]Lawyer, C. O. (2013). Budget Preparation and Implementation in the Nigerian Public Sector. Research Journal of Finance and Accounting, 4 (16), 50 [19]Lewis, C. W. (2007) How to Read a Local Budget and Assess Government Performance.Public Sector Governance and Accountability budgeting),Anwar Shah ed. The International Bank for Reconstruction and Development / The World Bank, 196,197. [20]Mohammed, S. F. (2011). Exploiting Public-Private Partnership as a Tool for Infrastructure Development in Nigeria. Bullion, Publication of the Central Bank of Nigeria, 35 (2), 4 [21]Musgrave, R.A. (1989). Fiscal Systems, London: Yale University Press Musgrave, R.A. and Musgrave, B. (1964), Public Finance in Theory and Practice, New York: McGraw-Hill Book Company [22]Nwanne, T. F. I. (2015). Implications of Government Capital Expenditure on the Manufacturing Sector in Nigeria. European Journal of Accounting, Auditing and Finance Research, 3 (10), 19-23. [23]Nwogwugwu, N; Alao, O. E. & Egwuonwu, C. (2012). Militancy and Insecurity in the Niger Delta: impact on the inflow of foreign direct investment to Nigeria. Kuwait Chapter of Arabian Journal of Business and Management Review, 2 (1), 23. [24]Nwosu, D. C. & Okafor, H. O. (2014). Government Revenue and Expenditure in Nigeria: A Disaggregated Analysis. Asian Economic and Financial Review, 4(7), 877-892 [25]Ogboru, I. (2016). Budget Transparency and Economic Development in Nigeria: An Imperative for North Central States. A Keynote Address Presented at The North Central Zonal Launch Showcasing the Outcome of Budget Transparency Survey to Government Directors of Budget in the Six States of the Zone, held at Tal Hotel Lafia, Nasarawa State, February, 1st, 2016. [26]Ogujiuba, K. K., & Ehigiamusoe, K. U. (2014) Capital budget implementation in Nigeria: Evidence from the 2012 capital budget. DOI: 10.5709/ce.1897-9254.147 [27]Ojo, E. O. (2012). Constraints on Budgeting and Development Plan Implementation in Nigeria: an Overview.European Journal of Sustainable Development 1 (3), 445. [28]Okinono, O., Salleh, D. & Din, B. (2015). Infrastructure and Human Development in Nigeria: A Study of the South- South Geo-Political Zone. IOSR Journal of Humanities and Social Science (IOSR-JHSS), 20 (9), 65- 73. [29]Okolo, C. V., Edeme, R. K. & Emmanuel, C. (2018). Economic Analysis of Capital Expenditure and Infrastructural Development in Nigeria. Journal of Infrastructure Development 10(1–2), 52–62. [30]Parliament of the Republic of South Africa (2011). Budget analysis Manual. Information Services Section, Research Unit/ public and accounts section cluster, 14- 15. [31]Sani, A., Sani, M., Kunya , S. U., & Shehu, U. M. (2018). Trends analysis of construction projects in Gombe state, Nigeria. International Journal of Research in Engineering and Innovation. 2(2), 151-155. [32]The Institute of Internal Supplemental guidance: public sector definition. Florida: IIA publication, 3. [33]UNDP. (2006). Niger Delta Human Development Report. Abuja: United Programme, 25 [34]Wilkins, K. and Zurawski, A. (2014). Infrastructure Investment in China. Bulletin, June Quarter, 2014. http://citeseerx. ist.psu.edu/ viewdoc/ download? doi=10.1.1.431.2911& rep=rep1 &type=pdf. https://www.cibng.org/ ResearchGate. 1-2. for The Reconstruction World and Bank, & Financial budgetary provision for Auditors (2011). series (local Nations Development @ IJTSRD | Unique Paper ID – IJTSRD31720 | Volume – 4 | Issue – 4 | May-June 2020 Page 1797