Download
1 / 40
400 likes | 606 Views
Executing Strategy with the Balanced Scorecard January 30, 2006 Presented by Paul R. Niven. Agenda. Introductions Performance Measurement Background – What led us to the BSC? The Balanced Scorecard Success Stories Strategy Maps Essentials of Implementing the Balanced Scorecard

E N D
Executing Strategy with the Balanced Scorecard January 30, 2006 Presented by Paul R. Niven
Agenda • Introductions • Performance Measurement Background – What led us to the BSC? • The Balanced Scorecard • Success Stories • Strategy Maps • Essentials of Implementing the Balanced Scorecard • Questions & Answers
Paul Niven and the Balanced Scorecard • BSC Practitioner first, then consultant, and writer • Led a BSC project with large Canadian firm in mid-90s • Have consulted with Bearing Point (Chicago) and CSC (San Diego) • Formed The Senalosa Group in 2001 • Have written 3 books and many articles on the subject of Balanced Scorecard • Speak at conferences and seminars around the world • Have worked with clients in many different sectors Translated into 12 languages Released June, 2003 Released April, 2005
The Changing Landscape of Performance Management • 80% of respondents reported making changes in their PM system during the last 3 years. For 33% the change was described as a “major overhaul” More than 50% of respondents indicated their company is currently changing its PM system. (From Strategic Finance Magazine) • More than 50% of the Fortune 1000 have turned to the Balanced Scorecard. (Bain & Company study) • Hackett reported in their 2002 Benchmarking study that 96% of the 2000 global companies surveyed either were using a BSC or planned to implement it The question is why???
Three Challenges Rise of Intangible Assets Over-reliance on Financial Measures Prominence of the Balanced Scorecard Difficulty Executing Strategy
1982 1992 Today 75% 62% 38% Our Economy is Changing “They (knowledge workers) now account for a full third of the American workforce, outnumbering factory workers two to one. In another twenty years they are likely to make up two-fifths of the workforces of all rich countries.” -Peter F. Drucker, The Economist, November 2001 The increasing value of intangible assets in organizations
Financial Measures Don’t Tell the Whole Story • Not consistent with today’s business realities • Driving by rearview mirror • Tend to reinforce functional silos • May sacrifice long-term thinking • Not relevant to many levels of the organization The Alto
Vision Barrier People Barrier Management Barrier Resource Barrier Only 5% of the workforce understands the strategy Only 25% of managers have incentives linked to strategy 85% of executive teams spend less than one hour per month discussing strategy 60% of organizations don’t link budgets to strategy The Strategy Story Only 10% of organizations execute their strategy Barriers to Strategy Execution Chart adapted from material developed by Robert S. Kaplan and David P. Norton
Clearly, A Change is Needed Intangible Assets Strategy Financial Measures
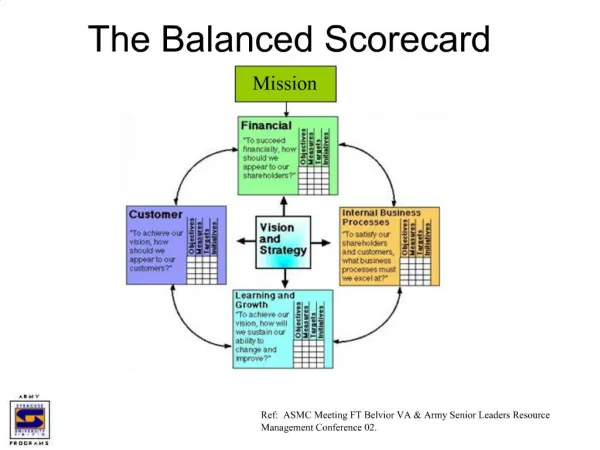
Balanced Scorecard Fundamentals Source: Harvard Business Review, 1992
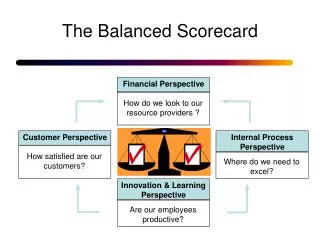
Financial Perspective • Represent the “destination” or “end in mind” of your strategic story • Focus on shareholder value, revenue growth, and productivity • Example Measures: • Return on invested capital • Gross revenue • Revenue by segment • Asset utilization
Customer Perspective • Should answer three questions: • Who are our customers? • What is our value proposition in serving them? • Operational Excellence • Product Leadership • Customer Intimacy • What do customers expect or demand? • Example Measures: • Customer Loyalty • Market Share • Customer Retention
Customer Value Propositions • To attract and retain customers, different “value propositions” are required based on your strategic choice…………. System Lock In Innovation/Product Leadership Customer Solutions (Customer Intimacy) Lowest Total Cost (Operational Excellence) • “Lock in companies provide the best platform for buyers and sellers to meet” • E-Bay • Microsoft • Yellow Pages • “A Product leadership company pushes its products into the realm of the unknown, the untried, or the highly desirable…Superior performance for customers.” • Sony • Intel • “Operationally excellent companies deliver a combination of quality, price, and ease of purchase that no one else can match” • Costco • McDonalds • Dell Computer • “A Customer Intimate company builds bonds with customers; it knows the people it sells to and the products and services they need” • Nordstrom • Mobil (Early BSC adopter) Best Exchange Most Innovative Product Best Total Cost Best Solution The first three value propositions are based on Treacy & Wiersema, The Discipline of Market Leaders, Addison Wesley, 1995
Internal Process Perspective • Key processes we must excel at to drive value for customers • Also focus on customer value proposition • Normally contains the largest number of measures • Example Measures: • On-time delivery • Product development cycle time • Customer response time
Employee Learning & Growth Perspective • Often overlooked • Represent the “enablers” of the other three perspectives • “Soft” measures can drive “hard” results • Example Measures: • Employee satisfaction • Strategic job coverage ratio • Internal communication rating
Employee Learning & Growth Perspective Human Capital – Understand what competencies we need, what we have, and how to close the gap Information Capital – Understand the IT applications and infrastructure we need to support the strategy Organizational Capital- Culture – Build an organization that internalizes the shared vision, strategy, and values required to execute Leadership – Develop leaders who can effectively leverage human capital Goal Alignment – Encourage personal contribution through goal and incentive alignment Knowledge Sharing/Teamwork – Share knowledge and experience through teamwork
Everybody! Can you guess the country represented by this flag???
Maps Get Us From “A” to “B” Sydney Antigonish Truro Halifax
Strategy is Also a New Destination Successfully Executed Strategy Landmark 2 Landmark 1 Formation of a Strategy
AGood Balanced Scorecard Tells the Story of Your Strategy on a Strategy Map Illustrative Example: Southwest Airlines Strategy Map • What will drive operating efficiency? • More customers on fewer planes • How will we do that? • Attract targeted customer segments who value price and on time arrivals • What must the internal focus be? • Fast turnaround • Will our people do that? • Educate and compensate ground crew regarding how they contribute to the firm’s success Financial Increase Profitability Fly Fewer planes Attract More customers Customer Ensure Lowest prices Offer on time flight Internal Maintain Fast ground turnaround Learning Align ground crew operations
Maximize Sustainable Value for Our Shareowners Grow Revenue & Earnings Build customer loyalty Leverage best practices to achieve best in class performance Exercise best in class governance/controls Profitable Growth Operational Productivity Financial Perspective Achieve optimalROIC levels Customer Perspective Offer superiorvalue in distribution and supply chain services Exercise and outwardly communicate business practices that drive channel integrity Exceed customer expectations in service delivery Internal Process Perspective Provide simple, consistent and reliable processes Introduce/enhance Products and services Learning & Growth Perspective Hire, develop, and retain the best performers Leverage technology to improve productivity and drive customer results Foster a culture that rewards teamwork and promotes balance
Increase customer satisfaction Understand and anticipate customers’ business needs Participate knowledgably and contribute to meeting needs Proactively provide effective and innovative solutions Efficient delivery through consensus Keep system up and running Proof of concept Continuously improve and simplify customer experience Explore alternatives and anticipate use of new technology Build it right, keep it healthy Get off the 3rd floor Continuously review and simplify internal practices and procedures Skills & Training: Hire, develop and retain solid performers Information & Communication: Share information, listen more, and respond Culture: Foster an environment that encourages, recognizes, and rewards contribution Create accountability and ownership Ensure teamwork that fosters mutual respect, support, and learning Be consistent Get more bang for our buck! Government I.S. Strategy Map Customer Internal Employee Learning and Growth Financial Customer Focus Know Our Business Keep Pace With Technology Work Smarter Always On
Grow Aliant Profitably Serve Customers on Their Terms With Passion and Integrity to Build Loyalty Deliver More Value Through Integrated Offerings Continuously Improve and Simplify End to End Customer Experiences Stimulate New Product and Service Development & Adoption Allocate All Aliant Resources Effectively Build an Environment Where People Feel Valued and Maximize Their Potential Create a Safe & Healthy Environment That Respects the Balance in People’s Lives Share Information, Listen More and Respond Aliant Inc. Strategy Map Financial Increase Shareholder Value Customer Everything Begins With The Customer Internal Process Innovate, Collaborate,and Allocate Employee Learning & Growth Create a Workforce that is Informed, Developed, Engaged and Inspired
The BSC has gained wide acceptance, but problems exist • More than 50% of the Fortune 1000 have turned to the Balanced Scorecard. (Bain & Company study) • Hackett reported in their 2002 Benchmarking study that 96% of the 2000 global companies surveyed either were using a BSC or planned to implement it • Harvard Business Review calls the BSC one of the 75 most influential business ideas of the 20th century • But as many as half of all BSC users aren’t achieving the results they hoped for It’s all about Implementation practices!!!
Overview of Implementation Essentials • A guiding rationale for the BSC • Executive Sponsorship • An effective team • A Balanced Scorecard “Champion” • Training, Education, and Communication • Strategy Maps • Measures • Cascading the Balanced Scorecard • Reporting Results • Linkage to Management Processes • Living It! Let’s examine a few of these in more detail…..
Executive Sponsorship “To make initiatives work it took passionate, all-consuming commitment from the top…Every leadership action must demonstrate total commitment to the initiative.” -Jack Welch, Jack: Straight From the Gut • No BSC initiative will survive without active executive sponsorship • Executives hold key knowledge for BSC success • Everyone watches what the boss watches • You can influence executive sponsorship
Balanced Scorecard Reporting • Can be high-tech or low-tech • Key point is to begin discussing results soon!
Balanced Scorecard Reporting • Hold strategy centered management meetings • Most meetings suffer from serious faults*: • Lack of drama • Lack of contextual structure • “The Discipline of Getting Things Done” * Based on “Death by Meeting” by Patrick Lencioni
Cascading the Balanced Scorecard • Allows everyone to demonstrate how they contribute to overall goals • Creates a consistent language through measurement • Achieves a laser- like focus on strategy
Cascading Example City Scorecard Perspective Objective Measure Target Customer Provide safe, convenient transportation Increase in average ridership of public transportation 10% Department of Transportation Scorecard Perspective Objective Measure Target Customer Provide safe, convenient transportation Percentage of fleet available 90% Maintenance Department Scorecard Perspective Objective Measure Target Customer Provide safe, convenient transportation Percentage of vehicle repairs completed within 24 hours 75%
Questions??? Thank you for your time. If you have any other questions, please feel free to contact me at: (760) 789-2449 or pniven@senalosa.com www.senalosa.com