Download
1 / 29
310 likes | 575 Views
Science Project Reaction Time. Division of Mathematics, Science, and Advanced Academics. Correlated to the Elementary Science, Mathematics, Engineering, and Inventions Fair Handbook. Overview. Elementary Science Project Fair Resources Hands-0n Inquiry Based Project: Reaction Time!

E N D
Science ProjectReaction Time Division of Mathematics, Science, and Advanced Academics Correlated to the Elementary Science, Mathematics, Engineering, and Inventions Fair Handbook
Overview Elementary Science Project Fair Resources • Hands-0n Inquiry Based Project: Reaction Time! • A Science Fair Project TE Planning Form • A Science Fair Project Student Planning Form • A Science Fair Project Power Point Guide • A Science Fair Project Power Point Template
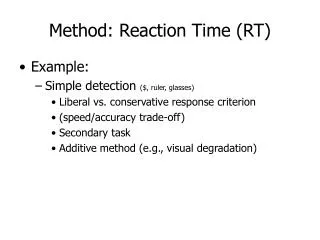
Guided InquiryReaction Time Scientific Method • Do research on a topic • Identify a testable question • Form hypothesis • Design an experiment: identify the variables, gather materials, & write procedures • Conduct the experiment • Collect and record data • Analyze data/results • Draw conclusions & make applications • Communicate the results
Step 1: Choose a Topic. • Get a notebook to record all information collected for your project. • Do research to learn as much as you can about the experiment topic. • Ask questions about your topic that you want to answer and make sure you can observe and measure data. • More research may be needed after you decide what to investigate in your experiment. • Try the library and the internet. • Cite your sources in the Bibliography.
Topic: Human Reaction Time to a Stimulus stimulus response Nervous System sensory neurons neurons motor neurons response time
What Does Reaction Time Involve? Our body uses our 5 senses to recognize a change outside or inside the body called a stimulus. Special cells in the nervous system called neurons carry messages to and from the brain and spinal cord. Sensory neurons detect a stimulus. Then additional neurons carry the message to the spinal cord and brain. The brain interprets the information and decides on an action. The message is carried back to the motor neurons. They direct the muscles to carry out a response. All of this happens in a fraction of a second. This is measured as reaction time. T
Step 2 Ask a Question • Identify a question that can be answered by performing an experiment. • An experiment is a set of steps you follow to test a hypothesis. • This question will be the Problem Statement.
Problem Statement Is the reaction time for your dominant hand faster, the same or slower than your nondominant hand?
Step 3: Make a Hypothesis • Look at the Problem Statement and identify the one factor that can be tested. This is the manipulated or independent variable. • Form an idea or educated prediction that can be tested by an experiment. • Write down your Hypothesis: “If….then (this) will happen.”
Hypothesis If the reaction time for both the dominant hand and nondominant hand are tested, then the reaction time will be faster for the dominant hand.
Step 4: Plan the Investigation Identify and record the factors that can affect the results of the experiment under Variables. 1. Independent/test (manipulated) variable or the factor that is changed in the experiment. (See previous Step 3.) 2. Dependent/outcome (responding) variable or the data to be collected during the experiment. 3. Constant/Control variables or all the factors to be kept the same in the experiment.
Variables Constant Variables: Same ruler Same drop and catch directions Same partner Same conversion chart Manipulated Variable: Dominant hand Nondominant hand Responding Variable: Centimeter mark on ruler when caught Reaction time in seconds
Step 4 Planning Continued • Write your procedures or the steps you will follow in your experiment. • Each procedure step needs to be numbered. • Each step needs to begin with a verb. • These procedures will insure that all variables are kept the same (constant) or controlled except the one you are testing. • Figure out and collect the materials needed for the experiment.
Materials 1 ruler with centimeter markings two students to work as partners Centimeters to Seconds Conversion Chart
Procedures Hold the ruler (partner 2) vertically with the 0 cm end facing down while the other (partner 1) holds his or her thumb and pointer finger from his or her dominant hand at the bottom of the ruler—ready to catch the ruler when it is dropped. Drop the ruler without warning (partner 2) and partner 1 tries to catch it as quickly as possible with his/her dominant hand. Observe the centimeter mark on the ruler where the ruler was caught (use the mark closest to the bottom of the thumb). Record the number. Use the conversion chart to change the centimeter measurements to a specific time in seconds. Record the time. Repeat steps 1.-4. five more times and find the average. Repeat steps 1. – 5. with your nondominant hand. Change partner roles and repeat steps 1. – 6.
Step 5: Collect, Organize, and Display Data • Start the experiment. • Observe and record the quantitative data (numbers or measurements) collected during the experiment on a data table. • Repeat the experiment three or more times to confirm results. • Take pictures during the experiment. • Graph your data from all trials. (Dry Mix) • Display under Data. • Restate your data in a narrative form under Results.
Data Reaction Time in Seconds
Results Data from the five trials shows that partner 1’s dominant hand an average reaction time of .21 seconds and the nondominant hand an average reaction time of .20 seconds. Data from the five trials shows that partner 2’s dominant hand an average reaction time of .21 seconds and the nondominant hand an average reaction time of .20 seconds.
Step 6: Drawing Conclusions* • What was investigated? (Describe the problem statement.) • Restate your hypothesis, and tell if it was supported (true) or not supported (false). • What were the major findings? (Explain your results.)
Conclusion This purpose of this project was to investigate if the reaction time for a person’s dominant hand is faster, the same or slower than the nondominant hand. It was hypothesized that the dominant hand would be faster. The hypothesis was not supported. The major findings showed that the dominant hand was slower by an average of .01 of a second than the nondominant hand. However, since .01 of a second difference is so close, the results could be considered inconclusive.
Step 7 Making Applications • What recommendations do you have for further study and for improving the experiment? • Explain what you learned from your experiment that could be applied in real life. • List any new questions that your experiment lead you to ask that could be tested in a new investigation.
Application The project may have been improved by compiling and reporting on a larger sample of the students’ reaction times. The data collected by each pair of students completing a project could be averaged together. If there are other classes doing the same project, their data could also be used in making a revised conclusion. The findings from this investigation lead me to think that although hand domination affects a person’s ability to do specialized activities such as writing my name, it doesn’t always affect reaction time to a stimulus in my day-to-day life. On average do boys and girls of the same age have the reaction time is a new question that could be investigated.
Step 8 Abstract and Bibliography • Describe your purpose and hypothesis. • Briefly describe your procedure. • Describe and explain your results. • Explain your conclusion and state if your hypothesis was supported or not by the results. Give possible reasons. • Write about your project’s applications. • List your bibliography of three or more sources.
Abstract This purpose of this project was to investigate if the reaction time for a person’s dominant hand is faster, the same or slower than the non -dominant hand. It was hypothesized that the dominant hand would be faster. A partner and I alternated dropping a ruler with the other catching a ruler and observing the centimeter mark where the ruler was caught. A conversion chart was used to change the centimeter mark to seconds. The results showed that the dominant hand was slower by an average of .01 of a second than the non-dominant hand. This did not support the hypothesis. However, since .01 of a second difference is so close, the results could also be considered inconclusive. The project may have been improved by compiling and reporting on a larger sample of the students’ reaction times. The findings from this investigation lead me to think that although hand domination affects a person’s ability to do specialized activities such as writing my name it doesn’t always affect reaction time to a stimulus in my day-to-day life.
Bibliography “Home Connections: Act Fast!” Science and Children. National Science Teachers’ Association, September 2003, pp. 53 – 54 www.SciLinks.org Keyword: Nervous System, code: SC090302 Oracle Think Quest: http://library.thinkquest.org/3007/nervous.html
Communicate Your Inquiry • You can use the science fair blank template to create a Power Point presentation. • You can duplicate your Power Point presentation and display on a Science Fair Project Board.
Guided InquiryReaction Time Scientific Method • Do research on a topic • Identify a testable question • Form hypothesis • Design an experiment: identify the variables, gather materials, & write procedures • Conduct the experiment • Collect and record data • Analyze data/results • Draw conclusions & make applications • Communicate the results