Download
1 / 45
450 likes | 525 Views
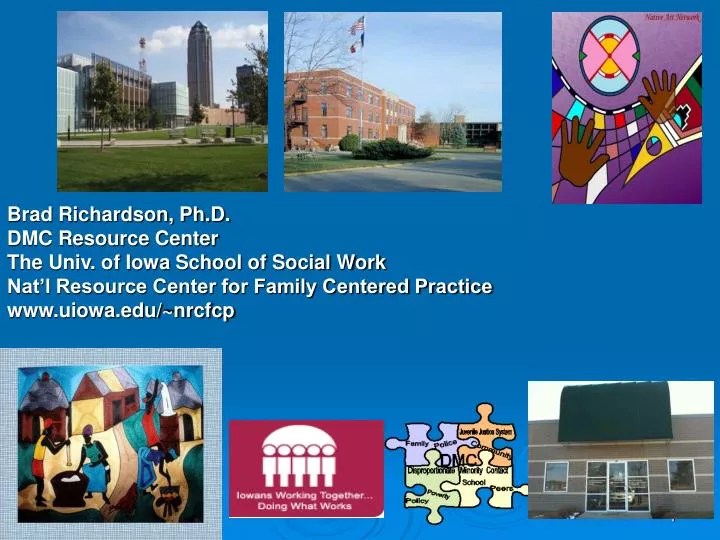
Brad Richardson, Ph.D. DMC Resource Center The Univ. of Iowa School of Social Work Nat’l Resource Center for Family Centered Practice www.uiowa.edu/~nrcfcp.

E N D
Brad Richardson, Ph.D. DMC Resource Center The Univ. of Iowa School of Social Work Nat’l Resource Center for Family Centered Practice www.uiowa.edu/~nrcfcp
Sioux City DMC August 6th, 2012University of Iowa School of Social WorkUniversity of Iowa Research ParkW206 Oakdale HallIowa City, IA 52242-5000 (P) 319-335-4965 (Fax) 319-335-4964www.nrcinhome.socialwork.uiowa.edu
DMC data focusing on decision points Adaptation of model for DMR, School Suspensions (Crossover) Recent literature on poverty and disproportionality Sustainability 1-3
Defining Terms:Disproportionate Minority Contact Disproportionate Minority Contact R = Representation 1-8
Relative Rate Index Formula Relative Rate Index (RRI)= minority rate / white rate 1-10
Calculate Rates In 2003, 15,902 out of a total of 194,600 white non-Hispanics were in poverty. What was the poverty rate per 1,000 for white non-Hispanics? 1-11
Calculate Rates (cont’d) What was the poverty rate per 1,000 for white non-Hispanics? 15,902/194,600 x 1,000 = 0.0817 x 1,000 = 82 per 1,000 1-12
Calculate Rates (cont’d) In the same year, 9,108 black/African-Americans out of a total of 37,500 blacks/African-Americans were in poverty. What was the poverty rate per 1,000 for blacks/African-Americans? 1-13
Calculate Rates (cont’d) What was the poverty rate per 1,000 for blacks/African-Americans? 9,108/37,500 x 1,000 = 0.2429 x 1,000 = 243 per 1,000 1-14
Calculate Relative Rate Index How did the black/African-American poverty rate (243 per 1,000) compare with (relative to) that (82 per 1,000) of white non-Hispanics (i.e., what was the poverty relative rate index in 2003 when comparing blacks/African-Americans with white non-Hispanics)? 1-15
Calculate Relative Rate Index (cont’d) RRI = 243/82 = 2.96 The poverty rate of blacks/African Americans was nearly 3 times as high as that of non-Hispanic whites in 2003— [not black/African Americans are 3 times as likely to be poor]. 1-16
Race Equity Scorecard:Disproportionality re: Out of Home CareWoodbury County, IA 2005-2010
Race Equity Scorecard:Disproportionality - Out of Home CareWoodbury County, IA 2005-2010
Why are these numbers going up again? . . . What do you think?
Differential Offending v. Institutional Racism Using Child Welfare Research (Crossover) 3-3
Recent “publications” have been interpreted as concluding: • African American maltreatment of children is 1.73 that of white • Poverty is the underlying causal factor References: • Bartholet, Wulczyn, Barth, Lederman, 2011 -Chapin Hall Issue Brief; • Drake, Jonson-Reid, 2011 – Children and Youth Services Review • Drake, Jolley, Lanier, Fluke, Barth, Jonsen-Reid, 2011 – Pediatrics • Bartholet, 2009, THE RACIAL DISPROPORTIONALITY MOVEMENT IN CHILD WELFARE: FALSE FACTS AND DANGEROUS DIRECTIONS
African American maltreatment of children is 1.73 that of white • Poverty is the underlying causal factor
Issues with Current Publications • Rates v. individual level data • Correlation is not causation • “Hispanic paradox” seems to refute conclusions but is interpreted as “support” • Poverty not “actionable” • Suggest that “system helps” but higher entry and exits among AfrAm leave doubt • Only look at one decision point (front end)
Institutional Racism v. Differential Offending(4.9:1 RRI at placement 2009)
Institutional Racism v. Differential Offending(7.9:1 RRI at placement 2006)
Poverty Behavior DHS Involvement Systemic
Zajac Study of Staff Perceptions of What Determines the Success of Client Families • Structural Factors • Individual Characteristics • Culture and Class
Structural Factors • Staff recognize that structural challenges contribute to client families’ lack of success. • Structural challenges are compounded by client families being geographically and socially isolated and by their lack of supports and access to resources.
Individual Characteristics • Staff felt motivation and willingness are key to explaining why some client families are more successful than others. • More successful client families are motivated to change and willing to seek and accept help. • Less successful client families are responsible for their problems because they are unwilling or unable to change.
Culture • Staff have a vague and general sense of culture • Because culture is unexamined, undefined, staff seem, at times, to use it as a code for sensitive topics such as race and class • Even in the absence of apparent racial differences, staff conflate race and culture • Difficulty articulating what “else” culture is, if not race • “Average White culture”
Culture and Class • Staff sometimes appear to equate class with culture in much the same way they equate race with culture • Not clear how staff use class to explain their clients’ relative levels of success • Acknowledge it as a structural factor (i.e., poverty) that makes it difficult for client families to succeed • BUT also characterize the least successful clients (who happen to be in the lower classes) as unmotivated and/or unable to change
Combination of these values creates a context in which staff believe:
Power Struggles http://www.youtube.com/watch?v=yJEDHP9_aD0
THANK YOU! • Contact information brad-richardson@uiowa.edu 319-335-4924 515-771-3589