Download
1 / 24
240 likes | 245 Views
Explore the challenges and solutions of visualising large volumes of data transfers and analytics using Big Data techniques. Learn about the applications of Big Data in different domains and the advancements in data storage, network connectivity, and log analysis. Discover how the ELK stack can be used for log analysis and find anomalies in global data flows.

E N D
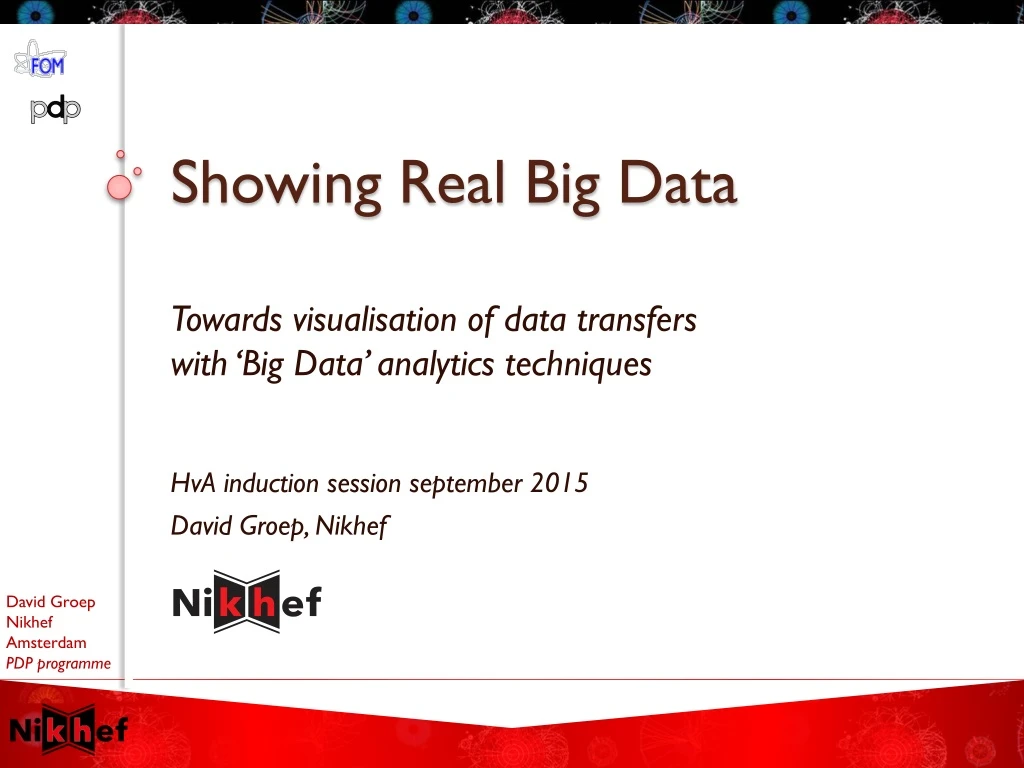
Showing Real Big Data HvA induction session september 2015 David Groep, Nikhef Towards visualisation of data transfers with ‘Big Data’ analytics techniques
Balloon (30 Km) CD stack with 1 year LHC data! (~ 20 Km) Concorde (15 Km) Mt. Blanc (4.8 Km) • Signal/Background 10-9 • Data volume • (high rate) X(large number of channels) X(4 experiments) 30+ PetaBytes of new data each year • Compute power • (event complexity) X(number of events) X(thousands of users) 60’000 of (today's) fastest CPUs
Today – LHC Collaboration 20+ years est. life span 24/7 global operations~ 4000 person-years ofscience software investment ~ 5 000 physicists ~ 150 institutes 55+ countries, economic regions
Atlas: ~50 TByte/day raw data to tape; 1000 TByte/day processed data transfers Image source: CERN, Atlas
Big ‘as in Large’ Data Atlas only http://dashb-atlas-ddm.cern.ch/ddm2
Shared e-Infrastructure • >270 communitiesfrom many different domains • Astronomy & Astrophysics • Civil Protection • Computational Chemistry • Comp. Fluid Dynamics • Computer Science/Tools • Condensed Matter Physics • Earth Sciences • Fusion • High Energy Physics • Life Sciences • … Applications have moved from testing to routine and daily usage ~80-95% efficiency
Global data flows ~150GByte, 12hrsper (human) genome per sequencer But 1000+ sequencers… 50TByte from Shenzhen to NL is (still) done by rucksack Genome sequencing at the Beijing Genomics Institute BGI Photo: Scotted400, CC-BY-3.0
Distributed analysis – ‘Atlas neighbours’ http://dashb-atlas-ddm.cern.ch/ddm2
Optical Fibre(bits per second) Doubling Time(months) Gilder’s Law(32X in 4 yrs) Data Storage(bits per sq. inch) Storage Law (16X in 4yrs) Performance per Dollar Spent Chip capacity(# transistors) Moore’s Law(5X in 4yrs) 9 12 18 0 1 2 3 4 5 Number of Years There’s always a network close to you • SURFnet pioneered ‘lambda’ and hybrid networks in the world • and likely contributed to the creation of a market for ‘dark fibre’ in the Netherlands • There’s always fibre within 2 miles from you – where ever you are!(it’s just that last mile to your home that’s missing – and the business model of your telecom provider…)
Interconnecting the Grid – the LHCOPN/LHCOne network LHC Optical Private Network 10 – 40 Gbpsdedicated global networks Scaled to T0-T1 data transfers(nominally 300 Mbyte/s/T1 systained)
The Flow of Data at Nikhef 10 – 40 Gbps per server 240 Gbps interconnect 44 disk servers ~3 PiB (~3000 TByte) 2 control & DB nodes Peerings: SURFnet, SURFsara, Kurchatov, AMOLF, CWI, LHCOPN, LHCOne via SARA >200 Gbps uplinks
But that’s only a small subset LCG “FTS” visualisation sees but part of the data • only shows the centrally managed data transfers • sees only traffic from Atlas, CMS, and LHCb • cannot show the quality, nor bandwidth used But each of our nodes sees all its transfers • server logging is in itself data • we collect it all
One day worth of logs … ~12GB/day tbn18.nikhef.nl:/var/log/ 631M dpm/log.1 1.1G dpns/log.1 639M srmv2.2/log.1 plus 44 disk server nodes @250 Mbyte/day And then our storage manager is still ‘decent’ …
Big Data Analytics for log analysis • Analysis of log data is typical ‘big data’ problem • CERN tried Hadoop (‘map-reduce’) • RAL went with … ELK* • For logs specifically, it’s mostly efficient search • ElasticSearch (www.elastic.co) • LogStash (collect and parse logs, import to ES) • Kibana – analysis based on Apache Lucene + graphing • Integrated into a single ‘stack’: ELK *Appleyard et al., http://pos.sissa.it/archive/conferences/239/027/ISGC2015_027.pdf
LogStash Data arrives in format A… …process B occurs… …data out in format C e.g. convert syslog into json
Analyse, for now with Kibana/Lucene Graphic from Rob Appleyard, RTFC RAL – at ISGC 2015
Challenges ahead! For now, we have • 44+ difference data sources, 240 Gbps of traffic • 150+ different storage partners, 55 countries/regions • public internet plus the LHCOPN/LHCOne • 5000+ users, working 24x7 … and ‘grep’ for a tool … Phase I: • setup of a big data analytics cluster (ELK) • merge diverse data sources into a single system • define queries and find some global anomalies
Building upon phase I As an (optional) addition/extension to phase I • Discuss if ELK indeed the right tool for this: can it cope with the volume? It the ElasticSearch API suitable for defining new visualisations? • Add additional data sources: are simple transfer logs enough? Does data flow correlate with computing, and can we see that by adding sources and defining (lucene) queries? And in phase II (>Feb 2016) • How can global data flowsbe presented? • Can one conceive visualisations for the general public? for users? or for both?