Download
1 / 47
470 likes | 491 Views
Delve into the significance of psychological research methodology and why critical thinking is vital. Explore the different research strategies and tools used, from surveys to experimental methods. Understand the nuances of correlational research and the essential components of the scientific method.

E N D
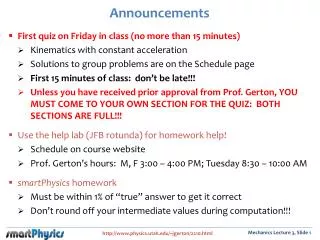
AP Psych Class Announcements: Extra Credit due next Monday if interested…..go to pbworks site Make up quizzes: Tiffany A Thanks to Larry Morris and Leslie Gomez for helping me 4A I need a student to help with flyers. Anyone???? Turn in your summer assignment next class. Cards on 9/20,21 test Aim: to explain the parts of an experiment and the measures of central tendency Do Now: Identify the IV/DV HW: take home free response essay 1A- Homeroom forms to return: *Please mark off each form you have turned in on chart
Psychological Research Methods Excavating Human Behaviors C
Why do we need Psychological research to be scientific? Why should we strive to think critically? Add up these numbers IN YOUR HEAD:
The limits of relying on human intuition and common sense • The Hindsight Bias or “I knew it all along” phenomenon • 2. Overconfidence
Hindsight Bias • The tendency to believe, after learning the outcome, that you knew it all along. Did you believe the Colts were likely to break their winning streak and lose 2009 Super Bowl the next morning?
Overconfidence • How often do you get a test score back and are surprised that you didn’t do as well as you had thought?
What kind of problems could arise from the fact that in psychological research, humans are often studying other humans?
Parts of the Scientific Method: • Theory- your belief Example: “Lack of adequate sleep can worsen one’s ADHD symptoms”
Hypothesis • - your testable prediction • ……..So what would it be for this example?
Operational Definition • A statement of HOW the researcher is going to measure the variable. • No…don’t associate the word “operational” with “surgery” • Babad surgery
Come up with an appropriate operational definition for the highlighted words in each of the following: • The experimenter wants to figure out if those of Asian descent express emotion less than other races. • Researchers want to test whether “talk therapy” will reduce symptoms of depression.
Write operational definitions for the following: • 1. The experimenter wants to figure out how different jokes affect a person’s sense of humor. • 2. College athletes are not as smart as regular students. • 3. People who make over $300,000 a year tend to be snobs.
Three types of Research Strategies: • 1. Descriptive-Any research that observes and records. Does not talk about relationships, it just describes behavior. • 2. Correlations – research that seeks to predict behavior • 3. Experiment- these seek to explain behavior or reveal cause and effect
Types of Descriptive research tools: • 1. Case Study • 2. Survey • 3. Naturalistic Observation
The Case Study • Where one person (or situation) is observed in depth. • What are the strengths and weaknesses of using a tragedy like the Columbine School Shootings as a case study? • Strength: the research contains in-depth data. • Weakness: You can’t necessarily generalize your findings to the rest of the population and…… -It’s time consuming research
The Survey Method • Used in descriptional, correlational or experimental research. • Use interview, mail, phone, internet etc… • For ex: “People should have access to any information that is available on the internet at their local library”
Do you know what you’re answering? • 1255 adults surveyed by New York’s American Museum of Natural History responded that: • 77% were interested in plants and trees but only 39% were interested in botany • 48% were interested in fossils buy only 39% were interested in paleontology • 42% were interested in rocks and mineral, but only 53% were interested in geology
Survey Method: The Bad • Low Response Rate • People Lie or just misinterpret themselves. • Wording Effects • Social desirability bias. How accurate would a survey be about the frequency of diarrhea? Test cheating? Infidelity?
What are the Pros and Cons? • Pro: cheap, anonymous, diverse population, and easy to get random sampling (a sampling that represents your population you want to study). • Cons: people not honest when answering and the “wording effect” (people answer questions they don’t understand)
What would be the most accurate way to survey Bayside students about how many hours they study? • 1. Population • 2. Representative Sample • 3. Random sampling • Question???? Which do you think is better in research…. a small sample or a large one? • Let’s find out with our M & M’s
Naturalistic Observation • Observing and recording behavior in natural environment. • No control- just an observer. What are the benefits and detriments of Naturalistic Observation?
Correlational Research • Detects how well one variable predicts, not causes another variable. • Does NOT say that one variable causes another. • Correlation does not prove causation!!!!!!!!!! There is a positive correlation between ice cream and murder rates. Does that mean that ice cream causes murder?
Correlation • Studies show that there is a strong correlation between how many hours a child watches T.V. and the rate of obesity. • Does watching T.V. cause obesity?????
Types of Correlations • Positive: shoe size and height or School attendance and grades If both go up or down, it’s positive • Negative: washing hands and catching colds If one goes up and the other down, it’s negative Negative DOES NOT mean weaker!!!!!!!
Scatterplot • How you plot or graph the correlation numbers • Let’s plot some data for practice
Measured using a correlation coefficient. • A statistical measure of the extent to which two factors relate to one another • This is a NUMBER!!!!!!!!!!!! • It’s either + or – • The closer the number is to 1 the STRONGER the correlation is
Which correlation coefficient has the strongest relationship? The weakest? • A. .79 • B. -.88 • C. .09 • D. 3.6 • E. -.05
What is an illusory correlation? • Last time your dad won the golf game he was wearing his Redskins cap. Now he wears it EVERYTIME he play.
Steps In An Experiment: • Theory- “I believe that giving drug X might help reduce the symptoms of hyperactivity for those diagnosed with ADHD.” • Step 1. What would be the hypothesis?
Step 2. Operationalize the variables. Step 3. Identify the IV and DV. Always use this sentence: What is the affect of ________(IV) on the ________(DV)?
Let’s do some practice ones • Developmental psychologists want to know if exposing children to public t.v. improves their reading skills. • 2. Behavioral psychologists want to know whether reinforcing comments (“good job”) will make people work harder on an assembly line, • 3. A social psychologists wants to know whether being polite or rude to people tends to make them more cooperative.
Step 4. Eliminate extraneous or confounding variables.What could be some in this example? Step 5. What’s your population? Step 6. Get a representative sample. How?
Step 7. Randomly assign the subjects. How do you do that? Step 8. Decide: blind or double-blind? What does that mean? Step 9. Run the experiment and collect the data.
10. Describe the data (numbers) statistically There are two ways: Measures of central tendency OR Measures of Variation
Measures of Central Tendency: • Mode- most occurring score • Mean- the average of the scores • Median- the 50th percentile score, middle score
Practice: • The four families on your block all incomes of $40,000. If a new family moves in making $86,000, which measure of central tendency would be most affected? • Mode • mean • Median • independent variable
What would be the median of the following distribution: 5, 5, 7, 12, 4, 1, 16 • Answer:
Measures of variation • 1. Range- range from highest to lowest • 2. Standard deviation- how much the scores vary
Range • - should form a bell or normal curve This measure is greatly affected by extreme scores!!! • If curve leans due to a few high or low scores, then it is called skewed.
Men’s shoe sizes • The average is a size 9. It forms a bell curve. A skewed curve: For horse jockey’s, it would look like this: For basketball players, it would look like this:
Standard Deviation • Shows how closely or consistent the scored are packed or not. • Small standard deviation: GOOD! • Large standard deviation: BAD!! • Why?
Standard Deviation: • Which college’s SAT scores (of their incoming freshmen) have a small standard deviation? William and Mary OR TCC?
Practice: Your track team discus thrower wants to know how consistent the distance for his throws have been. Which should he compute? • Median • Mode • Standard deviation d. range
Practice: • Your Aunt Norma and Uncle Jasper from WV are thinking of moving to VB after seeing a commercial claiming that the average income in VB is $80,000. Which measure would give a more accurate picture of the income level in VB? • mode C. range • median D. mean
Statistically significant • A measure of how likely an event is due to chance alone; …….. in other words, how much can you trust the results?