Download
1 / 3
30 likes | 120 Views
Flow of 3 He in 640 nm thick slabs Jeevak M. Parpia, Cornell University, DMR 0806629.

E N D
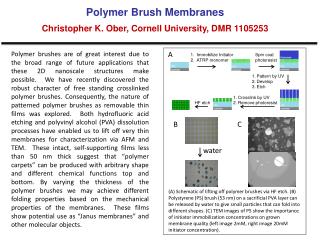
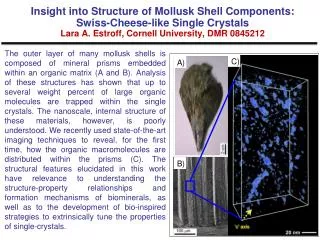
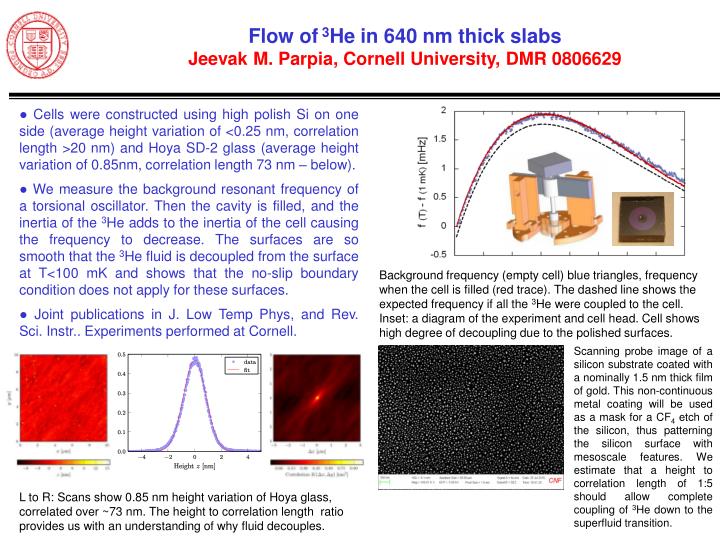
Flow of 3He in 640 nm thick slabsJeevak M. Parpia, Cornell University, DMR 0806629 ● Cells were constructed using high polish Si on one side (average height variation of <0.25 nm, correlation length >20 nm) and Hoya SD-2 glass (average height variation of 0.85nm, correlation length 73 nm – below). ● We measure the background resonant frequency of a torsional oscillator. Then the cavity is filled, and the inertia of the 3He adds to the inertia of the cell causing the frequency to decrease. The surfaces are so smooth that the 3He fluid is decoupled from the surface at T<100 mK and shows that the no-slip boundary condition does not apply for these surfaces. ● Joint publications in J. Low Temp Phys, and Rev. Sci. Instr.. Experiments performed at Cornell. Background frequency (empty cell) blue triangles, frequency when the cell is filled (red trace). The dashed line shows the expected frequency if all the 3He were coupled to the cell. Inset: a diagram of the experiment and cell head. Cell shows high degree of decoupling due to the polished surfaces. Scanning probe image of a silicon substrate coated with a nominally 1.5 nm thick film of gold. This non-continuous metal coating will be used as a mask for a CF4 etch of the silicon, thus patterning the silicon surface with mesoscale features. We estimate that a height to correlation length of 1:5 should allow complete coupling of 3He down to the superfluid transition. L to R: Scans show 0.85 nm height variation of Hoya glass, correlated over ~73 nm. The height to correlation length ratio provides us with an understanding of why fluid decouples.
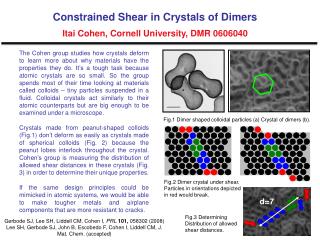
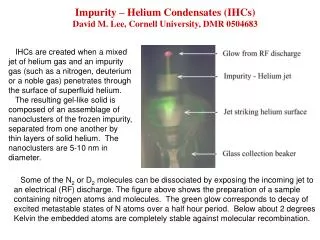
Experiments on Time Dynamics in Solid Helium Jeevak M. Parpia, Cornell University, DMR 0806629 Torsion oscillator results showing strong time, temp dependent behavior in dissipation (top) and frequency shift (lower). Note that at longer times after the temperature stabilizes (red), dissipation rises and the period shift decreases. Below: A data for dissipation and frequency shift obtained following “equilibrium”. The solid lines represent the behavior predicted for a simple glassy freeze out. Note that the period shift (blue) is in excess of the predicted value. B Map of the time dependent dissipation accompanying the shift in frequency (so-called supersolid signal). Excess dissipation and time dependent behavior is more consistent with glassy rather than supersolid behavior ● A highly mechanically isolated torsional oscillator was excited capacitively and detected with a SQUID readout to enable measurements with large dynamic range. ● Time dependent studies of both the dissipation and frequency shift reveal that the period shift – usually associated with the onset of supersolidity, is accompanied by an increasing time-dependent dissipation (see upper figures at right). This dissipation is in excess of that expected for the usual glassy behavior. ● The dissipative map reveals a large excess dissipation around 50 mK. Experiments underway (as yet unpublished) using the exceptional dynamic range reveal no features at the usual “onset of supersolidity”, ie the signatures are more consistent with the existence of inertially active excitations.
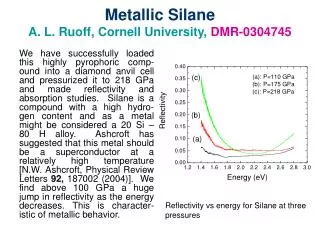
Order of Magnitude Calculations: How to Think like a Scientist Jeevak M. Parpia, Cornell University, DMR 0806629 ● PI Jeevak Parpia presented a lunchtime talk to CNF nanofab REU students (June 30, 2010). Focused on the Gulf oil spill – it uses current events to illustrate and enable students to engage in “back of the envelope” calculations to obtain estimates from real world data. ● Students were also teamed together to provide an estimate for ocean level rise and mitigating factors associated with melting of the Greenland icecap. ● The objective is to provide confidence building for students, to get them to work in teams, to link classroom knowledge to real world situations, and above all to develop physical intuition. Presentation by webinar. Relate this to this to provide this Volume / sec = p r2 v, r = 10 inches = 3 x 0.25 m x 0.25m x 30 m/s = 8m3/s =8000 l/s = Barrel is around 50 gallons = 200 liters so the estimate is for around 40 barrels/sec Remember we said we overestimated by about a factor of 10 (at least) so I would feel comfortable with a first guess of 4 barrels/sec or 320,000 barrels/day!