Download
1 / 33
330 likes | 492 Views
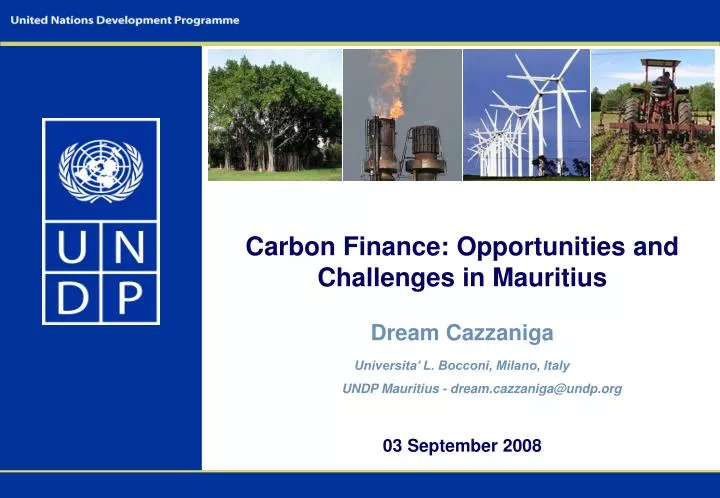
Carbon Finance: Opportunities and Challenges in Mauritius Dream Cazzaniga. Universita’ L. Bocconi, Milano, Italy UNDP Mauritius - dream.cazzaniga@undp.org. 03 September 2008. Overview. Status of energy supply & demand The CDM and the Carbon Market

E N D
Carbon Finance: Opportunities and Challenges in Mauritius Dream Cazzaniga Universita’ L. Bocconi, Milano, Italy UNDP Mauritius - dream.cazzaniga@undp.org 03 September 2008
Overview • Status of energy supply & demand • The CDM and the Carbon Market • Opportunities & Challenges for Carbon Market in Mauritius • UNDP’s Carbon strategy
Agenda • Status of energy supply & demand • The CDM and the Carbon Market • Opportunities & Challenges for Carbon Market in Mauritius • UNDP’s Carbon strategy
Republic of Mauritius: Dependence on Fossil Fuel
CO2 and non-CO2 Emissions 2.52 tonnes CO2 per capita (2006)
Sectoral CO2 Emissions (2006) Electricity & Transport account for >82% of total emissions
Electricity Demand - 1 Demand growing at 5-6% per annum over the past decade
Electricity Demand - 2 (Sectoral Consumption) Commercial, Industrial and Domestic activities claim one third each of electricity consumption
Electricity Supply (Fuel Input, 2006) ~78% of electricity produced from fossil fuels 8
Fueling Transport • 100% dependence on fossil fuels • Gasolene – 23%; Diesel – 41%; Aviation – 35%; LPG – 1% • Claims almost 50% of final energy consumption • Offers huge opportunities for emissions reduction, but may also be more challenging
Agenda • Status of energy supply & demand • The CDM and the Carbon Market • Opportunities & Challenges for Carbon Market in Mauritius • UNDP’s Carbon strategy
The legal framework for the Carbon Market Kyoto Protocol (COP 3 - 1997) The Protocol creates legally binding obligations for 38 industrialized countries (countries Annex I) to return their emissions of greenhouse gases (GHG) to an average of 5% below their 1990 levels by 2012 Marrakech Accords (COP 7 - 2001) Define the principles of the Kyoto Protocol’s flexible mechanisms: - Clean Development Mechanism (CDM) - Joint Implementation (JI) - Emissions Trading (ET)
Developed countries can reduce emissions anywhere in the world They can count these reductions towards their own targets CDM allows developed countries to generate ‘Carbon credits’ (Certified Emission Reductions, CERs) in developing countries The role of the Clean Development Mechanism (CDM) Advantages for developed countries (Annex 1): relatively low-cost & politically acceptable Advantages for developing countries (non-Annex 1): inward investment, environmental & technology benefits
How does a CDM project generate Carbon credits • Carbon credits (CERs) represent the difference between the baseline (Business as Usual scenario) and actual emissions. • CERs acquired by Annex 1 countries increase the national emissions cap.
Baseline study • Every Carbon project requires abaseline study • The purpose of the baseline study is to determine the baseline scenario for each GHG component of the project • In order not to exaggerate the emission reductions achieved by the project, the baseline study must adopt aconservative approachwhenever assumptions about future developments need to be made (The principle ofconservativeness) • A baseline is calculated through a methodologywhich is an application of a baseline approach to an individual project activity, reflecting aspects such as sector and region.
Additionality • The Kyoto Protocol states: • “Reductions in emissions must be additional to any that would occur in the absence of the project activity” • Assessment of additionality is intrinsically linked with the baseline • establishment • We can articulate ‘additionality’ in: • Environmental additionality– reductions in GHG emissions (It is essential: otherwise, it will not generate any carbon credits!) • Financial additionality– the project only happens because of the financial incentive offered by carbon credits • Legal additionality– the project does more than what is required by local law 15
Carbon revenue makes the project attractive relative to investment alternatives Investmentthreshold Revenue / NPV / IRR Project without carbon revenue is profitable – but not sufficiently profitable compared with alternatives Project without carbon element Project with carbon element Financial additionality • Benchmark analysis An appropriate financial indicator can be used for a comparison with a relevant benchmark value: e.g. required return on capital or internal company benchmark
In 3 years, the CDM has sparked a $5 billion/year market Number of Projects in the CDM Pipeline,January 2005 – March 2008 3,265 3,035 2,838 Compound Monthly Growth Rate = 11% Approximately 3 billion CERs by 2012 2,593 2,285 1,885 1,759 1,495 1,311 1,141 883 749 647 554 440 275 171 118 83 67 Jan05 Mar05 May05 Jul05 Sep05 Nov05 Jan06 Mar06 May06 Jul06 Sep06 Nov06 Jan07 Mar07 May07 July07 Sep07 Nov07 Jan08 Mar08 17
Non-Kyoto MandatoryRegimes Kyoto Mandatory Regime Voluntary Regimes UNFCCC New South Wales (Australia) Chicago Climate Exchange (CCX) Kyoto Protocol Individual US States(East Coast, California, Oregon) CDM Non-Annex 1 Countries (Developing Countries) Retail Market LinkingDirective European Union Trading Scheme (EU-ETS) Joint Implementation Annex 1 Countries There are over 45 Carbon Markets – but 3 principal regimes 18
Agenda • Status of energy supply & demand • The CDM and the Carbon Market • Opportunities & Challenges for Carbon Market in Mauritius • UNDP’s Carbon strategy 19
Sub-Saharan Africa is struggling … Number of CDM Projects In Selected Countries (May 2008) (Registered projects) • 4 countries (China, India, Brazil and South Korea) account for 70% of CDM projects and 80% of CERs through to 2012 • Sub-Saharan Africa accounts for 2% of registered projects and 5% of CERs through to 2012 • Africa accounts for 11% of global GHG potentialreductions by 2010
Electricity - How ‘dirty’ is Mauritius grid? EFgrid,OM,y : Generation-weighted average CO2 emissions net of electricity generated (excludes low-cost, must run plants & CDM projects). For Mauritius: EFgrid,OM,y = 0.9243 tCO2 / MWh; EFgrid,BM,y = 1.0322 tCO2 / MWh; EFgrid,BM,y : Generation-weighted average CO2 emissions net of electricity generated of either 5 most recently built plants or 20% of last power generated. EFgrid,CM,y = 0.9783 tCO2 / MWh QUITE DIRTY Much scope for CO2 reductions through the use of Energy Efficiency and Renewable Energy
Electricity - 1 Demand Side Management (CFLs - Compact fluorescent lamps) • Replacing incadescent lamps with CFLs • CEB 1million CFLs project (3 X 14W CFLs per household in Mauritius by September 2008) Expected night demand reduction by up to 20 MW • CEB already has a contractual agreement with Climate Care for looking into C-finance of project (VERs/CERs) • UNDP working on a strategy to generate demand for an additional 1-2 million CFLs • Also carrying out a detailed analysis of lighting needs / status in: (1) hotels (2) local authorities and (3) industrial estates
Electricity - 2 • Solar Hot Water Units • The Government of Mauritius is providing an • economic incentive to deploy Solar Hot Water (SHW) • units for replacing existing electricand gas water heaters. • This project can yield between 6,114 tCO2e/yr and 8,253 tCO2e/yr • by the end of 2009 (for 20000 SHW units) • Assuming 1 CER = Euro 10, carbon layer is in the range of • Euro 61,140-82,530 by end of 2009 • Potential for further deployment: • ~97800 SHW units 29,897-40,362 tCO2e/yr • Euro298,970-403,620/yr. • CDM methodology for SHW systems is being developed by SouthSouthNorth
Electricity – 3 Renewable Energy (Wind / PV) • Strong potential • CO2 reductions: Electricity input/year x EFgrid for a 25MWp --> 50,000 MWh/year x 0.9522 tCO2/MWh = = 48,918 tCO2/year (CERs)for 100 MWp --> 195,672 tCO2/year (CERs ) • Challenges • Lack of wind and solar insolation maps prevent the accurate determination of wind and solar (PV) energy potentials, as well as geographical distribution • High upfront capital costs • Need a foreword looking Energy Policy for laying down the right instruments (e.g. feed-in tariffs, portfolio standard; fiscal & economic incentives, etc.) for mkt development of renewables.
Bio-fuel – fuel switch / bio-ethanol • Mauritius capacity: 30 million liters/yr. • In 2006: used 89,000t gasolene [173,000t diesel oil] • Equivalent to ~274,000 tCO2 / yr [3,070tCO2/t(fuel)] • E10 (10%bioethanol:90% gasolene) ~27,400 tCO2 reduct. / yr • E25 (25%bioethanol:75% gasolene) ~68,300 tCO2 reduct./ yr • Bio-diesel [B10] ~54,600 tCO2 reductions / year • No policy to date (legal, technical, financial, economic framework) for the promotion of E10-E25 • No baseline & monitoring methodologies
Transport – Improving Efficiency in Bus Transit • Two projects being discussed: • - (P1) bus fleet renewal - (P2) bus lane modernization • P1 – involves renewal of 2700 buses with more efficient buses, including diesel-electric hybrid vehicles • Hybrid buses 77,100 tCO2 reductions / yr • (start with only 200 buses – i.e. 5711 tCO2 reduct./ yr) • Barriers: (1) Finance • (2) Fuel grade puts emissions standard at between Euro 0 and Euro 1, while new, efficient engine technologies would be rated above Euro 3 • (3) Size of the project
Bundling and Programmatic CDMs • Benefit/cost analysis does not favour small stand-alone projects. I.e. Agalega Energy Efficiency project (CNO biofuel + 6 kWh/m2/day solar insolation) --> But only ~386 tonnes CO2/yr reduction • Bundling: • Similar small-scale projects can be bundled into one CDM project Each activity in the bundle is an individual CDM project activity • Composition of the bundle does not change over time • All projects must be submitted and start at the same time • Programmatic CDMs • The sum of all individual activities under the programme is the CDM project activity • No pre-fixed composition (because, for example, uptake of an incentive could be unknown) • Activities can be added on an ongoing basis
Agenda • Status of energy supply & demand • The CDM and the Carbon Market • Opportunities & Challenges for Carbon market in Mauritius • UNDP’s Carbon strategy 28
UNDP’s objective Objective for UNDP MDG Impact of Carbon Projects CurrentCDM Market Geographical & Sectoral Diversity of Carbon Projects 29
UNDP’s two-pronged Carbon strategy Capacity Development MDG Carbon Facility Provides support to private-sector project developers Through: provision of a comprehensive package of services to assist with the preparation and implementation of carbon projects. Creating an ‘operational’ CDM framework in participating countries – an environment in which functioning public institutions are able to effectively interact with the private sector to jointly develop carbon projects. Through: Workshops, tutorials, technical support, awareness-raising, scoping studies… …for (DNA) Designated National Authorities, government, ministries & agencies, consultants, private sector,trade bodies, academics, project developers, etc. 30
MDG Carbon Facility MDG Carbon Facility CDM Activities UNDP Fortis Project Development Services Carbon Banking Services Project Proponents www.mdgcarbonfacility.org 31
Many thanks for their contribution to : Mr. Prakash (Sanju) Deenapanray CDM National Project Coordinator prakash.deenapanray@undp.org Mr. Robert Kelly Regional Coordinator, CDM capacity development Southern and Eastern Africa Thank you dream.cazzaniga@undp.org