Download
1 / 71
730 likes | 1.05k Views
Segmentation and Targeting. Concepts: STP Methods Case Intros. How STP Creates Value. Segmentation Identify segments. Targeting Select segments. Positioning Create competitive advantage. Marketing resources are focused to better meet customers needs and deliver more value to them.

E N D
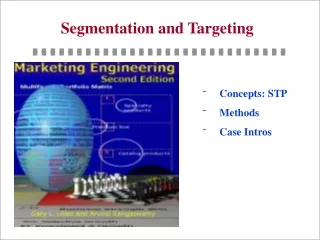
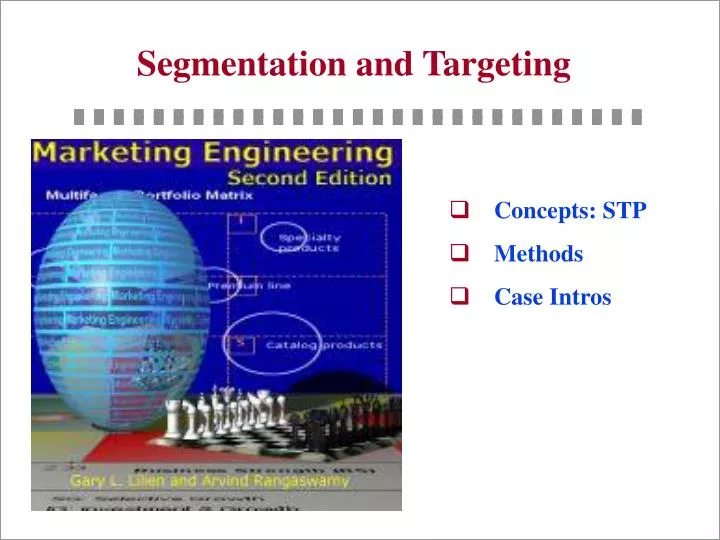
Segmentation and Targeting • Concepts: STP • Methods • Case Intros
How STP Creates Value Segmentation Identify segments Targeting Select segments Positioning Create competitive advantage Marketing resources are focused to better meet customers needs and deliver more value to them Customers develop preference for brands that better meet their needs and deliver more value Customers become brand/supplier loyal, repeat purchase, communicate favorable experiences Brand/supplier loyalty leads to increased market share and creates a barrier to competition Fewer marketing resources needed over time to maintain share due to brand or supplier loyalty Profitability (value to the firm) increases
“The Market” Vs. “Segments” A High D F B Average Competency in Segment C E G Low I J Low Average High Segment Attractiveness Find Value-Based Segments • Evaluate competencies vs. attractiveness
Market Segmentation • Market segmentation is the subdividing of a market into distinct subsets of customers. Segments • Members are different between segments but similar within.
Markets are Dynamic • Segments may be unstable over time • Buyer behavior changes • Competitors change • The business environment changes • This means that it is important to view segmentation as . . . • A process to support business decisions • Not a static classification of the market
The Many Uses of Segmentation • Short-term segmentation applications: • Salesforce allocation/call planning • Channel assignment • Communication program development: spending, allocation and messaging • Pricing Focus on today’s competitors and my current relative advantage to the customer
The Many Uses of Segmentation • Longer term: • Emerging needs (Opportunity-focused segmentation) • New and evolving segments to serve • Planning for segment development/growth and anticipating competitive threats • Key-influencer spill-over Market driving (vs. customer focused)
Headache SAMPLE SEGMENTATION STUDY FOR A HEADACHE REMEDY Super-Stressed Reactionaries Reluctantly Reliants Savvy Functionalists Disciplined Bodies ChronicCombatants % Adults: 10% 14% 12% 17% 17% Past 30 Day Headache:SufferersVolumeMed TreatersMed Volume 100%= 100%= 100%= 100%= 13%25%13% 25% 13%16%13% 20% 16%18%16% 15% 19%16%21% 17% 13%8%13% 10% % SufferReg/Occ’lyRegularly 82%35% 58%20% 75%23% 45%8% 63%10% 4.0 Severity of Headache(6 pt scale) 4.4 3.7 3.3 3.1 % of All Headaches: % Mild / Moderate 100%=% Severe 100%=% Migraine 100%= 16%31%33% 12%9%12% 18%20%18% 12%9%11% 13% 10%13% Share of Pain Days: % Mild / Moderate % Severe % Migraine 100% 45%33%22% 100%65%20%15% 100%60%25%15% 100%68%18%14% 100%65% 20%15% Concern Treat Judiciously Sharply Limits Life Reaction toHeadache Upsetting,Distracts From Responsibilities Reach forthe Cure (Med) Quickly Move About;OTC MedsIf Gets Worse Mostly Rx, OTC …With Non-meds Rx and OTC ...Relaxation Put off Till Severe,Then OTC Meds OTC Meds atFirst Twinge Treatment Desired MedAspects Powerful,Long-lasting Relief Safe Immediacy Fast No Side Effects Targeting Opportunities
In the Final Analysis…. Little Measurable Value …… Most segmentation projects are one-time Projects that drain resources
A Four-Phase Process for Successful Segmentation Analysis Project Phase IV Analysis and Implementation Phase I Planning and Design Phase II Qualitative Assessment Phase III Quantitative Measurement Internal Assessment & Planning Qualitative Research Quantitative Survey • Objective(s) of segmentation • Resources • Constraints Interview Materials Development·· Qualitative Data Collection· · “Deep needs”Identification· · Decision-Making Process Assessment· · Sample Design··· Questionnaire Development· · · Data Collection· · · Segmentation Analysis • Cluster Analysis • Portfolio Analysis • Positioning Analysis Implementation Through Database Tools Database Review • Call Center • Web • Sales call patterns • Promotion • …. • Primary data already available • Secondary data • … Classification Tool Development • Discriminant function • Binary (CART) tree • … Prototype Implementation Exercises • What ifs? • Relevant groups involved? • …..
Primary Characteristicsof Segments • Bases—characteristics that tell us why segments differ (e.g., needs, preferences, decision processes). • Descriptors—characteristics that help us find and reach segments. (Business markets) (Consumer markets) Industry Age/Income Size Education Location Profession Organizational Life styles structure Media habits
Consumer Industrial Segmentation Needs, wants benefits, Needs, wants benefits, solutions to Bases solutions to problems, problems, usage situation, usage rate, usage situation, usage rate. size*, industrial*(*=macro-bases) Descriptors Age, income, marital status, Industry, size, location, current Demographics family type & size, supplier(s), technology utilization, gender, social class, etc. etc. Psychographics Lifestyle, values, & Personality characteristics of personality characteristics. decision makers. Behavior Use occasions, usage level, Use occasions, usage level, complementary & complementary & substitute substitute products used, products used, brand loyalty, order brand loyalty, etc. size, applications, etc. Decision Making Individual or group Formalization of purchasing (family) choice, low or high procedures, size & characteristics involvement purchase, of decision making group, use of attitudes and knowledge outside consultants, purchasing about product class, price criteria, (de)centralizing buying, sensitivity, etc. price sensitivity, switching costs, etc. Media Patterns Level of use, types of Level of use, types of media used, media used, times of use, time of use, patronage at trade shows, etc. receptivity of sales people, etc. Variables to Segmentand Describe Markets
Managing Segmentation • Define segmentation problem • Conduct market research • Build segmentation database • Define market segments • Describe market segments • Implement results!
1. Define Segmentation Problem • View market segmentation problem as a series of hierarchical stages -- for example • Identify broad strategic “macro-segments” that effectively define market structure • Industry groups • Product usage (rate of usage, application, etc.) • Geographic location, etc. • Within macro-segments, conduct research to find “micro-segments” for competitive advantage • Segmentation on buyer needs and value • Segmentation on product benefits
Mass Market Macro Segments C B A Micro Segments Segments of One Levels of Segmentation
2. Conduct Market Research Phase 1 Phase 2 Phase 3 Exploratory Study Market Segmentation Study Implement Marketing Program Segment Response Analysis & Planning Market research supports the segmentation process
Importance Competitor Usage Response Importance ratings perceptions variables variables Demog Factors Org # BC # Resp # 1 …………k 1…………..r 1……….s 1…………t 1…….v 1……….m<k 1 1 1 8 9 9 . . . etc. 1 1 2 3 4 9 . . . 1 1 3 2 5 8 . . . 1 2 1 9 8 8 1 2 2 9 6 2 1 2 3 9 8 9 1 2 4 8 6 3 2 1 1 etc. 2 1 2 2 1 3 etc. 3. Build Segmentation Database
4. Define Market Segments • Assume the following data matrix includes the responses from six customers on four key components of value (10 point rating scale of importance) • How would you segment this “market”?
5. Describe Market Segments • Suppose the market for 300 users of industrial adhesives were represented by the table below • What can we conclude from this table? Segments based on needs Organization size as a descriptor
Respondent Selection/Aggregation Issues • Who makes the purchasing decision:? DMU (decision making unit)? • Roles of individuals • Purchasing agent? • User? • Specifier? • Gatekeeper? • Financial analyst? • How many respondents per unit? • If more than one, how to aggregate?
Segmentation: Methods Overview • Factor analysis (to reduce data before cluster analysis). • Cluster analysis to form segments. • Discriminant analysis to describe segments.
Cluster Analysis forSegmenting Markets • Define a measure to assess the similarity of customers on the basis of their needs. • Group customers with similar needs. The software uses the “Ward’s minimum variance criterion” and, as an option, the K-Means algorithm for doing this. • Select the number of segments using numeric and strategic criteria, and your judgment. • Profile the needs of the selected segments (e.g., using cluster means).
Cluster Analysis Issues • Defining a measure of similarity (or distance) between segments. • Identifying “outliers.” • Selecting a clustering procedure • Hierarchical clustering (e.g., Single linkage, average linkage, and minimum variance methods) • Partitioning methods (e.g., K-Means) • Cluster profiling • Univariate analysis • Multiple discriminant analysis
• • • • • Perceptions or ratings datafrom one respondent III Dimension 2 b • • • • • • • a II I Dimension 1 Doing Cluster Analysis a = distance from member to cluster center b = distance from I to III
Single Linkage Cluster Example Distance Matrix Co#1 Co#2 Co#3 Co#4 Co#5 Company #1 0.00Company #2 1.49 0.00Company #3 3.42 2.29 0.00Company #4 1.81 1.99 1.48 0.00Company #5 5.05 4.82 4.94 4.83 0.00 ResultingDendogram 1 2 3 Company 4 5 1 2 3 4 5 Distance
Ward’s Minimum Variance Agglomerative Clustering Procedure First Stage: A = 2 B = 5 C = 9 D = 10 E = 15 Second Stage: AB = 4.5 BD = 12.5 AC = 24.5 BE = 50.0 AD = 32.0 CD = 0.5 AE = 84.5 CE = 18.0 BC = 8.0 DE = 12.5 Third Stage: CDA = 38.0 CDB = 14.0 CDE = 20.66 AB = 5.0 AE = 85.0 BE = 50.5 Fourth Stage: ABCD = 41.0 ABE= 93.17 CDE = 25.18 Fifth Stage: ABCDE = 98.8
Ward’s Minimum Variance Agglomerative Clustering Procedure 98.80 25.18 5.00 0.50 A B C D E
Interpreting Cluster Analysis Results • Select the appropriate number of clusters: • Are the bases variables highly correlated? (Should we reduce the data through factor analysis before clustering?) • Are the clusters separated well from each other? • Should we combine or separate the clusters? • Can you come up with descriptive names for each cluster (eg, professionals, techno-savvy, etc.)? • Segment the market independently of your ability to reach the segments (i.e., separately evaluate segmentation and discriminant analysis results).
Profiling Clusters Two Cluster Solution for PC Data: Need-Based Variables 1 Design Means of Variables 0 Business –1 size power office use LAN color storage needs wide connect. periph. budget
Discriminant Analysis forDescribing Market Segments • Identify a set of “observable” variables that helps you to understand how to reach and serve the needs of selected clusters. • Use discriminant analysis to identify underlying dimensions (axes) that maximally differentiate between the selected clusters.
Two-Group Discriminant Analysis XXOXOOO XXXOXXOOOO XXXXOOOXOOO XXOXXOXOOOO XXOXOOOOOOO Price Sensitivity X-segment Need for Data Storage O-segment x = high propensity to buy o = low propensity to buy
Interpreting Discriminant Analysis Results • What proportion of the total variance in the descriptor data is explained by the statistically significant discriminant axes? • Does the model have good predictability (“hit rate”) in each cluster? • Can you identify good descriptors to find differences between clusters? (Examine correlations between discriminant axes and each descriptor variable).
Implementing SegmentationTree-Based Classification Tool Q1_1: How would you rate your current overall health? Q1_16J: My doctor is very competent and good at what s/he does. Q3_13AA: Prescription medication reduces risk of heart attacks and stroke. Q4_15: Have you ever asked your doctor about a specific brand medication for your high cholesterol? Q1_16J: My doctor is very competent and good at what s/he does.Q3_13CJ: Exercise makes me feel better/healthier. Q3_13AA: Prescription medication reduces risk of heart attacks and stroke.
“Best Offer” Query Model: Female-owned small business Line of Business? Other ________ Professional/Social/Personal Services Alternative Model N Y N Work at Home? Y Customer Access Problem? Offer A Customer Access Problem? Y N Caller ID? Y Y Offer A Call/Caller Priorities? N N Terminate Offer B Which Complaints? Offer D N Y Have Website? • Can’t Find You • Busy Signal • Frustrating Voice-Mail • Put on Hold Too Long • Other Compete with personalized service? Offer C N Y Terminate Offer D Customized Recommendation Integrating Targeting and Relationship Management
Managerial Uses of Segmentation Analysis • Select attractive segments for focused effort (Can use models such as Analytic Hierarchy Process or GE Planning Matrix, or Response Model). • Develop a marketing plan (4P’s and positioning) to target selected segments. • In consumer markets, we typically rely on advertising and channel members to selectively reach targeted segments. • In business markets, we use sales force and direct marketing. You can use the results from the discriminant analysis to assign new customers to one of the segments.
Checklist for Segmentation • Is it values, needs, or choice-based? Whose values and needs? • Is it a projectable sample? • Is the study valid? (Does it use multiple methods and multiple measures) • Are the segments stable? • Does the study answer important marketing questions (product design, positioning, channel selection, sales force strategy, sales forecasting) • Are segmentation results linked to databases? • Is this a one-time study or is it a part of a long-term program?
Segmentation Summary In summary, • Use needs variables to segment markets. • Select segments taking into account both the attractiveness of segments and the strengths of the firm. • Use descriptor variables to develop a marketing plan to reach and serve chosen segments. • Develop mechanisms to implement the segmentation strategy on a routine basis (one way is through information technology).
. . . . . . . . . . . . Targeting . . . . . . . . . . . . . . . . . . . . . . Segment(s) to serve Price Sensitivity/ Pain of Expenditure (Importance) . . . . . . . . . . . . Need for Premium Service/Differentiation (Importance)
Criterion Examples of Considerations I.Size and Growth 1. Size • Market potential, current market penetration 2. Growth • Past growth forecasts of technology change II.Structural Characteristics 3. Competition • Barriers to entry, barriers to exit, position of competitors, ability to retaliate 4. Segment saturation • Gaps in the market 5. Protectability • Patentability of products, barriers to entry 6. Environmental risk • Economic, political, and technological change III.Product-Market Fit 7. Fit • Coherence with company’s strengths and image 8. Relationships with • Synergy, cost interactions, image transfers, segments cannibalization 9. Profitability • Entry costs, margin levels, return on investment Which Segments to Serve?—Segment Attractiveness Criteria
Selecting Segments to Serve E Strong Firm’s Competitive Position B Medium D A C Weak Low Average High Segment Attractiveness
McKinsey/GE Approach • Specify drivers of each dimension • Weight drivers • Rate SBUs on each driver • Multiply weights times rates for each SBU • View resulting graph • Review/sensitivity analysis
Choice Models for Individual Customer Targeting 1. Observe choice Buy/not buy è direct marketers Brand bought èpackaged goods, ABB Share of req’ts materials Mfg’rs 2. Capture related data • demographics • attitudes/perceptions • market conditions (price, promotion, etc.) 3. Link 1 to 2 via “choice model” è model reveals importance weights of characteristics
Contexts in Which ChoiceModels are Appropriate • Multinomial Choice • Tide, Cheer, Yes, or Wisk • Bus, Train, or Plane • Yes, No, Don’t Know • Binary Choice • Buy or Not Buy • Yes or No • Own or Don’t own • Bush or Kerry Choices are mutually exclusive. The customer chooses only one of the options at a given choice occasion.
Using Choice Models • Choice Model Inputs • Past purchases/shares of reqt’s • Market conditions (prices, etc.) • Customer attitudes (surveys) • Etc. • Choice Model Outputs • Purchase probability or share of requirements BY CUSTOMER
Choice Models vs Surveys With standard survey methods . . . preference/ importance choice ï weights ´ perceptionsñññ predict observe/ask observe/ask Choice models give us… importance choice ï weights ´ perceptionsñññ observe infer observe/ask
Why Choice Models in Marketing? • Ever more data available about choices customers/prospects make. Much of this data is automatically collected (e.g., scanners, web logs). • Such data are useful for: • Predictive modeling: Usually, an individual’s past behavior (choices) is a better predictor of his/her future actions than stated attitudes or intentions. • Generating diagnostics: Identifying the important drivers of customer choices. • Segmenting customers: Grouping customers on the basis of similarities in their choice drivers/process.
Using Choice Models for Customer Targeting Step 1 Create database of customer responses (choices) based either on test mailing to a sample of prospects/customers, or historical data of past customer purchases. Step 2 Use models such as regression, RFM, and Logit to assess the impact of independent variables (drivers) of customer response. Score each customer/prospect based on the drivers identified in Step 2 - the higher the score, the more likely is the predicted response. Step 3 Step 4 Classify customers into deciles (or smaller groupings) based on their scores. Step 5 Based on profitability analyses, determine the top deciles to which a marketing action (e.g., mailing of brochure) will be targeted.
Database for BookBinders Book Club Case Step 1 Predict response to a mailing for the book, Art History of Florence, based on the following variables accumulated in the database and the responses to a test mailing: • Gender • Amount purchased • Months since first purchase • Months since last purchase • Frequency of purchase • Past purchases of art books • Past purchases of children’s books • Past purchases of cook books • Past purchases of DIY books • Past purchases of youth books