Download

1 / 31
310 likes | 432 Views
Phys 175. College Physics. Download the following files:. Syllabus. All the documents are available at the website: http://www2.swccd.edu/~ hlee. Introduction. Wilfred Hok Kong LEE, Ph.D. Office: 343A Mail box: MSE Office 215 Contact Info: Email: hlee@swccd.edu Phone: ext. 5533.

E N D
Phys 175 College Physics
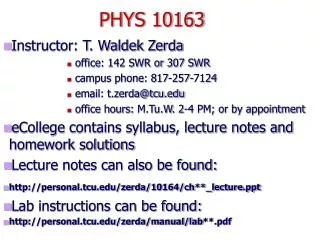
Download the following files: • Syllabus All the documents are available at the website: http://www2.swccd.edu/~hlee
Introduction Wilfred Hok Kong LEE, Ph.D. Office: 343A Mail box: MSE Office 215 Contact Info: Email: hlee@swccd.edu Phone: ext. 5533 Mon 11:45-1:30 Tue 1:15-2:00 Wed 11:45-1:30 Thu 1:15-2:00
Textbook & Course Homepage • Optional: Principles of Physics (5th edition), by Serway & Jewett • Course Homepage: • http://www2.swccd.edu/~hlee • Lab manuals will be posted on this site. Print out the lab manuals BEFORE you come to class. • Your scores will be posted on Blackboard Online: • Go to the Southwestern College homepage • http://www.swccd.edu • Click on “Online Class Login” under “E-Tools”
Grades Lab Report 80% Final Exam 20% • 100 – 85% A • 84 – 75% B • 74 – 60% C • 59 – 50% D • 49 – 0% F
Policy on Collaboration You can work in groups, but you must write your solution independently. Students who copy or allow people to copy your work will get zero.
Attendance, tardiness, cell phones, pagers, etc… You may be dropped from this class
If you are coming in late… Classes start on the clock Don’t slam the door and your backpack! Don’t disturb the others, be quiet Sign up on the “Black List” if you are late more than 10 minutes. Ten points deducted from your next homework.
Lab Report (every 1-2 weeks) Name, ID & Date Title Purpose Procedure Data Equations Mathematical calculations Sources of Error Conclusion
Name and Date Write your name on the top right hand corner Include the names of your group members if you worked in a group Write the date you performed the experiment NOT the date you write the lab report nor the date it is due
Title Include the title of the lab. You may choose an appropriate title if you wish.
Purpose A description of what the lab is about. In your own words. Do not copy and paste please.
Procedure • Step by step • No need to say “push button [D]…” • Instead say “use computer to measure velocity…” • Don’t say “take data” unless you say what the “data” is, e.g. velocity, voltage. • Tips: Include diagrams
Data This section must contain all the data you obtained in this experiment. You can present it in a table format. You can use the tables provided in your handout. Always include units and use scientific notation when convenient.
Equations and Calculations This section must contain equations and calculations you used. Please be clear and organized. Show your work. I don’t want to see just the final answer. If there are more than one trial, show work for just one of them.
Multiple Trials • If there are multiple trials, the calculations for each trial are almost exactly the same. • No need to write the calculations for every trial. • Do a sample calculation for one of the trials. Indicate which trial you are calculating, seeing that the calculations of one trial is correct, I will trust that you know how to do the rest.
Sources of Error No experiments are perfect Common errors: Friction, reaction time … Unacceptable sources of error: “I may have did the calculations wrong” “I was careless”
Conclusion Provide a summary of the experiment. Compare your results with the theoretical value, if applicable. Conclusion always has something to do with the purpose section. BE QUANTITATIVE!!!
Examples of Conclusions Acceptable “the measured value is within 4.7% of the accepted value”. “Newton’s Second Law is verified to within 3%”. quantitative Unacceptable “the measured value is pretty close to the accepted value”, or “Newton’s Second Law is correct” too vague
Questions Put your answers to the questions on the lab manuals after the conclusion section.
Staple EVERYTHING You lose points if you don’t staple your work together!!
Some (very) simple error analysis For those who are interested: http://www.upscale.utoronto.ca/PVB/Harrison/ErrorAnalysis/ http://www.ligo.caltech.edu/~vsanni/ph3/ You can download notes about data analysis from these sites.
Percentage difference Often one wants to compare two numbers, e.g. u=12.4 and v=13.1 by evaluating their percentage difference. Both are correct. Usually when we calculate percentage difference, the two numbers are very similar in value, so it does not matter which one we put in the denominator.
Some common mistakes The “%” sign is NOT optional, nor is the absolute value sign.
Too many digits Mean (average) Repeated measurements: Common mistake: Usually, the mean has only slightly better precision, so keep to at most one higher significant figure. The mean above should be either 3.3 or 3.
Standard deviationσ The smaller the standard deviation, the more better are your data.
Example Find the σ of the following measurement of length x: 11.3cm, 11.7cm, 12.0cm, 11.8cm
Standard deviation 68% of probability lying within a width of 2σ.
Tips Although it is often not asked explicitly, it is usually a good idea to compute the standard deviation to see how far your data are apart from each other. You will get a better grade!
Linear plot Example: a = g sinθ Plot a vs sinθ. The slope will give g.