Download
1 / 68
680 likes | 845 Views
The Suppression of Toll Like receptors (TLR) by Insulin. Presenters : Huma Younus Faisal R. Khan Mentor: P aresh D andona , M.B.B.S., Ph.D., F.R.C.P, F.A.C.P, F.A.C.C Chief of Endocrinology, SUNY at Buffalo. Fast Facts … Diabetes Mellitus. Diabetes affects 25.8 million people of all ages

E N D
The Suppression of Toll Like receptors (TLR) by Insulin Presenters: HumaYounus Faisal R. Khan Mentor: PareshDandona, M.B.B.S., Ph.D., F.R.C.P, F.A.C.P, F.A.C.C Chief of Endocrinology, SUNY at Buffalo
Fast Facts … Diabetes Mellitus • Diabetes affects 25.8 million people of all ages • 8.3 percent of the U.S. population • DIAGNOSED18.8 million people • UNDIAGNOSED7.0 million people
Clinical Question • Type 2 Diabetes is caused by Insulin resistance at cellular level… • How does that happen (basic mechanism) ? • What pathways are involved? • Is there a way to reverse it?
Mechanism of Insulin Resistance ... Role of Innate Immune System
Background.. INNATE IMMUNE SYSTEM Consists of germline defense mechanisms that are directed against molecular components found only in microorganisms The cardinal signs of inflammation i.e. tumor, rubor, calor, and dolor are products of the innate immune response
Functions Of The Innate Immune System Detection of microorganisms and first-line defense against invasion and infection. Activation and instruction of adaptive immune responses. Regulation of inflammation. Maintenance of “immunologic homeostasis” within the host.
Components of Innate Immune system • Three Main components: • 1). Pathogen-Associated Molecular Patterns (PAMPs): Various molecules that activate the innate immune system. • 2). Pattern Recognition Receptors(PRRs): Recognize PAMPs( LPS etc.) and initiate the inflammatory pathways. • 3). Inflammatory cytokines.
Pathogen-Associated Molecular Patterns (PAMPs) • A prototypical PAMP is bacterial endotoxin, or lipopolysaccharide (LPS), which is a component of the outer membrane of all gram-negative bacteria. • Endotoxins contain Lipid A which interacts with the toll-like receptors (PRRs).
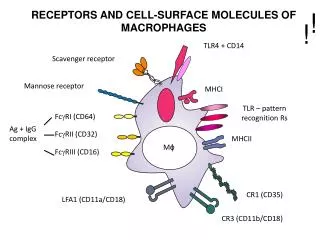
Innate immune system recognizes microbes through PRRs also known as pathogen recognition receptors. Expressed constitutively on many types of innate immune cells and on the professional antigen presenting cells (macrophages, dendritic cells, monocytes, and B lymphocytes). Include TLRs, NLRs, RLRs. Pattern Recognition Receptors (PRRs)
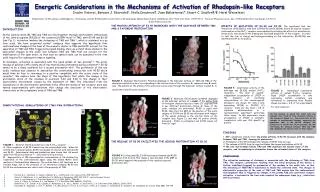
Toll Like Receptors • Structure. • Distribution. • Types.
Structure of TLRs • All TLRs have: • An extracellular ligand recognition and binding domain. • A single trans-membrane domain • The cytoplasmic (signaling) domain is homologous to the interleukin-1 . • Variations in TLR ligands initiate specific immunological responses
Cellular Distribution of TLRs • Toll like receptors (TLR) are located on macrophages, monocytes, neutrophils, dendritic cells, mast cells, mucosal epithelial cells and endothelial cells, all of which are the mediators of innate immunity.
TLR 2 • TLR2 is a cell surface receptor. • Recognizes certain lipid moieties derived from bacteria such as bacterial lipoproteins and peptidoglycans. • TLR2 might play a role in ischemia-reperfusion induced myocardial injury.
TLR 4 • Similar to TLR 2 in distribution and activation. • TLR4 has also been shown to play an important role in atherogenesis and diet-induced obesity and related insulin resistance
TLR7 and TLR9 are endosomic receptors, that recognizes single stranded viral RNA (ssRNA) and microbial DNA, respectively. • Therefore, TLR7 and TLR9 modulate adaptive immune responses including autoimmunity against chromatin, e.g., in systemic lupus erythematosus (SLE) TLR 7 & 9
Pathways involved and role of Toll Like Receptors in inflammatory cascade..
Activation of TLR signaling • Activated by PAMPS. • Cause transcriptional activation of genes encoding for pro-inflammatory cytokines, chemokines etc. • Result in activation of antigen-specific adaptive immune response
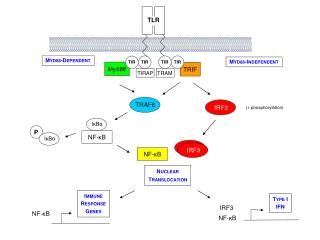
TLR Organization and signaling pathways • IL-1 receptor associated kinases 1 and 4 (IRAK1, IRAK4). • Tumor necrosis factor receptor associated factor 6. TRAF 6 • Transforming growth factor beta activated protein kinase 1 (TAK1) • Mitogen activated protein kinases (MAPKs).
signaling pathways • All TLRs except TLR3 utilize myeloid differentiation primary response protein 88 (MyD88). • MyD88 adapter connects with various molecules including IRAK, TRAF6, TAK. • This complex kinase cascade culminates in activation of broad array of genes influencing cell survival, activation, and proliferation through AP-1 and NF-kappa B
Roll of TLRs in Inflammation, Atherosclerosis and IR • Plasma concentration of LPS is significantly increased in obese patients and is significantly related to plasma insulin concentration and HOMA-IR index of insulin resistance, showing a link between LPS concentration and insulin resistance. • Human atherosclerotic plaques contain endothelial cells and macrophages expressing TLR1/2 and TLR4. • High LPS concentrations can potentially lead to TLR activation and induction of inflammation leading to insulin resistance.
Although the physiological reason for the presence of these receptors is to recognize pathogens and to trigger immune mechanisms, their over stimulation or abnormal responses could easily mediate processes which could lead to chronic or auto-immune inflammation. Roll of TLRs in Inflammation, Atherosclerosis and IR
Early 18th century • High doses of sodium salicylate (5.0–7.5 g/d) were first demonstrated to diminish glycosuria in diabetic patients having “the milder form of the disease,” presumably type 2 diabetes. • 1876 Ebstein concluded that sodium salicylate could make the symptoms of diabetes mellitus totally disappear. (1, 3).
Historical background • 1957 Reid and colleagues found • Insulin-treated diabetic, given high-dose aspirin to treat the arthritis no longer required daily insulin injections(4). • Upon resolution of the joint symptoms, aspirin was discontinued, and a repeat glucose tolerance test was grossly abnormal.
More recently • Increased levels of markers and mediators of inflammation and acute-phase reactants such as fibrinogen, C-reactive protein (CRP), IL-6, plasminogen activator inhibitor-1 (PAI-1), sialic acid, and white cell count correlate with incident T2D. • Adipose tissue–derived proinflammatory cytokines such as TNF-α could actually cause insulin resistance in experimental models.
Other Observations • TNF-α, IL-6, MCP-1 etc produced by adipose tissue as well as by mononuclear cells(MNC). • So Adipose tissue and MNC are the key cells involved in producing the inflammatory cytokines and inducing insulin resistance….
. Obesity-induced chronic inflammation is a key component in the pathogenesis of Insulin resistance. Pro-inflammatory cytokines can cause insulin resistance (IR) in adipose tissue, skeletal muscle and liver by inhibiting insulin signal transduction. Positive correlation between BMI and plasma TNFα concentrations. However, the exact mechanism is still poorly understood Factors and Mechanism of Obesity induced DM2 --The “Inflammation Hypothesis”
Pathways… overview • Two major pathways • JNK and IKKβ pathways, involving cytokines and TLRs.
Stimuli that have been shown to activate these pathways during metabolic dysregulation include ligands for TNF-α, IL-1, Toll, or AGE receptors (TNFR, IL-1R, TLR, or RAGE, respectively). Obesity-induced IKKβ activation leads to NF-κB translocation and the increased expression of numerous markers and potential mediators of inflammation that can cause insulin resistance. Obesity-induced JNK activation promotes the phosphorylation of IRS-1 at serine sites that negatively regulate normal signaling through the insulin receptor/IRS-1 axis. Examples include serine-302 (pS302) and serine-307 (pS307).
Hypothesis • First controlled trial to investigate the effect of insulin on the expression of TLR in the peripheral blood mononuclear cells (MNC) and adipose tissue of obese and Type 2 diabetes mellitus subjects. • The central hypothesis of this application was that insulin will suppress the expression of TLR2, TLR4, TLR7 and TLR9 at the mRNA and protein levels in MNC and adipose tissue of obese and type 2 diabetic subjects.
Thank You.. Please stay tuned for the second part of presentation…
Challenges • What came first ? Obesity or Diabetes (chicken or egg)? • Prove that obesity induces resistance. • Why do Type 2 diabetics improve with insulin if they are not deficient in it??? • Why do they require huge amounts of insulin?? • When should Insulin be started?? Should we wait for their pancreas to totally fail before we do it? • Why Why Why………. Why did I even take this project!!
Study Design • Double blinded, cross-over and controlled prospective study. • A total of 60 subjects divided into 20 lean, 20 obese and 20 obese type 2 diabetic (DM) subjects were enrolled. • Fasting blood samples and fat biopsies were collected from all subjects to compare basal TLR expression between the groups.
Experimental Method • Insulin/dextrose/potassium regimen at 3 different doses of insulin (2, 3.5 and 5 U/hr) were given to obese and diabetic subjects in the experimental arm followed by the control arm where 3 infusions with dextrose/potassium regimen only in quantities similar to those infused with each of the 3 insulin doses and a normal physiological saline infusion was given. • Dextrose infusion rate was titrated to maintain blood glucose concentration at target levels within 10mg of the baseline glucose concentration (usually 80-120 mg/dl).
Experimental Method • Potassium Chloride was co-infused to prevent hypokalemia and was monitored every 2 hourly during all insulin infusions. • Blood samples (30 ml/time point for a total of 210 ml/visit) were drawn at Baseline, 2, 4, 8 and 14 hours following the start of the infusions. • Fat biopsy samples were taken at three separate visits, for a total of six fat biopsies one in the fasting stage and one at 12 hours.
Inclusion Criteria • Lean Group:1)Age: 20 to 65 years 2) Sex: male or female 3)Normal fasting plasma glucose (65-100 mg/dl), 4)Normal BMI (20-25). • Obese Group:1)Age: 20 to 65 years 2) Sex: male or female 3)Normal fasting plasma glucose (65-100 mg/dl), 4)BMI> 30. • DM Group: 1)Type 2 Diabetes Mellitus 2)Age: 20 to 65 years 3)Sex: male or female 4)BMI >30 5)Hba1c < 8% 6)If on statins, angiotensin converting enzyme inhibitor, angiotensin receptor blocker or low dose aspirin, should be on a stable dose for one month.
EXCLUSION CRITERIA • Pregnancy • Congestive heart failure. • Heart Rate <50 beats /minute , Sick Sinus Syndrome , Second or third degree heart block. • Blood pressure <80 mm systolic or > 160/100 mmHg • Coronary event or procedure (myocardial infarction, unstable angina, coronary artery bypass surgery or coronary angioplasty) in the previous three months 8)Hepatic disease (transaminase > 3 times normal) • Renal impairment (serum creatinine > 1.5)
EXCLUSION CRITERIA • Participation in any other concurrent clinical trial • Potassium (K+) values <3.5 meq/l to > 5.5 meq/l) • Use of an investigational agent or therapeutic regimen within 30 days of study • Type 2 diabetics on thiazolidinediones and/ or insulin • Subjects on steroids, NSAIDS or antioxidants • Patients taking exenatide or sitaglipin or loop diuretics. • Anemia (Hemoglobin level less than 12gm/dl in females and 13gm/dl in males). • Any other life-threatening, non-cardiac disease.
Laboratory Procedures • MNC isolation by Ficoll-hypaque method. This method provides yields greater than 95% pure PMN and MNC suspensions. • Quantification of TLRs (2, 4, 7 and 9) mRNA in MNC and adipose tissue by RT-PCR.
Results: 1 What came first….. Prove obesity causes insulin resistance…. TLR expression in Obese as compared to lean subjects.
TLR expression in adipose tissue from lean and obese subjects • Fat aspiration was performed lean BMI: 22.8±1.9 and obese BMI: 35.6±5.1 subjects following an overnight fast. • The mRNA expression of TLR2, TLR4, TLR7 and TLR9 were measured by real time RT-PCR. • There were no significant statistical differences in baseline characteristics between the two groups.
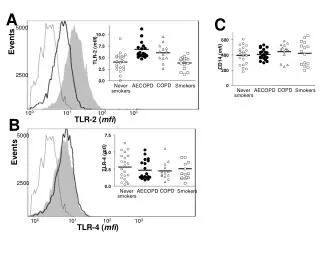
A B TLRs in adipose tissue from obese and lean subjects. A) TLR2, TLR4, TLR7 and TLR9 mRNA expression in Adipose tissue of obese and lean subjects. B) TLR-2 protein expression in adipose tissue from obese and lean subjects (n=8 vs. 8) *= P<0.05, t-test.
Results: 2 What happens to TLRs after a high fat high carbohydrate(HFHC) meal in lean subjects.
Effect of high fat high carbohydrate (HFHC) meal on TLR4 expression and plasma endotoxin concentrations • Four groups (10-12 each) of healthy lean subjects were given either 300 Calories of glucose, 300 Calories of dairy cream, 900 Calories HFHC meal or water to ingest following an overnight fast.
TLR4 mRNA (A) and protein (B) expression in MNC following glucose, cream and meal intake compared to water intake in normal healthy subjects. *= P<0.05 by RMANOVA compared to baseline following cream challenge; #= P<0.05 by two-way ANOVA comparing cream and water groups; += P<0.05 by RMANOVA compared to baseline following meal challenge and $=P<0.05 by two-way ANOVA comparing meal and water groups.
Percent change in Plasma Endotoxin concentrations following glucose, cream and meal intake compared to water intake in normal healthy subjects. *= P<0.05 by RMANOVA compared to baseline following cream challenge; #= P<0.05 by two-way ANOVA comparing cream and water groups
Inferences • There is an acute elevation of plasma endotoxin levels following a high fat and/or high carbohydrate (HFHC) meal. • There is increased expression of TLR mRNA and proteins following HFHC meal. • Since TLR are activated by endotoxins, elevated endotoxin levels can stimulate TLRs and initiate an inflammatory response.