Download
1 / 1
10 likes | 108 Views
How to prevent the interference of ship itself exhaust emissions when measurement air pollutants over the South China Sea during 2010 Yung-Yao Lan (1) , Ben-Jei Tsuang (1) , Yu Chi Lin (2) , Mao-Lin Shen (3) , and Sheng Fong Lin (4)

E N D
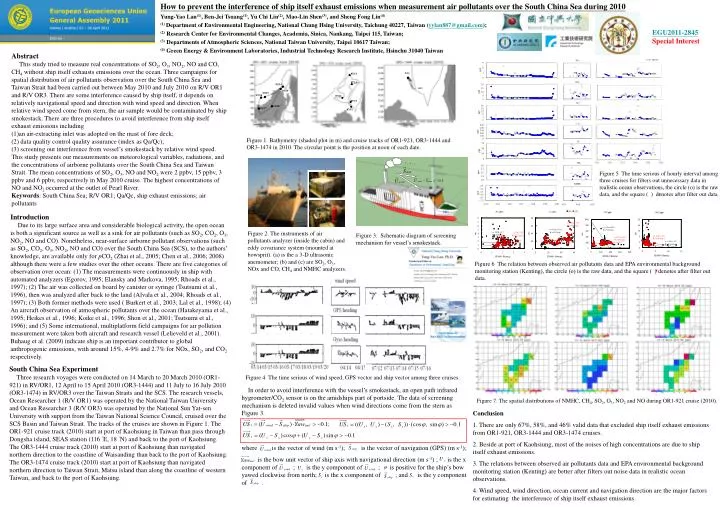
How to prevent the interference of ship itself exhaust emissions when measurement air pollutants over the South China Sea during 2010 Yung-Yao Lan(1), Ben-Jei Tsuang(1), Yu Chi Lin(2), Mao-Lin Shen(3), and Sheng Fong Lin(4) (1) Department of Environmental Engineering, National Chung Hsing University, Taichung 40227, Taiwan (yylan887@gmail.com); (2) Research Center for Environmental Changes, Academia, Sinica, Nankang, Taipei 115, Taiwan; (3) Departments of Atmospheric Sciences, National Taiwan University, Taipei 10617 Taiwan; (4) Green Energy & Environment Laboratories, Industrial Technology Research Institute, Hsinchu 31040 Taiwan EGU2011-2845Special Interest Abstract This study tried to measure real concentrations of SO2, O3, NO2, NO and CO, CH4 without ship itself exhausts emissions over the ocean. Three campaigns for spatial distribution of air pollutants observation over the South China Sea and Taiwan Strait had been carried out between May 2010 and July 2010 on R/V OR1 and R/V OR3. There are some interference caused by ship itself, it depends on relatively navigational speed and direction with wind speed and direction. When relative wind speed come from stern, the air sample would be contaminated by ship smokestack. There are three procedures to avoid interference from ship itself exhaust emissions including (1)an air-extracting inlet was adopted on the mast of fore deck; (2) data quality control quality assurance (index as Qa/Qc); (3) screening out interference from vessel’s smokestack by relative wind speed. This study presents our measurements on meteorological variables, radiations, and the concentrations of airborne pollutants over the South China Sea and Taiwan Strait. The mean concentrations of SO2, O3, NO and NO2 were 2 ppbv, 15 ppbv, 3 ppbv and 6 ppbv, respectively in May 2010 cruise. The highest concentrations of NO and NO2 occurred at the outlet of Pearl River. Keywords: South China Sea; R/V OR1; Qa/Qc, ship exhaust emissions; air pollutants Figure 1 Bathymetry (shaded plot in m) and cruise tracks of OR1-921, OR3-1444 and OR3-1474 in 2010. The circular point is the position at noon of each date. Figure 5 The time serious of hourly interval among three cruises for filters out unnecessary data in realistic ocean observations, the circle (ο) is the raw data, and the square ( ) denotes after filter out data. Introduction Due to its large surface area and considerable biological activity, the open ocean is both a significant source as well as a sink for air pollutants (such as SO2, CO2, O3, NO2, NO and CO). Nonetheless, near-surface airborne pollutant observations (such as SO2, CO2, O3, NO2, NO and CO) over the South China Sea (SCS), to the authors’ knowledge, are available only for pCO2 (Zhai et al., 2005; Chen et al., 2006; 2008) although there were a few studies over the other oceans. There are five categories of observation over ocean: (1) The measurements were continuously in ship with automated analyzers (Egorov, 1995; Elansky and Markova, 1995; Rhoads et al., 1997); (2) The air was collected on board by canister or syringe (Tsutsumi et al., 1996), then was analyzed after back to the land (Alvala et al., 2004; Rhoads et al., 1997); (3) Both former methods were used ( Burkert et al., 2003; Lal et al., 1998); (4) An aircraft observation of atmospheric pollutants over the ocean (Hatakeyama et al., 1995; Heikes et al., 1996; Koike et al., 1996; Shon et al., 2001; Tsutsumi et al., 1996); and (5) Some international, multiplatform field campaigns for air pollution measurement were taken both aircraft and research vessel (Lelieveld et al., 2001). Buhaug et al. (2009) indicate ship is an important contributor to global anthropogenic emissions, with around 15%, 4-9% and 2.7% for NOx, SO2, and CO2 respectively. Figure 2. The instruments of air pollutants analyzer (inside the cabin) and eddy covariance system (mounted at bowsprit). (a) is the a 3-D ultrasonic anemometer; (b) and (c) are SO2, O3, NOx and CO, CH4 and NMHC analyzers. Figure 3. Schematic diagram of screening mechanism for vessel’s smokestack. Figure 6 The relation between observed air pollutants data and EPA environmental background monitoring station (Kenting), the circle (ο) is the raw data, and the square ( ) denotes after filter out data. South China Sea Experiment Three research voyages were conducted on 14 March to 20 March 2010 (OR1-921) in RV/OR1, 12 April to 15 April 2010 (OR3-1444) and 11 July to 16 July 2010 (OR3-1474) in RV/OR3 over the Taiwan Straits and the SCS. The research vessels, Ocean Researcher 1 (R/V OR1) was operated by the National Taiwan University and Ocean Researcher 3 (R/V OR3) was operated by the National Sun Yat-sen University with support from the Taiwan National Science Council, cruised over the SCS Basin and Taiwan Strait. The tracks of the cruises are shown in Figure 1. The OR1-921 cruise track (2010) start at port of Kaohsiung in Taiwan than pass through Dongsha island, SEAS station (116 °E, 18 °N) and back to the port of Kaohsiung. The OR3-1444 cruise track (2010) start at port of Kaohsiung than navigated northern direction to the coastline of Waisanding than back to the port of Kaohsiung. The OR3-1474 cruise track (2010) start at port of Kaohsiung than navigated northern direction to Taiwan Strait, Matsu island than along the coastline of western Taiwan, and back to the port of Kaohsiung. Figure 4 The time serious of wind speed, GPS vector and ship vector among three cruises. In order to avoid interference with the vessel’s smokestack, an open path infrared hygrometer/CO2 sensor is on the amidships part of portside. The data of screening mechanism is deleted invalid values when wind directions come from the stern as Figure 3. where is the vector of wind (m s-1); is the vector of navigation (GPS) (m s-1); is the bow unit vector of ship axis with navigational direction (m s-1) ; is the x component of ; is the y component of ; is positive for the ship’s bow yawed clockwise from north; is the x component of ; and is the y component of . Figure 7. The spatial distributions of NMHC, CH4, SO2, O3, NO2 and NO during OR1-921 cruise (2010). Conclusion 1. There are only 67%, 58%, and 46% valid data that excluded ship itself exhaust emissions from OR1-921, OR3-1444 and OR3-1474 cruises. 2. Beside at port of Kaohsiung, most of the noises of high concentrations are due to ship itself exhaust emissions. 3. The relations between observed air pollutants data and EPA environmental background monitoring station (Kenting) are better after filters out noise data in realistic ocean observations. 4. Wind speed, wind direction, ocean current and navigation direction are the major factors for estimating the interference of ship itself exhaust emissions.