Download
1 / 68
690 likes | 833 Views
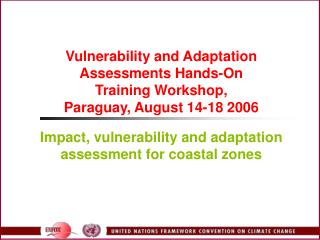
Vulnerability and Adaptation Assessments Hands-On Training Workshop Impact, Vulnerability and Adaptation Assessment for the Agriculture Sector – Part 2. Asunción Paraguay. August 14-18, 2006. Graciela O. Magrin INTA-Instituto de Clima y Agua (Argentina). FAOCLIM.

E N D
Vulnerability and Adaptation Assessments Hands-On Training WorkshopImpact, Vulnerability and Adaptation Assessmentfor the Agriculture Sector – Part 2 Asunción Paraguay. August 14-18, 2006 Graciela O. Magrin INTA-Instituto de Clima y Agua (Argentina)
Precipitation Annual 1901-1995 Source of data: NOAA, NCDC
Eva et al., 2004 Global Land Cover Classification De Fries et al., 1998 7: Wooded grasslands/shrubs 8: Closed bushlands or shrublands 9: Open shrublands 10: Grasses 11: Croplands 12: Bare 13: Mosses and lichens 1: Evergreen needle leaf forests 2: Evergreen broad leaf forests 3: Deciduous needle leaf forests 4: Deciduous broad leaf forests 5: Mixed forests 6: Woodlands
Lights are Related to Income and Population Map of the night-time city lights of the world DMSP: NASA and NOAA
The projected change in annual temperature and precipitation for the 2050s compared to the present day, for two GCMs, when the climate models are driven with an increase in greenhouse gas concentrations defined by the IPCC “business-as-usual” scenario.
International Consortium for Agricultural Systems Applications Practical Applications: DSSAT • Question: What components of the farming system are particularly vulnerable, and may thus require special attention? – crop models (e.g., DSSAT) http://www.icasanet.org/ http://www.clac.edu.eg
Practical Applications: DSSAT • Overview and previous examples of use • Guided use of model (three practical applications to be done by the participants)
Input Requirements • Weather: Daily precipitation, maximum and minimum temperatures, solar radiation • Soil: Soil texture and soil water measurements • Management: planting date, variety, row spacing, irrigation and N fertilizer amounts and dates, if any • Crop data: dates of anthesis and maturity, biomass and yield, measurements on growth and Leaf Area Index (LAI)
Wheat: 23 sites (m.e.: 10%) Soybean: 16 sites (m.e.: 10.9% Maize: 11 sites ( m.e.: 7.8% Crop Model Validation Travasso & Magrin, 2001
Examples • Can optimal management be an adaptation option for maize production in Argentina? • Can adaptation be achieved by optimizing crop varieties? • Can changes of crop mix be an adaptation option?
Can Optimal Management be an Adaptation Option for Maize Production in Argentina? Source Argentina 2º National communication
Adaptation: Argentina Adaptation strategies in two locations of Argentina Increased inputs and improve management: • Planting date • Fertilizer • Irrigation Travasso et al., 2006
P1 P2 P5 G2 G5 . Juvenile phase (growing degree days base 8°C from emergence to end of the juvenile phase) . Photoperiod sensitivity . Grain filling duration (growing degree days base 8 from silking to physiological maturity) . Potential kernel number . Potential kernel weight (growth rate) Can Adaptation be Achieved by Optimizing Crop Varieties? Crop Coefficients Corn
Optimizing crop varieties Maize >P1 Juvenile phase Wheat >P1D photoperiodic sensitivity
Practical Applications • Effect of management (nitrogen and irrigation) in wet and dry sites • Effect of climate change on wet and dry sites • Sensitivity analysis to changes in temperature and precipitation (thresholds) and CO2 levels • Adaptation: Changes in management to improve yield under climate change
Application 1. Management • Objective: Getting started
Input Files Needed • Weather • Soils • Cultivars • Management files (*.MZX files) description of the experiment
Examine the Data Files . . . Weather file Soil file Genotype file (Definition of cultivars)
Examine the Weather Files . . . Weather file
. . . The Experiment File Can Be Edited Also With a Text Editor (Notepad)
Exp 2. Sensitivity to Climate • Objective: Effect of weather modification