Download
1 / 43
430 likes | 544 Views
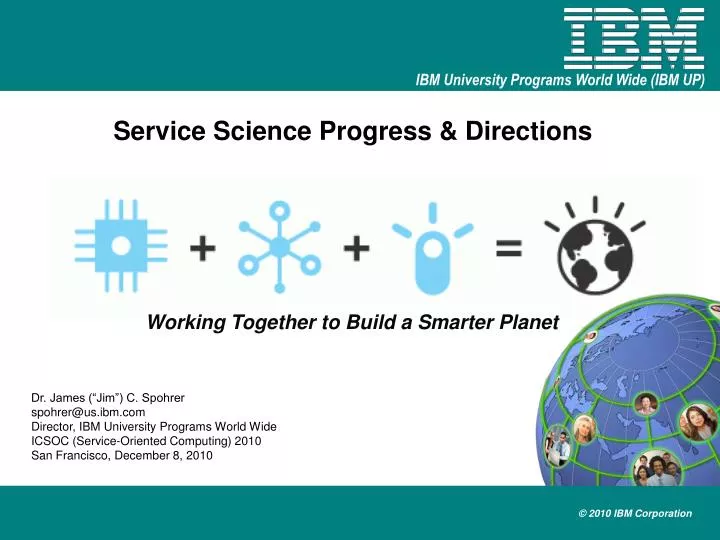
Service Science Progress & Directions. Working Together to Build a Smarter Planet. Dr. James (“Jim”) C. Spohrer spohrer@us.ibm.com Director, IBM University Programs World Wide ICSOC (Service-Oriented Computing) 2010 San Francisco, December 8, 2010. ICSOC 2010. Outline.

E N D
Service Science Progress & Directions Working Together to Build a Smarter Planet Dr. James (“Jim”) C. Spohrer spohrer@us.ibm.com Director, IBM University Programs World Wide ICSOC (Service-Oriented Computing) 2010 San Francisco, December 8, 2010
Outline • Stimulus:Service Growth • The World • IBM • Response:Service Science Priorities • Cambridge University Report • Arizona State University Report • World View:Networks of Entities Interacting • Service Dominant Logic (Vargo & Lusch) • Service Science (Spohrer & Maglio) • Service Network Theory (Gummesson) • Evolution:Service Science for a Smarter Planet • What is Smarter Planet? • What improves Quality-of-Life? • What is a Service System? Service Science? • How to visualize Service Science? • What’s the Skills Goal? • Where are the Opportunities? • Where is the “Real Science” in Service Science? • What are Holistic Service Systems? • Why are they so important for accelerating innovation?
Service Growth: The World World’s Large Labor Forces A = Agriculture, G = Goods, S = Service US shift to service jobs 2010 2010 (A) Agriculture: Value from harvesting nature Nation Labor % WW A % G % S % 40yr Service Growth China 25.7 49 22 29 142% India 14.4 60 17 23 35% (G) Goods: Value from making products U.S. 5.1 1 23 76 23% Indonesia 3.5 45 16 39 34% (S) Service: Value from IT augmented workers in smarter systems that create benefits for customers and sustainably improve quality of life. Brazil 3.0 20 14 66 61% Russia 2.4 10 21 69 64% Japan 2.2 5 28 67 45% Nigeria 1.6 70 10 20 19% Bangladesh 2.1 63 11 26 37% Germany 1.4 3 33 64 42% CIA Handbook, International Labor Organization Note: Pakistan, Vietnam, and Mexico now larger LF than Germany
Service Growth: IBM Revenue Growth by Segment What do IBM Service Professionals Do? Run things on behalf of customers, help Transform customers to adopt best practices, and Innovate with customers. B2B Service Projects: IT (data center, call centers) & business process outsourcing/reengineering, systems integration, organizational change, etc.
Priorities: Succeeding through Service Innovation - A Framework for Progress (http://www.ifm.eng.cam.ac.uk/ssme/) Source: Workshop and Global Survey of Service Research Leaders (IfM & IBM 2008) 1. Emerging demand 5. Call for actions 2. Define the domain 3. Vision and gaps 4. Bridge the gaps Service Innovation Growth in service GDP and jobs Service quality & productivity Environmental friendly & sustainable Urbanisation & aging population Globalisation & technology drivers Opportunities for businesses, governments and individuals Service Systems Customer-provider interactions that enable value cocreation Dynamic configurations of resources: people, technologies, organisations and information Increasing scale, complexity and connectedness of service systems B2B, B2C, C2C, B2G, G2C, G2G service networks Stakeholder Priorities Education Research Business Government The white paper offers a starting point to - Service Science To discover the underlying principles of complex service systems Systematically create, scale and improve systems Foundations laid by existing disciplines Progress in academic studies and practical tools Gaps in knowledge and skills Develop programmes & qualifications Skills & Mindset Encourage an interdisciplinary approach Knowledge & Tools Develop and improve service innovation roadmaps, leading to a doubling of investment in service education and research by 2015 Employment & Collaboration Policies & Investment Glossary of definitions, history and outlook of service research, global trends, and ongoing debate
Pervasive Force: Leveraging Technology to Advance Service Strategy Priorities Development Priorities Execution Priorities Stimulating Service Innovation Fostering Service Infusion and Growth Effectively Branding and Selling Services Enhancing Service Design Improving Well-Being through Transformative Service Enhancing the Service Experience through Cocreation Creating and Maintaining a Service Culture Optimizing Service Networks and Value Chains Measuring and Optimizing the Value of Service Priorities: Research Framework for the Science of Service Source: Global Survey of Service Research Leaders (Ostrom et al 2010)
Value Configuration Density Resource Integrator/Beneficiary Resource Integrator/Beneficiary (“Firm”) (“Customer”) Value Co-creation Service-Dominant Logic (Vargo & Lusch) • Service is the application of competences for the benefit of another entity • Serviceis exchanged for service • Value is always co-created • Goods are appliances for delivery • Alleconomies are service economies • All businesses are service businesses
Nation State/Province City/Region Other Enterprises (job roles) Educational Institution Healthcare Institution Family (household) Person (professional) Service Science (Spohrer & Maglio) • Service system entities dynamically configure (transform) four types of resources • Service system entities calculate value from multiple stakeholder perspectives • Service system entities reconfigure access rights to resources by mutually agreed to value propositions
SSE SSE SSE SSE SSE SSE SSE SSE SSE SSE F F F F F F F F F F Front-Stage Marketing/Customer Focus Based on Levitt, T (1972) Production-line approach to service. HBR. “Everybody is in service... Something is wrong… The industrial world has changed faster than our taxonomies.”. B B B B B B B B B B e.g., Citibank F F F Product-Service-System Service System Entity Product Business Service Business F B B B B e.g., IBM Back-Stage Operations/Provider Focus Service Network Theory (Gummesson)
CUSTOMERS MANUFACTURING WORKFORCE TRANSPORTATION SUPPLY CHAIN FACILITIES Evolution: Service Science for a Smarter PlanetWhat is Smarter Planet? Harmonized smarter systems. INSTRUMENTED We now have the ability to measure, sense and see the exact condition of practically everything. INTERCONNECTED People, systems and objects can communicate and interact with each other in entirely new ways. INTELLIGENT We can respond to changes quickly and accurately, and get better results by predicting and optimizing for future events. IT
Our planet is a complex, dynamic, highly interconnected $54 Trillion system-of-systems (OECD-based analysis) Our planet is a complex system-of-systems Transportation $ 6.95 Tn Communication $ 3.96 Tn This chart shows ‘systems‘ (not ‘industries‘) Education $ 1.36 Tn Water $ 0.13 Tn Leisure / Recreation / Clothing $ 7.80 Tn Electricity $ 2.94 Tn Global system-of-systems $54 Trillion (100% of WW 2008 GDP) Healthcare $ 4.27 Tn Infrastructure $ 12.54 Tn Legend for system inputs Same IndustryBusiness SupportIT SystemsEnergy ResourcesMachineryMaterials Trade Note: 1. Size of bubbles represents systems’ economic values 2. Arrows represent the strength of systems’ interaction 1 Tn Govt. & Safety$ 5.21 Tn Finance $ 4.58 Tn Food $ 4.89 Tn Source: IBV analysis based on OECD
This chart shows ‘systems‘ (not ‘industries‘) Analysis of inefficiencies in the planet‘s system-of-systems Healthcare 4,270 Building & Transport Infrastructure12,540 34% Education 1,360 Financial4,580 42% Electricity2,940 Improvement potential as % of system inefficiency Food & Water4,890 Communication3,960 Government & Safety 5,210 Transportation (Goods & Passenger)6,950 Leisure / Recreation / Clothing7,800 Note: Size of the bubble indicate absolute value of the system in USD Billions System inefficiency as % of total economic value We now have the capabilities to manage a system-of-systems planet Economists estimate, that all systems carry inefficiencies of up to $15 Tn, of which $4 Tn could be eliminated How to read the chart: For example, the Healthcare system‘s value is $4,270B. It carries an estimated inefficiency of 42%. From that level of 42% inefficiency, economists estimate that ~34% can be eliminated (= 34% x 42%). Source: IBM economists survey 2009; n= 480
What improves Quality-of-Life? Service System Innovations 20/10/10 * = US Labor % in 2009. 2/7/4 A. Systems that focus on flow of things that humans need (~15%*) 1. Transportation & supply chain 2. Water & waste recycling/Climate & Environment 3. Food & products manufacturing 4. Energy & electricity grid/Clean Tech 5. Information and Communication Technologies (ICT access) B. Systems that focus on human activity and development (~70%*) 6. Buildings & construction (smart spaces) (5%*) 7. Retail & hospitality/Media & entertainment/Tourism & sports (23%*) 8. Banking & finance/Business & consulting (wealthy) (21%*) 9. Healthcare & family life (healthy) (10%*) 10. Education & work life/Professions & entrepreneurship (wise) (9%*) C. Systems that focus on human governance - security and opportunity (~15%*) 11. Cities & security for families and professionals (property tax) 12. States/regions & commercial development opportunities/investments (sales tax) 13. Nations/NGOs & citizens rights/rules/incentives/policies/laws (income tax) 2/1/1 7/6/1 1/1/0 5/17/27 1/0/2 24/24/1 2/20/24 7/10/3 5/2/2 3/3/1 0/0/0 1/2/2 0/19/0 Quality of Life = Quality of Service + Quality of Jobs + Quality of Investment-Opportunities “61 Service Design 2010 (Japan) / 75 Service Marketing 2010 (Portugal)/78 Service-Oriented Computing 2010 (US)”
NAE’s Engineering Grand Challenges A. Systems that focus on flow of things humans need 1. Transportation & Supply Chain Restore and enhance urban infrastructure 2. Water & Waste/Climate & Green tech Provide access to clear water 3. Food & Products Manager nitrogen cycle 4. Energy & Electricity Make solar energy economical Provide energy from fusion Develop carbon sequestration methods 5. Information & Communication Technology Enhance virtual reality Secure cyberspace Reverse engineer the brain B. Systems that focus on human activity & development 6. Buildings & Construction (smart spaces) Restore and enhance urban infrastructure 7. Retail & Hospitality/Media & Entertainment (tourism) Enhance virtual reality 8. Banking & Finance/Business & Consulting 9. Healthcare & Family Life Advance health informatics Engineer better medicines Reverse engineer the brain 10. Education & Work Life/Jobs & Entrepreneurship Advance personalized learning Engineer the tools of scientific discovery C. Systems that focus on human governance 11. City & Security Restore and improve urban infrastructure Secure cyberspace Prevent nuclear terror 12. State/Region & Development 13. Nation & Rights
What is a Service System? What is Service Science? …customers just name <your favorite provider>…researchers just name <your favorite discipline> Design/ Cognitive Science Systems Engineering “service science is the interdisciplinary study of service systems & value-cocreation” “a service system is a human-made system to improve customer-provider interactions, or value-cocreation between stakeholders” Marketing Computer Science/ Artificial Intelligence Operations Economics & Law
Systems that govern Systems that focus on flows of things Systems that support people’s activities transportation & supply chain ICT & cloud retail & hospitality healthcare & family city secure food & products education &work state scale nation laws energy & electricity water & waste building & construction banking & finance behavioral sciences People Technology Information Organizations Customer Provider Authority Competitors resources stakeholders e.g., marketing management sciences Starting Point 1: The Stackholders (As-Is) e.g., operations political sciences e.g., public policy learning sciences e.g., game theory and strategy cognitive sciences e.g., psychology system sciences Starting Point 2: Their Resources (As-Is) e.g., industrial eng. information sciences e.g., computer sci organization sciences e.g., knowledge mgmt social sciences History (Data Analytics) Future (Roadmap) change Change Potential: Thinking (Has-Been & Might-Become) e.g., econ & law decision sciences e.g., stats & design run professions Run Transform (Copy) Innovate (Invent) e.g., knowledge worker value Value Realization: Doing (To-Be) transform professions e.g., consultant innovate professions e.g., entrepreneur systems How to visualize service science? The Systems-Disciplines Matrix disciplines
Many team-oriented service projects completed (resume: outcomes, accomplishments & awards) Many disciplines (understanding & communications) Many systems (understanding & communications) Deep in one discipline (analytic thinking & problem solving) Deep in one system (analytic thinking & problem solving) What is the skills goal? T-Shaped professionals, ready for T-eamwork! SSME+D = Service Science, Management, Engineering + Design
14B Big Bang (Natural World) 10K Cities (Human-Made World) bees (social division-of-labor) transistor 60 200M Where is the “Real Science” in Service Science? In the sciences of the natural and human-made worlds… Evolving hierarchical-complexity of populations of things Time writing (symbols and scribes) ECOLOGY written laws money (coins) Sun Earth bacteria (uni-cell life) sponges (multi-cell life) universities clams (neurons) printing press (books) tribolites (brains) steam engine
Service System Ecology: Conceptual Framework • Resources: People, Technology, Information, Organizations • Stakeholders: Customers, Providers, Authorities, Competitors • Measures: Quality, Productivity, Compliance, Sustainable Innovation • Access Rights: Own, Lease, Shared, Privileged
Nation State/Province City/Region Luxury Resort Hotels University Hospital Family (household) Person (professional) Holistic Service Systems • Examples: Nations, States, Cities, Universities, Luxury Hotels, Cruise Ships, Households • Subsystems: Transportation, Water, Food, Energy, Communications, Buildings, Retail, Finance, Health, Education, Governance, etc. • Definition: A service system that can support its primary populations, independent of all external service systems, for some period of time, longer than a month if necessary, and in some cases, indefinitely • Balance independence with interdependence, without becoming overly dependent
Population Challenges Opportunities Careers Cities as Holistic Service Systems: All the systems A. Flow of things 1. Transportation: Traffic congestion; accidents and injury 2. Water: Access to clean water; waste disposal costs 3. Food: Safety of food supply; toxins in toys, products, etc. 4. Energy: Energy shortage, pollution 5. Information: Equitable access to info and comm resources B. Human activity & development 6. Buildings: Inefficient buildings, environmental stress (noise, etc.) 7. Retail: Access to recreational resources 8. Banking: Boom and bust business cycles, investment bubbles 9. Healthcare: Pandemic threats; cost of healthcare 10. Education: High school drop out rate; cost of education C. Governing 11. Cities: Security and tax burden 12. States: Infrastructure maintenance and tax burden 13. Nations: Justice system overburdened and tax burden Example: Singapore
Universities as Holistic Service Systems: All the systems A. Flow of things 1. Transportation: Traffic congestion; parking shortages. 2. Water: Access costs; reduce waste 3. Food: Safety; reduce waste. 4. Energy: Access costs; reduce waste 5. Information: Cost of keeping up best practices. B. Human activity & development 6. Buildings: Housing shortages; Inefficient buildings 7. Retail: Access and boundaries. Marketing. 8. Banking: Endowment growth; Cost controls 9. Healthcare: Pandemic threat. Operations. 10. Education: Cost of keeping up best practices.. C. Governing 11. Cities: Town & gown relationship. 12. States: Development partnerships.. 13. Nations: Compliance and alignment.
Luxury Hotels as Holistic Service Systems: All the systems http://www.youtube.com/watch?v=Hm7MeZlS5fo
Why Universities Matter: % GDP and % Top 500 Strong Correlation (2009 Data): National GDP and University Rankings http://www.upload-it.fr/files/1513639149/graph.html
Accelerating Innovation: Create Ideal or Reference Models CITIES/METRO REGIONS: Universities Key to Long-Term Economic Development UNIVERSITIES: Research Centers & Real-World Systems
Edu-Impact.Com “When we combined the impact of Harvard’s direct spending on payroll, purchasing and construction – the indirect impact of University spending – and the direct and indirect impact of off-campus spending by Harvard students – we can estimate that Harvard directly and indirectly accounted for nearly $4.8 billion in economic activity in the Boston area in fiscal year 2008, and more than 44,000 jobs.”
Urban-Age.Net Currently, the world’s top 30 cities generate 80% of the world’s wealth. The Urban Age For the first time in history more than 50% the earth’s population live in cities - by 2050 it will be 75% The Endless City
Thank-You! Questions? “Instrumented, Interconnected, Intelligent – Let’s build a Smarter Planet.” – IBM “If we are going to build a smarter planet, let’s start by building smarter cities” – CityForward.org “Universities are major employers in cities and key to urban sustainability.” – Coalition of USU “Cities learning from cities learning from cities.” – Fundacion Metropoli “The future is already here… It is just not evenly distributed.” – Gibson “The best way to predict the future is to create it/invent it.” – Moliere/Kay “Real-world problems may not/refuse to respect discipline boundaries.” – Popper/Spohrer “Today’s problems may come from yesterday’s solutions.” – Senge “History is a race between education and catastrophe.” – H.G. Wells “The future is born in universities.” – Kurilov “Think global, act local.” – Geddes • Dr. James (“Jim”) C. Spohrer • Director, IBM University Programs (IBM UP) WW • spohrer@us.ibm.com
Vision for the Educational Continuum TECHNOLOGY IMMERSION Primary School Any Device Learning Secondary School PERSONAL LEARNING PATHS Workforce Skills Individual Learning Continuum Student-Centered Processes Higher Education Continuing Education KNOWLEDGE SKILLS Learning Communities Intelligent • Aligned Data • Outcomes Insight GLOBAL INTEGRATION Economic Sustainability Instrumented • Student-centric • Integrated Assessment Services Specialization Education System Continuum Interconnected • Shared Services • Interoperable Processes ECONOMIC ALIGNMENT Systemic View of Education The Educational Continuum http://www-935.ibm.com/services/us/gbs/bus/html/education-for-a-smarter-planet.html 33
Fun: Learn CityInvesting with CityOne Game Serious Game to teach problem solving for real issues in key industries, helping companies to learn how to work smarter. Energy, Water, Banking, Retail http://www.ibm.com/cityone
Priority 1: Urban Sustainability & Service Innovation Centers A. Research: Holistic Modeling & Analytics of Service Systems Modeling and simulating cities will push state-of-the-artcapabilities for planning interventions in complex system of service systems Includes maturity models of cities, their analytics capabilities, and city-university interactions Provides an interdisciplinary integration point for many other university research centers that study one specialized type of system Real-world data and advanced analytic tools are increasingly available B. Education: STEM (Science Tech Engineering Math) Pipeline & LLL City simulation and intervention planning tools can engage high school students and build STEM skills of the human-made world (service systems) Role-playing games can prepare students for real-world projects LLL = Life Long Learning C. Entrepreneurship: Job Creation City modeling and intervention planning tools can engage university students and build entrepreneurial skills Grand challenge competitions can lead to new enterprises
Service Management:Operations, Strategy,and Information Technology • By Fitzsimmons and Fitzsimmons, UTexas Teaching SSME+D • Fitzsimmons & Fitzsimmons • Graduate Students • Schools of Engineering & Businesses • Teboul • Undergraduates • Schools of Business & Social Sciences • Busy execs (4 hour read) • Ricketts • Practitioners • Manufacturers In Transition • And 200 other books… • Zeithaml, Bitner, Gremler; Gronross, Chase, Jacobs, Aquilano; Davis, Heineke; Heskett, Sasser, Schlesingher; Sampson; Lovelock, Wirtz, Chew; Alter; Baldwin, Clark; Beinhocker; Berry; Bryson, Daniels, Warf; Checkland, Holwell; Cooper,Edgett; Hopp, Spearman; Womack, Jones; Johnston; Heizer, Render; Milgrom, Roberts; Norman; Pine, Gilmore; Sterman; Weinberg; Woods, Degramo; Wooldridge; Wright; etc. • URL: http://www.cob.sjsu.edu/ssme/refmenu.asp • Service Is Front Stage:Positioning services forvalue advantage • By James Teboul, INSEAD • Reaching the Goal: How Managers Improve a Services Business Using Goldratt’s Theory of Constraints • By John Ricketts, IBM
Service-dominant logic Service is the application of competences for the benefit of another entity Serviceis exchanged for service Value is always co-created Goods are appliances for delivery Alleconomies are service economies All businesses are service businesses Value Configuration Density Resource Integrator/Beneficiary Resource Integrator/Beneficiary (“Firm”) (“Customer”) Value Co-creation Vargo, S. L. & Lusch, R. F. (2004). Evolving to a new dominant logic for marketing. Journal of Marketing, 68, 1 – 17.
Value depends on the capabilities a system has to survive and create beneficial change in its environment. Taking advantage of the service another system offers means incorporating improved capabilities. Value can be defined as system improvement in an environment. All ways that systems work together to improve or enhance one another’s capabilities can be seen as being value creating. What is value? Vargo, S. L., Maglio, P. P., and Akaka, M. A. (2008). On value and value co-creation: A service systems and service logic perspective. European Management Journal, 26(3), 145-152.
Service involves at least two entities applying competences and making use of individual and shared resources for mutual benefit. We call such interacting entities service systems. • B. Service Client • Individual • Organization • Public or Private • A. Service Provider • Individual • Organization • Public or Private Forms of Service Relationship (A & B co-create value) Forms of Service Interventions (A on C, B on C) Forms of Responsibility Relationship (A on C) Forms of Ownership Relationship (B on C) • C. Service Target: The reality to be • transformed or operated on by A, • for the sake of B • People, dimensions of • Business, dimensions of • Products, goods and material systems • Information, codified knowledge Gadrey, J. (2002). The misuse of productivity concepts in services: Lessons from a comparison between France and the United States. In J. Gadrey & F. Gallouj (Eds). Productivity, Innovation, and Knowledge in Services: New Economic and Socio-economic Approaches. Cheltenham UK: Edward Elgar, pp. 26 – 53. What is a service system? Spohrer, J., Maglio, P. P., Bailey, J. & Gruhl, D. (2007). Steps toward a science of service systems. Computer, 40, 71-77.
Rights No-Rights 1. People 2. Technology Physical 3. Organizations 4.. SharedInformation Not-Physical Resources are the building blocks of service systems First foundational premise of service science Service system entities dynamically configure four types of resources The named resource is Physical or Not-Physical (physicists resolve disputes) The named resource has Rights or No-Rights (judges resolve disputes within their jurisdictions) Formal service systems can contract Informal service systems can promise/commit Trends & Countertrends (Evolve and Balance): Informal <> Formal Social <> Economic Political <> Legal Routine Cognitive Labor <> Computation Routine Physical Labor <> Technology Transportation (Atoms) <> Communication (Bits) Qualitative (Tacit) <> Quantitative (Explicit) Spohrer, J & Maglio, P. P. (2009) Service Science: Toward a Smarter Planet. In Introduction to Service Engineering. Editors Karwowski & Salvendy. Wiley. Hoboken, NJ..
Value propositions are the building blocks of service system networks Second foundational premise of service science Service system entities calculate value from multiple stakeholder perspectives A value propositions can be viewed as a request from one service system to another to run an algorithm (the value proposition) from the perspectives of multiple stakeholders according to culturally determined value principles. The four primary stakeholder perspectives are: customer, provider, authority, and competitor Value propositions coordinate & motivate resource access Spohrer, J & Maglio, P. P. (2009) Service Science: Toward a Smarter Planet. In Introduction to Service Engineering. Editors Karwowski & Salvendy. Wiley. Hoboken, NJ..
Competitor Provider Customer Authority A S P C (substitute) OO OO LC LC SA SA PA PA value-proposition change-experience dynamic-configurations time service = value-cocreation B2B B2C B2G G2C G2B G2G C2C C2B C2G *** provider resources Owned Outright Leased/Contract Shared Access Privileged Access customer resources Owned Outright Leased/Contract Shared Access Privileged Access Access rights are the building blocks of service system ecology Third foundational premise of service science Service system entities reconfigure access rights to resources by mutually agreed to value propositions • Access rights • Access to resources that are owned outright (i.e., property) • Access to resource that are leased/contracted for (i.e., rental car, home ownership via mortgage, insurance policies, etc.) • Shared access (i.e., roads, web information, air, etc.) • Privileged access (i.e., personal thoughts, inalienable kinship relationships, etc.) Spohrer, J & Maglio, P. P. (2009) Service Science: Toward a Smarter Planet. In Introduction to Service Engineering. Editors Karwowski & Salvendy. Wiley. Hoboken, NJ..
Rights No-Rights 1. People 2. Technology Physical 3. Organizations 4.. SharedInformation Not-Physical A S P C Premises of service science: What service systems do Service system entities dynamically configure (transform) four types of resources Service system entities calculate value from multiple stakeholder perspectives Service system entities reconfigure access rights to resources by mutually agreed to value propositions Spohrer, J & Maglio, P. P. (2009) Service Science: Toward a Smarter Planet. In Introduction to Service Engineering. Editors Karwowski & Salvendy. Wiley. Hoboken, NJ..