Download
1 / 13
140 likes | 466 Views
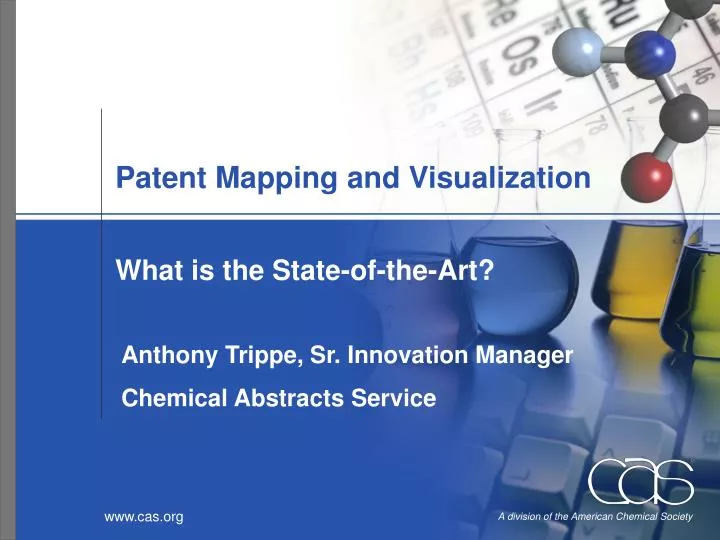
Patent Mapping and Visualization. What is the State-of-the-Art?. Anthony Trippe, Sr. Innovation Manager Chemical Abstracts Service. From the Way Back Machine. Linear Law of Patent Analysis (1998) Create a tool kit of Patinformtics tools Understand the Need Behind the Need

E N D
Patent Mapping and Visualization What is the State-of-the-Art? Anthony Trippe, Sr. Innovation Manager Chemical Abstracts Service
From the Way Back Machine • Linear Law of Patent Analysis (1998) • Create a tool kit of Patinformtics tools • Understand the Need Behind the Need • The Need Drives the Question • The Question Drives the Data • The Data Drives the Tool • Why is this important? • To a man with a hammer, everything looks like a nail - avoid this at all costs
A Riddle • What is round, represents millions of different pieces of data, yet is completely understood regardless of language or culture?
Mapping Principles • What sort of data are you mapping? • What relationships are you trying to represent or bring out in a large collection of data? • What is the principle object on the map? • What is the item you want the user to focus on? • What other dimensions or variables are you trying to represent?
Mapping Principles • What types of symbols, colors, shapes, etc… will you use to represent the dimensions and variables? • How will you determine the relevance between the dimensions • Particularly with the primary object • How do you measure this? • How do you “lay-out” the map so the relevance is represented and then present the map to the user? • What sort of interface do you apply so the user can interact with the data?
An Example Applied to Patent Text • Need behind the need • View from 20,000 feet of whole documents for large answer sets (macro-level analysis) • Examine fine details within a small collection (micro-level analysis) • Patent Family relationships • Claim construction • The need drives the question • How many documents in a particular sub-category and who are they assigned to? (macro-level) • How many independent claims are there and which dependant claims are associated with them? (micro-level)
An Example Applied to Patent Text • The question drives the data • What is my object? • What are the important pieces of meta-data associated with this object? • The data drives the tool • How do I measure the relationship? • How do I represent this to the user? • What will the user interaction be like?
An Example Applied to Patent Structures • Need behind the need • View from 20,000 feet of large substance collections (macro-level analysis) • Examine fine details within a small collection (micro-level analysis) • Identify related properties amongst substances • Identify structural diversity within collection • The need drives the question • How many substances in a particular disease category and who are they assigned to? (macro-level) • Is there any space remaining to develop new and novel substances in this area? (micro-level)
An Example Applied to Patent Structures • The question drives the data • What is my object? • What are the important pieces of meta-data associated with this object? • The data drives the tool • How do I measure the relationship? • How do I represent this to the user? • What will the user interaction be like?
Conclusions • Apply the tried and true methodology to approaching these issues and problems • Don’t create a solution looking for a problem • Break the problem down into its component pieces and tackle each individually.