Download
1 / 16
160 likes | 258 Views
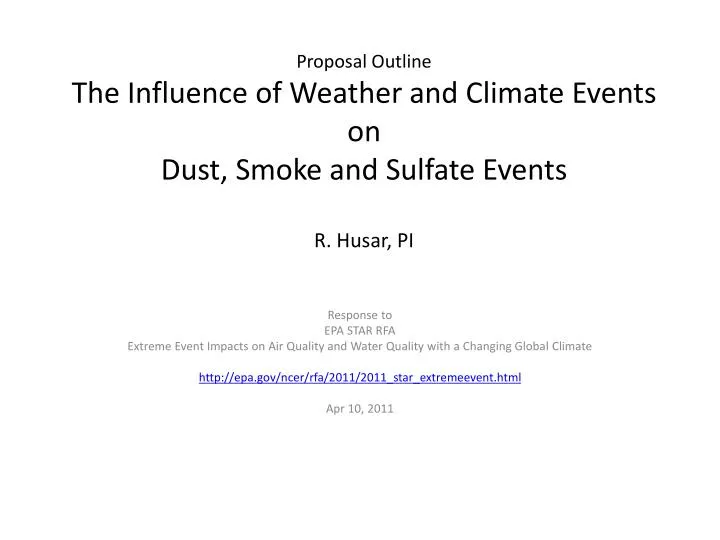
Proposal Outline The Influence of Weather and Climate Events on Dust, Smoke and Sulfate Events R. Husar, PI. Response to EPA STAR RFA Extreme Event Impacts on Air Quality and Water Quality with a Changing Global Climate http://epa.gov/ncer/rfa/2011/2011_star_extremeevent.html Apr 10, 2011.

E N D
Proposal Outline The Influence of Weather and Climate EventsonDust, Smoke and Sulfate EventsR. Husar, PI Response to EPA STAR RFA Extreme Event Impacts on Air Quality and Water Quality with a Changing Global Climate http://epa.gov/ncer/rfa/2011/2011_star_extremeevent.html Apr 10, 2011
General Framework • Atmospheric Effects on Air Quality: • Emissions (Anthropogenic and Natural) • Dispersion (Horizontal and Vertical) • Kinetics (Chem. Reactions & Removal) • All the above depends on climate • Emissions • Anthropogenic • El. Utility (Temp) • Transportation • Industrial • Natural • Dust (T,Prec,Wind) • Smoke (T,Prec,Wind) • Biogenic (T) • Source-Receptor • Dispersion (Vertical and Horizontal) • HiP stagnations (Circ.) • LoP Blockage (Circ) • Locdisp (Wind, MiixH) • Transformations • Sox Oxidation (T,H) • Sox Removal (Prec) Events: 1. Continental/Hemispherical 2. Regional
Continental/Hemispherical Scale Events • Continental/Hemispherical Scale Events • Influenced by global emissions, circulation, precipitation • AQ – Climate analysis method fro global..???? • AQ and Climate Relevance: • Demonstrate role global climate • Tipping points for Regulations • Mex Smoke >>> Exceptional Event Rule • Gobi Dust >> Hemispheric Transport Protocol
Continental/Hemispheric Dust Events over the US Gobi dust in spring Sahara in summer US-scale fine dust events are mainly from intercontinental transport Fine Dust Events, 1992-2003 ug/m3
Continental/Hemispheric Smoke Events over the US Stuff-Stuff-Stuff-Stuff- • Scenario: Smoke form Mexico causes record PM over the Eastern US. • Goal: Detect smoke emission and predict PM and ozone concentration Support air quality management and transportation safety • Impacts: PM and ozone air quality episodes, AQ standard exceedance Transportation safety risks due to reduced visibility • Timeline: Routine satellite monitoring of fire and smoke The smoke event triggers intensified sensing and analysis The event is documented for science and management use • Science/Air Quality Information Needs: Quantitative real-time fire & smoke emission monitoring PM, ozone forecast (3-5 days) based on smoke emissions data • Information Technology Needs: Real-time access to routine and ad-hoc data and models Analysis tools: browsing, fusion, data/model integration Delivery of science-based event summary/forecast to air quality and aviation safety managers and to the public Record Smoke Impact on PM Concentrations Smoke Event rhusar@me.wustl.edu, stefan@me.wustl.edu
Tools for Continental AQ-Climate Analysis NAAPS-NAAPS-NAAPS-NAAPS-NAAPS NOGAPS-NOGAPS-NOGAPS-NOGAPS-
REGIONAL • Regional-Scale Events • Influenced by regional emissions, circulation, precipitation • AQ – Climate analysis method for regional…?? • AQ and Climate Relevance: • Demonstrate role regional emissions, climate, precipitation
Tools/Methods for Regional AQ-Climate Analysis Possible Drought Effect on PM Coarse in South Texas • The two dust peeks at Big Bend have different Al/Si ratios • During the year, Al/Si = 0.4 • In July, Al/Si reaches 0.55, closer to the Al/Si of the Sahara dust (0.65-0.7) • The spring peak is identified as as ‘Local Dust’, while the July peak is dominated by Sahara dust.
Datasets, Info Sharing, Collaboration.. • Other … tangibles and intangibles
Satellite Aerosol Optical Thickness ClimatologySeaWiFS Satellite, Summer 2000 - 2003 • Space-Time-Parameter coverage • GISS datasets 60 Percentile 99 Percentile