Download
1 / 22
220 likes | 398 Views
UNECE, Committee on Trade Geneva , June 18, 2012. How to increase the participation of transition economies in international trade The World Bank's Logistics Performance Index (LPI) - One way to identify areas for action With some thoughts on challenges in

E N D
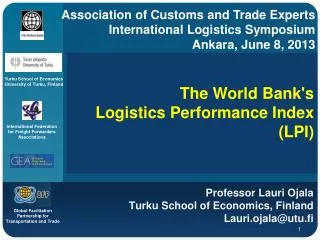
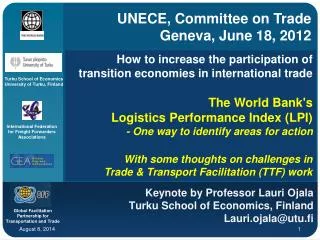
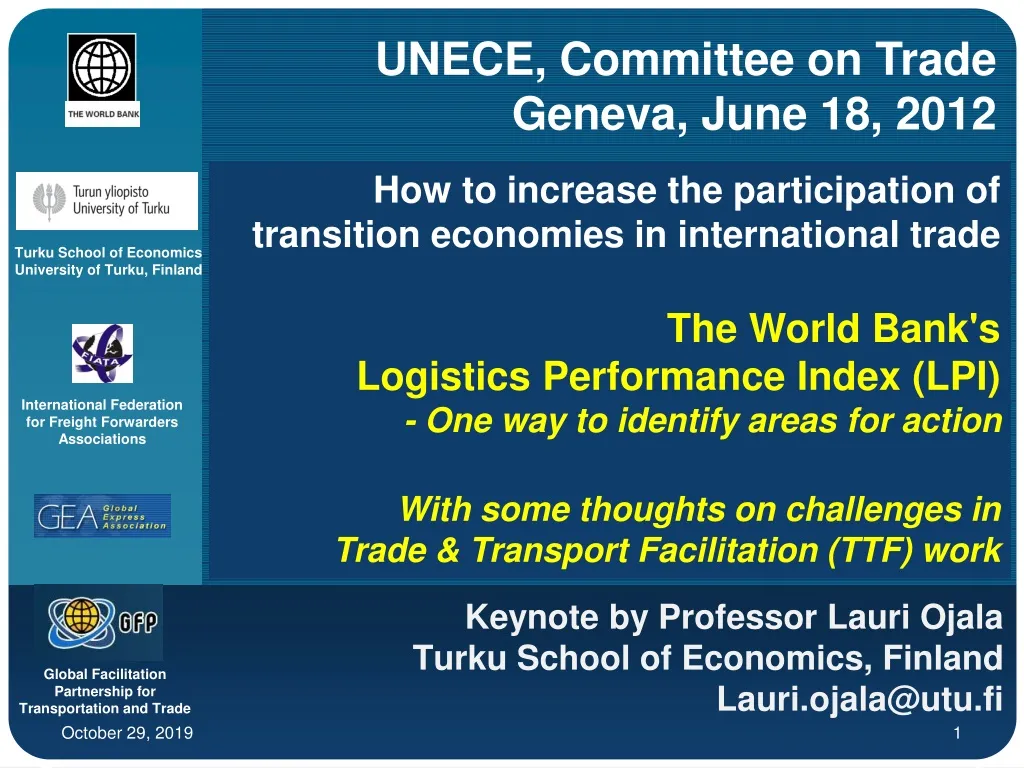
UNECE, Committee on Trade Geneva, June 18, 2012 How to increase the participation of transition economies in international trade The World Bank's Logistics Performance Index (LPI) - One way to identify areas for action With some thoughts on challenges in Trade & Transport Facilitation (TTF) work Turku School of Economics University of Turku, Finland International Federation for Freight Forwarders Associations Keynote by Professor Lauri Ojala Turku School of Economics, Finland Lauri.ojala@utu.fi Global Facilitation Partnership for Transportation and Trade
A short introduction • Since 1997, Full Professor of Int’l Logistics at the Turku School of Economics, Finland • Since the 1990s, worked as an TTF expert for: • The World Bank (WB), ADB & Nordic Investment Bank • OECD (ITF), EC, APEC and UNIDO • the Finnish, Dutch, Danish, Swedish, Latvian, Lithuanian and Estonian Governments • Conducted TTF analyses for the WB on the Baltic States, Albania, Southern Africa and CIS states • Initiator of WB’s Logistics Performance Index • Published widely in scientific journals on logistics UNECE, Geneva, June 18, 2012, Prof. Lauri Ojala
Background on the LPI Firstreport & data launched on Nov. 5, 2007 www.worldbank.org/lpi LPI 2010 launched by WB President Robert B Zoellick in Berlin on Jan. 15, 2010 Worldwide media coverage LPI 2012 out May 16, 2012 UNECE, Geneva, June 18, 2012, Prof. Lauri Ojala
What is the LPI? A set of indicators that measure the performance of the trade logisticsenvironment of economies Data for the LPI Logistics professionals in international freight forwarding operations UNECE, Geneva, June 18, 2012, Prof. Lauri Ojala
LPI 2010 & 2012 data collection • Web-basedSurvey in: • English, French, Spanish, Chinese and Russian • 1,000+ individualrespondents • Responses from 130-160 economies • Over 5,000 international evaluations of 155 economies ”from the outside” • Data from 100-140 economies for evaluation ”from the inside” • All survey data is indicative due to e.g. sampling errors, subjective evaluations & confidence intervals UNECE, Geneva, June 18, 2012, Prof. Lauri Ojala
155 economies compared internationally based on 5,000+individual evaluations on: The Overall LPI Score is composed of these six dimensions Country ranks in the International LPI • LPI measures measures how “easy” or “difficult” Trade Logistics is • More applicable to trade of manufactures than to bulk commodities UNECE, Geneva, June 18, 2012, Prof. Lauri Ojala
Overall LPI 2012 scores www.worldbank.org/lpi UNECE, Geneva, June 18, 2012, Prof. Lauri Ojala
Upper Middle Income countries a “watershed”; you find them in all performance quintiles LPI 2012 data UNECE, Geneva, June 18, 2012, Prof. Lauri Ojala
It is more how things are done thanwhat the formal regime is Sorted by LPI 2012 quintile Number of.. 9 UNECE, Geneva, June 18, 2012, Prof. Lauri Ojala
Income level alone does not explain economies’ trade logistics performance Countries by LPI 2012 overall score and GDP/capita The boundaries for the fourcategoriesindicativeonly ”Logistics Friendly” ”Consistent Performers” ”PartialPerformers” ”Logistics Unfriendly” UNECE, Geneva, June 18, 2012, Prof. Lauri Ojala
Four main categories of countries identified in the LPI Trade logistics reform matrix With selected countries as examples Kyrgyz Rep. Moldova Tajikistan Mongolia Kazakhstan Belarus Russia Armenia Azerbaijan Uzbekistan Tunisia Brazil Vietnam Lithuania Ukraine Georgia Malaysia Thailand UNECE, Geneva, June 18, 2012, Prof. Lauri Ojala
LPI 2012 scores overall (top) and by each of the six dimensions of selected CIS countries Scores: 5 = highest 1 = lowest UNECE, Geneva, June 18, 2012, Prof. Lauri Ojala
Kazakhstan’s LPI scores overall (top) and by each of the six dimensions 2007-2012 = 2007 = 2010 = 2012 UNECE, Geneva, June 18, 2012, Prof. Lauri Ojala
LPI 2007 indicated a strong correlation of national logistics performance and costs Source: Arvis et al. (2007) Connecting to Compete; Logistics Performance Index, World Bank UNECE, Geneva, June 18, 2012, Prof. Lauri Ojala
Conclusion on the LPI survey • A useful indicator on how ”easy” or ”difficult” a country’s Trade Logisticsis • Provides also domestic assessments; no. of respondents in a single economy often low • Scores = Confident Intervals, not fixed points • The resolution is rather low, but the LPI correlates very well with other datasets • Robust& pragmatic data; useful in research, teaching, business and policy-making 15 UNECE, Geneva, June 18, 2012, Prof. Lauri Ojala
Some thoughts on challenges inTrade & Transport Facilitation work- Using Central Asia as an example UNECE, Geneva, June 18, 2012, Prof. Lauri Ojala
The ”Spaghetti Bowl” of Regional Trade agreements involving Central Asian Republics Source: ADB (2006) Increasing Gains from Trade Through Regional Cooperation in Trade Policy, Transport, and Customs Transit As of 31 January 2006 Customs Union UNECE, Geneva, June 18, 2012, Prof. Lauri Ojala
The ”Noodle Soup” of Donors and Multilaterals* involving Central Asian Republics EBRD The World Bank ADB IsDB UNECE UNDP ESCAP EU All Others GTZ USAID JAICA DFID *) without bilateral activities e.g. from China and Russia UNECE, Geneva, June 18, 2012, Prof. Lauri Ojala
Typical problems with TTF project work in such a challenging environment Projects often not completed before new ones start High turnaround of civil servants and consultants Ambitious plans to consolidate permits & licenses into a single database, but no implementation Customs and other Border Agencies may have several poorly coordinated electronic systems; there is no lack of money, but that of management Too often Trade Facililtation means procurement of fancy new equipment, without the skills or the will to use them in order to facililate the processes UNECE, Geneva, June 18, 2012, Prof. Lauri Ojala
Thank you!The 2012 LPI is available at:www.worldbank.org/lpi UNECE, Geneva, June 18, 2012, Prof. Lauri Ojala
A comprehensiveoverview By Rantasila & Ojala Discussion Paper 2012 - 04 Publishedat the ITF Summit 2012, May 4, in Leipzig, Germany Available also at: www.internationaltransportforum.org 21 UNECE, Geneva, June 18, 2012, Prof. Lauri Ojala
www.cash-project.eu UNECE, Geneva, June 18, 2012, Prof. Lauri Ojala