Download
1 / 30
300 likes | 421 Views
Tests of the Ring-Diagram Inversions. A. Kosovichev. Verification, testing and investigation of systematic effects are crucial for the HMI success. Two approaches: Comparison of analysis results obtained by different local helioseismology methods Ring diagram analysis

E N D
Tests of the Ring-Diagram Inversions A. Kosovichev
Verification, testing and investigation of systematic effects are crucial for the HMI success • Two approaches: • Comparison of analysis results obtained by different local helioseismology methods • Ring diagram analysis • Acoustic holography/imaging • Using numerical simulation data • Wave propagation linearized MHD codes • Local sunspot regions (K.Parchevsky) • Full-Sun sphere (T.Hartlep) • Non-linear radiative MHD codes • MSU code (R.Stein) • NASA/Ames code (A.Wray)
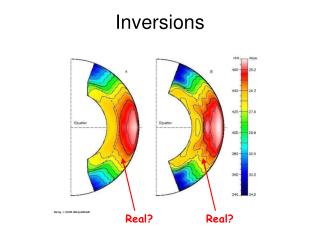
Example: sound-speed structure below sunspots Travel-time inversions Born kernels Ray-path kernels Couvidat et al (2006)
The controversies in data analysis procedures can be resolved by using numerical simulation data Example: phase-speed filtering is used for travel-time measurements at short travel distances to separate first- and second-bounce signals and improve S/N.
Testing of acoustic holography technique with phase-speed filtering revealed travel-time artifacts at short distances (Birch et al 2009) Problematic positive shifts D=1 Mm (shallow) D=10 Mm (deep)
Zhao et al (2009) repeated this test by using the standard time-distance technique with and without the phase-speed filtering and did not find such artifacts. They found a reasonably good agreement with the ray-theory predictions. Blind tests have been done for both time-distance and holography codes using more complicated models.
Measurements of travel times without phase-speed filtering from Hinode data
Comparison time-distance and ring-diagram inversions Basu et al (2004) Bogart et al (2008)
Comparison of ring-diagram and time-distance inversions by Gizon et al (2009) using the CT ring-diagram code and a time-distance code (S.Zharkov)
Ring-diagram fitting formula (CT)(Basu, Antia, and Bogart, 2004)
Test of CT fitting formula • Specify a sound-speed sunspot model. • Assume that this perturbation is spherically symmetric. • Calculate the frequency shifts by using the variational principle, and perturbed frequencies. • Fit to the frequencies of the standard solar model and the model with a sunspot-type perturbations • Calculate the frequency difference and run the structure inversion code (OLA), assuming 0.1% measurement error. • Compare inversions with the initial sunspot model.
Test for AR 9787 • Inversion of Deborah Haber’s measurements of ring-diagram frequencies (the CO fitting formula). • Days 120-128 of 2002; one frequency measurement per day. • Spatial grid: 15x15 with 7.5 degrees step in latitude and longitude. • The total number of frequency sets: 1511 • Inversion relative to the solar model S by the OLA method including the surface term.
Summary • The CT ring-diagram fitting formula used by Basu et al (2004), Bogart et al (2008) and Gizon et al. (2009) may lead to large systematic errors. • The sound-speed inversion results obtained from the CO ring-diagram frequencies for AR 9787 are qualitatively different from the results obtained from the CT ring-diagram fitting, and are more in line with the time-distance inversion results. • Verification and testing of the local helioseismology techniques using numerical MHD simulation data is critical for development of the HMI data analysis pipeline. • It is important to develop of methods and standards for intercomparison of the various local techniques.