Download
1 / 36
430 likes | 754 Views
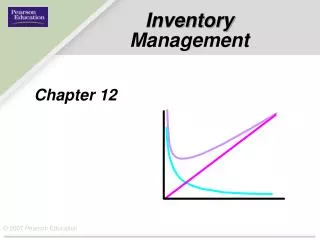
CHAPTER 11: Inventory Management. Slides prepared by Romulus Cismaru University of Regina. Chapter 11 Outline. Introduction Requirements for Effective Inventory Management Fixed Order Quantity/Reorder Point Model (FOQRP) FOQRP: Determining the Reorder Point Fixed Order Interval Model

E N D
CHAPTER 11: Inventory Management Slides prepared by Romulus Cismaru University of Regina
Chapter 11 Outline • Introduction • Requirements for Effective Inventory Management • Fixed Order Quantity/Reorder Point Model (FOQRP) • FOQRP: Determining the Reorder Point • Fixed Order Interval Model • The Single Period Model
A. Introduction Inventory: An idle material or product • Basic questions: • How much to order • When to order • Functions of Inventory: • To meet anticipated demand • To wait while being transported • To protect against stock-outs • To take advantage of economic lot size and quantity discount • To smooth seasonal production requirements • To decouple operations • To hedge against price increases
A. Objectives of Inventory Control Inventory turnover: Ratio of average cost of goods sold to average inventory investment • Inadequate control of inventories can result in both under and overstocking of items • Under stocking results in: • Missed deliveries, lost sales, dissatisfied customer, production stoppage • Overstocking results in: • Excessive cost of the inventory • Objectives of Inventory Control • Have the right goods, in sufficient quantitative, in the right place, at the right time • Have a Low cost of ordering and carrying inventories
B. Requirements for Effective Inventory Management • A system to safely store and use inventory • A system to keep track of the inventory, and a replenishment model • Reliable forecasts of demand and knowledge of lead times • Reasonable estimate of inventory holding, ordering, and shortage costs • ABC classification
B2. Inventory Counting and Replenishment Models • Periodic System • Physical count of items made at periodic intervals • Perpetual Inventory System • System that keeps track of removals from and additions to inventory continuously, thus monitoring current levels of each item.
0 214800 232087768 B2. Inventory Counting and Replenishment Models • Fixed Order Quantity/Reorder Point Model • An order of a fixed size, usually equal to the economic order quantity, is placed when the amount on hand drops below a minimum quantity called the reorder point • Two-Bin System • Two containers of inventory; reorder when the first is empty • Universal Bar Code • A number assigned to an item or location, made of a group of vertical bars of different thickness that are readable by a scanner
B3. Demand Forecast • Lead time • time interval between ordering and receiving the order • Point of Sale system • Software for electronically recording sales and updating inventory levels at the time and location of sale
B4. Cost Information • Holding (carrying) costs • cost to carry an item in inventory • Ordering costs • costs determining order quantity, preparing purchase orders, and fixed cost portion of receiving, inspection, and material handling • Setup costs • Time spent preparing equipment for the job by adjusting machine, changing tools, etc • Shortage costs • costs when demand exceeds supply; often unrealized profit per unit
High A Annual $ volume of items B C Low Few Many Number of Items B5. ABC Classification Classifying inventory according to some measure of importance and allocating control efforts accordingly. A-very important B- mod. Important C- least important
C. Fixed Order Quantity/Reorder Point Model: Economic Order Quantity • The basic economic order quantity (EOQ) • The economic production quantity (EPQ) • The EOQ with quantity discount • The EOQ with planned shortage
C1. Basic EOQ assumptions • Only one product is involved • Annual demand requirements known • Demand is spread evenly throughout the year so the demand rate is reasonably constant • Lead time does not vary • Each order is received in a single delivery • There are no quantity discounts
Profile of Inventory Level Over Time Q Demand rate Quantity on hand Reorder point Time Place order Place order Receive order Receive order Receive order Lead time C1. The Inventory Cycle
The Total-Cost Curve is U-Shaped Annual Cost Ordering Costs Order Quantity (Q) QO (optimal order quantity) C1. Cost Minimization Goal
C1. Deriving the optimal order quantity • Using calculus, we take the derivative of the total cost function and set the derivative (slope) equal to zero and solve for Q. • The total cost curve reaches its minimum where the carrying and ordering costs are equal.
C2. Economic Production Quantity (EPQ) • Production done in batches or lots • Capacity to produce a part exceeds the part’s usage or demand rate • Assumptions of EPQ are similar to EOQ except orders are received incrementally during production
C3. EOQ with Quantity Discounts Quantity Discounts: Price reductions for large orders
Cost Adding Purchasing costdoesn’t change EOQ TC with RD TC without RD RD 0 Quantity EOQ C3. Total Costs with RD
C3. Total Cost Curve with Quantity Discounts TCa TCb Total Cost Decreasing Price TCc CC a,b,c OC EOQ Quantity
C3. Best Purchase Quantity Procedure • Beginning with the lowest unit price, compute the minimum points for each price range until you find a feasible minimum point. • If the minimum point for the lowest unit price is feasible, it is the optimal order quantity. If nor, compare the total cost at the minimum price break quantity for all lower prices with the total cost of the largest feasible minimum point. The quantity that yields the lowest total cost is optimum.
C4. EOQ with Planned Shortages We assume that the back-ordered demand will cost the company in customer goodwill, and this cost will be proportional to the length of time a unit is back-ordered
D. Fixed Order Quantity/Reorder Point Model: Determining the Reorder Point • Reorder Point (ROP) • When the quantity on hand of an item drops to this amount, the item should be reordered • Safety Stock • Stock that is held in excess of expected demand due to variable demand rate and/or lead time. • Service Level • Probability that demand will not exceed supply during lead time.
Quantity Maximum probable demand during lead time Expected demand during lead time ROP Safety stock Time LT D. Safety Stock
Service level Risk of a stockout Probability of no stockout Quantity ROP Expected demand Safety stock 0 z z-scale D. Reorder Point
E. Fixed-Order-Interval Model • Orders are placed at fixed time intervals • Order quantity for next interval • Suppliers might encourage fixed intervals • May require only periodic checks of inventory levels
E. Fixed-Order-Interval Model Determining the amount to Order
E. Benefits and Disadvantages • Benefits • Items from same supplier may yield savings in: Ordering, Packing, Shipping costs • May be practical when inventories cannot be closely monitored • Disadvantages • Requires a larger safety stock • Increases carrying cost • Costs of periodic reviews
F. Single Period Model • Single period model • model for ordering of perishables and other items with limited useful lives • Shortage cost Cs • generally the unrealized profits per unit • Excess cost Ce • difference between purchase cost and salvage value of items left over at the end of a period
F. Single Period Model • Continuous stocking levels • Identifies optimal stocking levels • Optimal stocking level balances unit shortage and excess cost • Discrete stocking levels • Service levels are discrete rather than continuous • Desired service level is equaled or exceeded
F. Operations Strategy • Too much inventory • Tends to hide problems • Easier to live with problems than to eliminate them • Costly to maintain • Wise strategy • Reduce lot sizes • Reduce safety stock