Download
1 / 41
410 likes | 550 Views
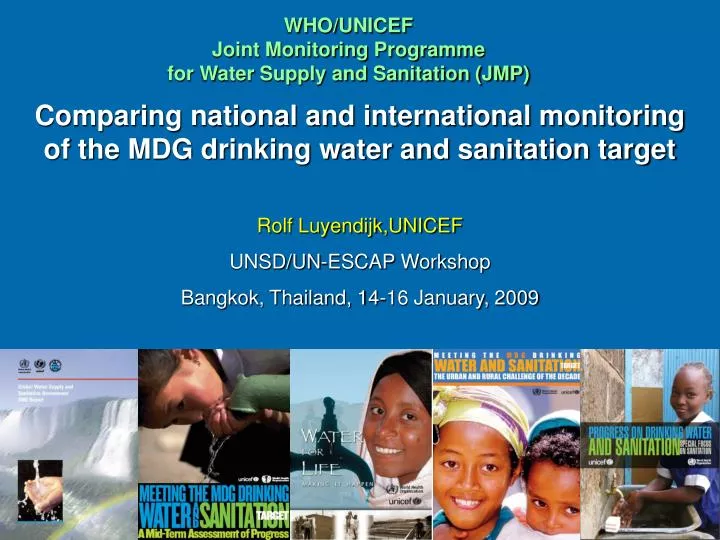
Comparing national and international monitoring of the MDG drinking water and sanitation target Rolf Luyendijk,UNICEF UNSD/UN-ESCAP Workshop Bangkok, Thailand, 14-16 January, 2009. WHO/UNICEF Joint Monitoring Programme for Water Supply and Sanitation (JMP). This presentation. 1. Introduction

E N D
Comparing national and international monitoring of the MDG drinking water and sanitation target Rolf Luyendijk,UNICEF UNSD/UN-ESCAP Workshop Bangkok, Thailand, 14-16 January, 2009 WHO/UNICEFJoint Monitoring Programmefor Water Supply and Sanitation (JMP)
This presentation 1.Introduction 2. Data sources 3. JMP Methodology 4. Definitions 5. Comparing national and international monitoring
WHO/UNICEF Joint Monitoring Program (JMP) • Established in 1990 • Secretariat: • World Health Organization & UNICEF
WHO-UNICEF Joint Monitoring Program (JMP) • Responsible for monitoring progress towards MDG 7 Target 7c • Global accountability and advocacy • Biennial updates of coverage estimates • Water supply & sanitation • urban, rural, and total • by country, region and at global level
Improved sanitation coverage, 2006 Less than 50% 51% - 75% 76% - 90% 91% - 100% No or insufficient data Sanitation in Asia: Urban and rural disparities 2006 Rural Urban WHO/UNICEF JMP, 2008
1.Introduction 2. Data sources 3. JMP Methodology 4. Definitions 5. Comparing national and international monitoring
Data sources on access to drinking water and sanitation • 1980 – 1997 Reported data from Governments • 1997 – data from household surveys and censuses • JMP data sources are primary sources: • National household sample surveys (DHS, MICS, LSMS, CWIQ, WHS, HBS, H&N, RHS, PAPFAM etc) • National censuses • Note: JMP is not involved in primary data collection
How does the JMP obtain national census and household survey data? • DHS surveys - directly from MACRO-International • MICS surveys from UNICEF • WHS surveys from WHO Other surveys and census data: • UNICEF country offices - annual data compilation • International Household Survey Network • Internet searches of NSO websites Question: What would be an appropriate mechanism for NSOs to submit new survey and census data on water and sanitation to the WHO/UNICEF JMP?
Use of “user-based” data vs. “provider-based” data • Standardized definitions among surveys • Objective “snapshot” of the situation • Nett picture of new facilities constructed and those fallen in disrepair • Avoid double counting of upgraded improved facilities (e.g. hand pump to piped house connection) • Allows for analyses • Disaggregated into wealth quintiles • Comparable across countries • Monitor trends over time
Coverage distribution Reported data Survey data
JMP – data base (2008) • Data for +/- 170 countries • 600+ results of HH surveys + Censuses from 1985 – 2006 • Bulk of surveys for LDCs, SSA, larger developing countries • 30 - 35 new survey results per year • Frequency for most developing countries one survey every three years
1.Introduction 2. Data sources 3. JMP Methodology 4. Definitions 5. Comparing national and international monitoring
Monitoring MDG drinking water and sanitation targets • A country’s responsibility • At global level: JMP • Challenges: • Track progress over time • Ensure comparability over time • Track progress towards the MDG target vs. baseline year 1990 • Ensure comparability of data among countries (JMP specific challenge)
Estimates Coverage 2004 = 50% Latest data point DHS 2002 :51% Hallo
Estimates Coverage 2004 = 50% = 54% 2006 = 57% Added Fictive data point 2005 :58% Hallo
Estimated Coverage 2004 = 50% = 54%= 54% 2006 = 57% = 59% 2008 = 63% Added Fictive data point 2008 :65% Hallo
Estimated Coverage 2004 estimate = 50% Latest data point DHS 2002 :51%
2004 = 50% = 54% 2006 = 57% Estimated Coverage 2004 = 50% = 49% 2006 = 52% Added Fictive data point 2005 :58% Added Fictive data point 2005 :49% Hallo
JMP Methodology - Summary • Primarily based on user data derived from household surveys and censuses rather thandata reported by governments • Adjustments made to full historical series to ensure comparability over time and between countries • Use linear regression to extrapolate and interpolate reference years instead of using the latest household survey data
1.Introduction 2. Data sources 3. JMP Methodology 4. Definitions 5. Comparing national and international monitoring
Core question on water and sanitation for household surveys - What is measured? • What is the main source of drinking water for members of your household? • What kind of toilet facility do members of your household usually use? • http://www.wssinfo.org/pdf/WHO_2008_Core_Questions.pdf • Standard set of only eight questions used by DHS and MICS • Detailed descriptions and definitions of technologies • Indicator tabulation plans
MDG target + Indicators MDG 7 Target 10: • Halve, by 2015, the proportion of people without sustainable access to safe drinking water and basic sanitation Indicators (based on information collected): • Proportion of population that uses an improved drinking water source, urban and rural • Proportion of population that uses an improved sanitation facility, urban and rural
“Improved” means…. An improved drinking water source is: “a source that by nature of its construction is adequately protected from outside contamination in particular with fecal matter” An improved sanitation facility: “ a facility that hygienically separates human waste from human contact”
JMP definitions of improved/unimproved Drinking Water Sanitation • Piped into dwelling, plot or yard • Public tap/standpipe • Tube well/borehole • Protected dug well • Protected spring • Rainwater collection • Flush/pour flush to: • piped sewer system • septic tank • pit latrine • Ventilated improved pit (VIP) latrine • Pit latrine with slab • Composting toilet IMPROVED • Unprotected dug well • Unprotected spring • Cart with small tank/drum • Tanker truck • Surface water (river, dam, lake, pond, stream, canal, irrigation canal) • Bottled water • Flush/Pour flush to elsewhere • Pit latrine without slab/open pit • Bucket • Hanging toilet/hanging latrine • Shared sanitation of any type • No facilities, bush or field UN-IMPROVED
What HH Surveys tell us: • Disaggregation by: • Facility types / access levels (e.g. piped connections into dwelling, borehole with hand pump, open defecation, pour flush latrines, etc) • Urban and Rural areas • Time to source (go to, get water and come back) • Wealth quintiles (access of the 20% poorest and 20% richest) • Sometimes disaggregation possible by region or province
1.Introduction 2. Data sources 3. JMP Methodology 4. Definitions 5. Comparing national and international monitoring
Most common discrepancies between national and international coverage estimates(in order of most frequent occurrence) 1.Use of different definitions of access or poorly defined categories • Indonesia: ‘Pit’ or ‘Hole’ is acceptable (?) • MDG definition: shared sanitation facilities are ‘unimproved’ 2.Use of latest survey or census data instead of a computed estimate 3.Use of different population estimates 4.Use of old estimates, instead of latest available data 5.Use of reported (provider-based) data rather than household survey or census data
Often there are discrepancies within a country or between surveys about what constitutes coverage…. • Use of different definitions by different national authorities • China National Health Systems Survey : ‘Harmless sanitary latrines’ • China Ministry of Health: ‘Sanitary latrines’ • Use of different response categories among different surveys describing the same facility • Tanzania, Kazakhstan, etc. traditional pit latrine, latrine, pit latrine, pit, pit latrine with slab • Poor or incomplete disaggregation of response categories • Drinking water category: Indonesia: ‘Piped’ • No listing of unimproved categories e.g. open defecation • Substitute of responses • Thailand, Indonesia, Philippines: ‘bottled water’ for piped water supply into dwelling
Adjustments made to survey or census data set (1) Example: • HBS ‘86: Latrine: 58% Improved • DHS ‘89: Pit: 62% Improved ? • Census ‘92: Open pit: 59% Not improved • MICS ‘95: Traditional latrine: 60% Improved? • How to interpret these categories? Adjustment: half of the facilities are considered improved • Suggested re-classification: • Pit latrine with a slab • Pit latrine without a slab/open pit
Adjustments made to survey or census data set (2) Example: • DHS ‘98: Well: 22% Improved? • Census ‘00: Protected dug well: 14% Improved • Census ’00: Unprotected dug well: 6% Not Improved Did coverage drop by 22 -14 = 8% over the period 1990-2000? • Adjustment: Improved dug well DHS ’98: 14/(14+6) x 22% = 15.4%
Why is a good disaggregation of response categories so important? Eastern Asia & Pacific South Asia Sanitation Tracking of progress Advocacy Accountability Programming Learning Open defecation Not improved Shared Improved 1990 2006 1990 2006
Example Uganda:Monitoring for Learning Trend of population with and without access to an improved drinking water source 1990 - 2006 Urban and rural disparities The majority of the population without access to safe drinking water lives in rural areas Use of an unimproved drinking water source 1990: 61% = 9.7 million people 2006: 40% = 10.3 million people Source: Special tabulation, 2007
Example Philippines:Monitoring for Programming Trend of population with and without access to sanitation 1990 - 2006 Source: Special tabulation, 2007
Example:Monitoring for Advocacy Wealth quintile analysis: The richest 20% are more than five times as likely to use an improved sanitation facility as the poorest 20% Source: Indonesia DHS 2003 special tabulationUganda DHS 2005 special tabulation
Example Viet Nam:Monitoring forAccountability Progress towards the MDG drinking water and sanitation target Source: Special tabulation, 2007
JMP Website: www.wssinfo.org • JMP country files • Four graphs with regressions line • All HHS + census data per country • Regional and global coverage estimates • Core questions on WSS for household surveys incl: • Standard indicators • Definitions of service categories
JMP Challenges ahead (1) Global and National • 2007 – 2010: regional and country workshops, comparing UN - with national coverage estimates and MDG monitoring to exchange experiences for mutual learning and understanding • Facilitate the development and roll-out of standard protocols for water quality monitoring
Challenges ahead (2) Methodological Challenges • Continue to develop and validate tools and instruments to measure: • Sustainable access • Safe drinking water – water quality • Access to basic sanitation • Appropriate hygiene - and hand washing behaviour • Disparities (pro-poor focus) • Access in peri-urban and urban slum areas • Disaggregate urban data between cities and small towns Challenges for wider sector monitoring • Strengthen sub-national monitoring • Invest in sector monitoring of the enabling environment • E.g. policies, HR capacity, financing mechanisms and investments, sustainable operation & maintenance, decentralization of authority, quality management etc.
Monitoring challenges at national level • Regularly collect, use, analyze and disseminate existing and new monitoring data and information for ACTION: • Advocacy • Programming • Accountability • Learning To accelerate progress towards the MDGs • Use standard definitions of access and consistently monitor those over time • Set “own” MDG drinking water and sanitation target