Download

1 / 53
530 likes | 717 Views
Performance evaluation of Urban Mesh Networks. Vinay Sridhara Department of Electrical Engineering University of Delaware. Overview. Motivation Simulation Environment Mobility models Propagation models Simulation methodology Simulation parameters Performance evaluation Coverage

E N D
Performance evaluation of Urban Mesh Networks Vinay Sridhara Department of Electrical Engineering University of Delaware
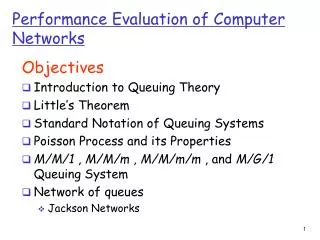
Overview • Motivation • Simulation Environment • Mobility models • Propagation models • Simulation methodology • Simulation parameters • Performance evaluation • Coverage • Achievable bit rate • Application performance • Web like file transfers • Voice over IP • Streaming media application • Conclusions and future work • References
Motivation • Major cities like Philadelphia, Las Vegas and Los Angeles are planning to have a massive wireless hotspots which is expected to span more or less the entire city • They are aimed at supporting applications ranging from monitoring and controlling vehicular traffic to assisting emergency response and remote situation assessment • Philadelphia • Plans to provide ubiquitous wireless access to residents and visitors • Area – 136 square miles • Density – 4000 infrastructure nodes mounted on the lampposts • Distance between the infrastructure nodes is ~ 300m • Mobile nodes are not allowed to act as relays • Las Vegas • Has already deployed a pilot test system • Covers entire city • The distance between infrastructure nodes is ~ 400m • Mobile nodes are allowed to act as relays • These kind of networks have never been studied before either through simulations or any other means
Things to consider when simulating wireless networks Environment under which the network operates Node Mobility Propagation Model
UDelModels • The important aspects for wireless simulations • Tool to model the environment • Should be able to specify Buildings, roads, vegetation etc • Realistic propagation model • Considers the effects of the environment • Should be able to model reflections, diffractions and scattering • Realistic mobility model • Should be able to give a realistic node distribution • Should be able to depict the socio economic behavior of the people • Should be able to model different mobile nodes such as pedestrians, cars, UAVs
Things to consider when simulating wireless networks Environment under which the network operates Node Mobility Propagation Model
UDelModels - MapBuilder • In order to simulate MANETs in urban area it is necessary to have a model of the urban area • Random cities can be built by placing buildings randomly and using Voronoi diagram to connect them. • Such cities might lack typical characteristics of a real city, like long thoroughfares and big intersections which play important role in mobility and propagation • MapBuilder is a software tool that helps in specifying the environment for the simulation • The MapBuilder uses the 3-D GIS dataset to construct city map skeleton with buildings • It gives options to the user to draw other components such as roads, traffic lights, etc.
UDelModels - MapBuilder • The MapBuilder does not specify anything with respect to the interiors of the buildings. • Our models assumes some general structures for the interiors of the buildings. • Office • Office/Stores • Residences • Residence/Stores • Stores • Subway Stations
Things to consider when simulating wireless networks Environment under which the network operates Node Mobility Propagation Model
Existing Mobility Models Entity Mobility Models Group Mobility Models Exponentially Correlated Random waypoint Random Walk Random Waypoint Memoryless Column Model Random Direction Nomadic Model Boundless simulation area Pursue Model Past speed and direction Reference point Group Mobility Gauss-Markov Urban Environments City Section Probabilistic version of Random walk
Why do we need other models? • The existing models do not consider the effects of the operating environment • Even though the empirical models such as Okamura-Hata are modeled for urban/suburban scenarios, they are not suitable for site specific models • The existing mobility models are random • They fail to incorporate the effects of operating environments • Even though some models do consider some effects of obstacles and others, they are extremely simple and do not consider the overall social behavioral aspects of the mobile nodes.
UDelModels – Mobility Model • There is little doubt that the existing mobility models are not realistic • Existing mobility models tend to follow some smooth distribution (e.g. Nodes are uniformly distributed) • The nodes tend to be in the center of the region • In reality the nodes are restricted to streets, sidewalks outdoors and hallways and office (residence, store) locations indoors • Nodes tend to move in clusters • This is due to the faster nodes catching up with the slower nodes and not passing them • Due to the traffic lights
UDelModels – Mobility Model • UDel mobility model is based on three well studied fields namely • Urban Planning • Meeting Analysis • Time use study • The mobility models assumes a three layered approach • Activity model • Task model • Agent model
UDelModels – Mobility Model • Activity Model • Describes the high level activity type of a mobile node • Based on the U.S. Bureau of Labor Statistics 2003 “Time Use Study” • Based on the data collected from more than 20,000 people. (Of them 5000 were urban residents) • This model describes basic activities such as • Working • Eating not at work • Shopping • At home etc
UDelModels – Mobility Model • Activity Model • 1. Select a home and office. • 2. The arrival time at work is determined. • 3. The duration at work is determined. • 4. Determine if a break from work is taken. If yes go to step 5 • 5. The break start time is determined. • 6. The number of activities performed during a break is determined • 7. Which activities are performed during the break is determined. • 8. The duration of each activity is determined. • 9. The arrival time back at work is determined and it is determined that a break is taken again. If so, steps 5-9 are repeated.
Task Model The task model consists of the tasks performed during different activities Examples Meetings during office hours Activity eating consists of going to a restaurant Etc. Agent Model Inter-node speed distance relationships Lane changing UDelModels – Mobility Model
Things to consider when simulating wireless networks Environment under which the network operates Node Mobility Propagation Model
2 2 added attenuation 1 1 0 0 0 500 1000 1500 0 100 200 distance between transmitter and receiver (meters) Propagation model • Free-space model • Two-ray model – occurs when there is LOS between sender and receiver • Other empirical models such as Okamura-Hata model
UDelModels – Propagation model • The main factors that affect the probability of a packet error rate are • Signal strength, Delay spread, Doppler spread and noise (includes interference) • The signal strength at a receiver is given by Preceived=Ptransmitted*C*PL • A large volume of research has shown that signals can be modeled as rays • These rays reflect of the ground and walls, diffracts around the corners and gets transmitted through the walls • PL = 1/d2*Attenuation • Attenuation is a complex number that depends on the effects of reflection diffraction and transmission • The signal strength can be determined by finding the lengths of all the rays that hit the receiver and the attenuation experienced by them • Attenuation and change in phase due to reflection or transmission requires the knowledge of the frequency, polarization of the signal, angle of incidence, thickness and the type of material that is reflecting or transmitting the signal through
The propagation model uses the technique of Beamtracing, vertical plane rays and other techniques The ground plane is divided into uniform grid and the walls are divided into discrete uniform sized tiles The computation is divided into two parts Pre Processing In this part all the ray-neighbors of a wall tile are found Beamtracing This is carried out in a BFS manner with each beam continued to be reflected, transmitted, diffracted and/or sub-divided until the beam exits the modeled area or the pathloss surpasses the threshold The Beamtracing can be carried out indoors and outdoors (but Beamtracing exceeds the computational ability due to number of walls) UDelModels – Propagation model
UDelModels – Propagation model • Computational Complexity • Accuracy
Pathloss comparison for Raytracing and Measurement 100 Pathloss data from Raytracing Pathloss data from Measurement bushes bridge large air conditioners 80 E F I F D Source C arch way E H 60 G Pathloss in dB building B building street 40 I H G trees building building D 20 A street A B B A C A 0 0 200 400 600 800 1000 Distance in meters arch way Pathloss comparison for Raytracing and Measurement 70 Pathloss data from Raytracing 60 Pathloss data from Measurement 50 Pathloss in dB 40 30 20 10 0 20 30 40 50 60 70 Distance in meters UDelModels – Propagation model
Indoor Propagation Model • Attenuation factor model • The Beamtracing indoors in a large section of city exceeds today’s computational abilities • It has been found that AF model can be used for propagation indoors, with a fair accuracy • It has been shown that the model can provide realistic pathloss estimates with an error of less than 4dB
Pathloss comparison for Model and Measurement 90 Pathloss Data from Model Pathloss Data from Measurement 80 70 60 X 23 24 Pathloss in dB 50 20 1 15 19 5 10 40 21 22 30 20 10 0 2 4 6 8 10 12 14 16 18 20 22 24 Measurement Points Indoor Propagation Model
Big Picture • Number of cities are planning to deploy large scale mesh networks to provide ubiquitous internet access to the residents • They are also aimed at supporting applications ranging from monitoring and controlling vehicular traffic to assisting emergency response and remote situation assessment • Market research indicates that the mesh networks will grow to a multi-billion dollar industry with in next few years • The performance of such networks have never been studied before through simulations or any other means • Past research work has focused mostly on wireless ad-hoc networks with a few mobile nodes operating in an area of 500x500 m2. • Also in most cases the propagation and the mobility models used are far from reality
Mesh Networks ? Wireless links Very high bandwidth wired links Base-station with Internet connectivity Fixed wireless relays
Performance Criteria • Coverage • Coverage is the first issue that arises when considering the wireless networks • Achievable bit rate • 802.11b/g physical layer is used • Application performance • Web like file transfers • Voice over IP • Streaming media
Simulations • We try to evaluate the performance of the Urban mesh networks with realistic mobility and propagation models • We use UDelModels suite of simulation tools for this performance evaluation • Qualnet is used as the simulator for evaluating the performance of the application protocols • The propagation model and the mobility models are incorporated into the Qualnet simulator
Simulation Parameters • Mobility parameters • Simulations are conducted with 12,000 people with 1600 acting as mobile nodes • This affects the way and the speeds at which the mobile nodes move • This simulates the realistic clustering of nodes • Simulations are conducted at different times in the day • 11:30AM • 12:30PM • 02:00PM • The above times are of significant importance because most of the people would have arrived at work and some are still arriving • The people who have arrived at will be taking breaks • Simulations start 60 minutes prior to the sampling time • The sampling time duration is 20 minutes • Primarily office going and taking breaks for shopping and lunch activities are considered • The speed with which a node moves is uniformly distributed between 1.6 and 4.0 miles per hour
Simulation Parameters • Simulation environment • 4 different cities with varying building densities are modeled • A section of Paddington area in London • Area = 1000m x 1000m • Number of buildings = 130 • University of Delaware campus • Area = 1700m x 1500m • Number of buildings = 140 • Idealized Grid City • Area = 800m x 800m • Number of buildings = 56 • A section of city core of Chicago • Area = 3000m x 3000m • Number of buildings = 270 • Indoor structures • Office, Office/Stores, Residences, Residence/Stores, Stores
Simulation Parameters • Infrastructure node density • The infrastructure nodes are assumed to mounted on the lamp-posts at a height of 6 meters
Simulation Parameters • Propagation model • Realistic 3D Beamtracing is used • The pathloss trace file for the simulation is obtained from the mobility scenario • This pathloss trace file is used by Qualnet as a pathloss model • The transmissions are assumed to at 15dBm
Simulation Scenarios • Simulations were conducted in all the four different urban settings • Each scenario was simulated for 100 trial points and averaged • The AODV protocol in Qualnet simulator was modified to operate in both wired and wireless environments • The routing protocol was modified in such a way that wired links always had lower cost than the wireless links (both for fixed wireless relays and mobile relay nodes)
Coverage • We examine the fraction of the mobile nodes that are able to communicate with the wired network • The coverage is complicated by the fact that buildings are able to reflect, diffract and transmit the signal • Density of the infrastructure nodes play an important role in the coverage • In this study we evaluate the coverage of the mesh networks in presence of infrastructure nodes of varying densities • Another factor that affects the coverage is the fact that mobile nodes can act as relays or not • This has a significant impact when the density of the infrastructure nodes is sparse • The physical layer model used also impacts the coverage • The higher the bit rate, lower the coverage (higher bit rates require less losses) • The position of the nodes (indoor/outdoor) has a significant impact on the coverage • The outdoor nodes can communicate fairly easily with the infrastructure nodes • The indoor nodes cannot communicate easily with the infrastructure nodes due to the fact that signal has to penetrate through the exterior wall and a lot more interior walls
any number of mobile hops no mobile hops Outside Inside Any 1 1 1 Fraction connected at 54Mbps – (-69dBm) 0.5 0.5 0.5 0 0 0 50 75 150 300 50 75 150 300 50 75 150 300 1 1 1 Fraction connected at 11Mbps (-85dBm) 0.5 0.5 0.5 0 0 0 50 75 150 300 50 75 150 300 50 75 150 300 1 1 1 Fraction connected at 1Mbps – (-93 dBm) 0.5 0.5 0.5 0 0 0 50 75 150 300 50 75 150 300 50 75 150 300 Distance between stations (m) Coverage • Performance
6 x 10 outside inside any 15 Bits/Second 10 5 0 1 2 3 4 5 6 7 8 9 1 2 3 4 5 6 7 8 9 1 2 3 4 5 6 7 8 9 Scenario Scenario Scenario Achievable Bit Rates • The maximum achievable bit rate of a single flow is given by the maximum achievable bit rate of the weakest link • The achievable bit rate increases as the density of the infrastructure nodes increase
Application Performance • The important aspect of this performance study is to see whether the coverage and achievable bit rates translate into application performance • Even though the channels allow for good bit rate, that link might not be used by the routing protocol • Even if the route is found, the end-to-end performance might still not support a particular application (e.g. TCP requires the loss probability to be less that at least 10%) • Three popular web applications are considered • Web like file transfer • Voice over IP • Streaming Media • These three applications have different performance requirements
Inside Outside 1 Fraction 0.5 0 1 2 3 4 5 6 7 8 9 1 2 3 4 5 6 7 8 9 Scenario Scenario Fraction of TCP connections completed Web Like File Transfer • Simulations assume that the file sizes are distributed according to the log-normal distribution • The first thing to consider as a performance criteria is the fraction of successful file transfer
Web Like File Transfer • By looking at the coverage plot and the previous plot, we find that the fraction of successful file transfer is highly correlated to the coverage (Correlation Coefficient = 0.84) • The fraction of nodes that can communicate with the wired network is 25% more that the fraction of successful file transfer • Also the fraction of successful file transfer without the help of mobile relays is 15% more than the fraction of nodes that can connect to the wired network • Thus it seems that the availability of mobile nodes acting as relay is not that helpful in this scenario
1 Hop 2 Hops 3 Hops 0.8 Inside Outside Inside Outside 1 0.6 Number 0.4 Fraction 0.5 0.2 0 1 2 3 4 5 6 7 8 9 1 2 3 4 5 6 7 8 9 0 Scenario Scenario Average number of route changes 1 2 3 4 5 6 7 8 9 1 2 3 4 5 6 7 8 9 Scenario Scenario Number of mobile hops in the route Web Like File Transfer • The next factor to consider is the relation between the average number of route changes and the number of mobile hops in the flow • As the number of mobile hops increase the average number of route changes increase • The correlation coefficient was found to be -0.81 • This is one of the biggest drawbacks of having the mobile nodes as relays
Voice over IP • Hand held VoIP phones are already available in the market • Ubiquitous internet access could provide low cost mobile phone service provided the quality is sufficiently high • The most important factors to consider while evaluating the VoIP performance are • MOS : Mean Opinion Score • Time to establish the connection
Inside Outside 1 Good Calls Fraction Bad Calls 0.5 Failed Calls 0 1 2 3 4 5 6 7 8 9 1 2 3 4 5 6 7 8 9 Scenario Scenario Performance of VoIP Voice over IP • The above figure shows the fraction of calls that were good, that were bad and calls that did not complete • The calls that took more than 10 seconds to establish were termed as failed calls • The Calls that had a delay of more than 5s or an MOS value < 3.6 were termed bad calls • It is interesting to note that in scenario 1 and 2, the indoor nodes tend to perform better than the outdoor nodes • This is due to the fact that indoor nodes do not have significant mobility. Hence once the call gets established it tends to have a good quality in contrast to the outdoor nodes which are always mobile • It is also interesting to note that with decreasing infrastructure density, the outdoor nodes establish the calls, but are unable to maintain a steady connection. (Fraction of bad calls increase)
Streaming Media • Another possible application • Unlike the VoIP, streaming media applications can tolerate significant delays provided the receiver buffer is big enough • Another difference is that streaming music requires more bandwidth than the VoIP applications • Using this application we try to evaluate the system with respect to the network outages
Inside Outside 1 Outage < 5Sec Fraction 5Sec Outage < 20Sec 0.5 Outage 20Sec Failed Connections 0 1 2 3 4 5 6 7 8 9 1 2 3 4 5 6 7 8 9 Scenario Scenario Fraction of connections undergoing outages Streaming Media • The above diagram shows the fraction of connections undergoing outages • It is interesting to note that the fraction of connections that undergo outages between 5 and 20 seconds is very small • Hence increasing the receiver buffer capacity from 5s to 20s is not going to have a significant impact on the delay tolerance • Figure also shows that a significant fraction of the connections underwent outages more than 20s • From application perspective even these connections should be considered as failed connections
15 Inside Outside 10 Time in Seconds 5 0 1 2 3 4 5 6 7 8 9 1 2 3 4 5 6 7 8 9 Scenario Scenario Time taken to establish route Time To Establish Route • This is one of the performance measures that affects all the applications • The call establishment time cannot be greater than 10s for VoIP • If the connection establishment time is too high, TCP connection times out • Intermittent route failures and subsequent route re-establishments taking long time could render a streaming connection or VoIP application as failed
Conclusions • The above results indicated some of the challenges facing the ubiquitous internet access via mesh networks • Philadelphia has plans of having infrastructure nodes separated by 300m • The above results indicate that most of the applications wont perform well in such a scenario • The coverage and the bit rate plots most of the time contradicts the application performance • Hence coverage alone cannot be taken as a good indicator of performance • Under low infrastructure densities, having the mobile nodes act as relays increases the coverage substantially e.g. most of the cases it increases by 100% in scenario 9 • Even though 90% of the nodes outside are connected, only 50%-60% of the indoor nodes are connected in cases where the separation distance >= 75m • While a slightly modified version of AODV was used for the simulations, more research needs to be put into the routing protocols for these networks • MIMO, directional antennas, Co-operative networking are all promise to increase the coverage
References • [1] S. Cass, “Viva mesh vegas,” IEEE Spectrum, 2005. • [2] “Zyxel 802.11 VoIP phone "http://www.zyxel.com/product/P2000W.php".” • [3] “Vipernet wi-fi VoIP phone "http://www.vipernetworks.com/".” • [4] D. Neff, “Wireless philadelphia town hall meeting,” November 2004, available at http://207.245.67.199/philagotit/wifilive2.wmv. • [5] A. Motley and J. Keenan, “Radio coverage in buildings,” britsh telecom technical journal, vol. 8, pp.19—24, 1990. • [6] S. Y. Seidel and T. S. Rappaport, “A ray tracing technique to predict path loss and delay spread inside buildings,” in IEEE GLOBECOM, 1992, pp. 1825—1829. • [7] J. Kim and S. Bohacek, “A survey-based mobilty model of people for simulation of urban mesh networks,” in Submitted, 2005, available at http://www.eecis.udel.edu/ bohacek.
References • [8] H. Bertoni, Radio Propagation for Modern Wireless Systems. Prentice Hall, December 1999. 17 • [9] G. Liang and H. L. Bertoni, “A new approach to 3-d ray tracing for propagation prediction in citiee,” IEEE transaction on Antennas and propagation, vol. 46, pp. 853—863, 1998. • [10] V. Sridhara and S. Bohacek, “Propagation modeling for urban mesh networks,” in Submitted, 2005. • [11] D. A. McNamara, C.W. Pistorius, and J. A. G. Malherbee, Introduction to Uniform Geometrical Theory of Diffraction. Artech House, 1990. • [12] S. Ray, “Realistic mobility for MANET simulation,” Master’s thesis, The University of British Columbia, 2003. • [13] D. Batacharjee, A. Rao, C. Shah, M. Shah, and A. Helmy, “Empirical modeling of campus-wide pedestrian mobility: Observation on the USC campus,” in IEEE Vehicular Technology Conference (VTC), 2004.