Download
1 / 1

E N D
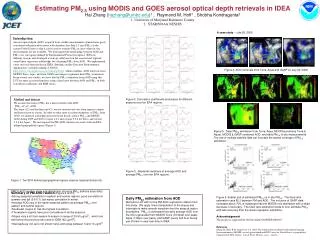
A case study -- July 20, 2008 Introduction Aerosol optical depth (AOD) acquired from satellite measurements demonstrates good correlation with particulate matter with diameters less than 2.5 m (PM2.5) in the eastern United States so that it can be used to estimate PM2.5in areas where in situ measurements are not available. We investigated the relationship between AOD and PM2.5over ten regions defined by Environmental Protection Agency (EPA) in different seasons and developed a look-up-table based on the seasonal and regional varied linear regression relationship for estimating PM2.5from AOD. We implemented a new near real-time product in IDEA (Infusing satellite Data into Environmental Applications) currently running at NOAA (http://www.star.nesdis.noaa.gov/smcd/spb/aq/), which combines AOD retrievals from MODIS Terra, Aqua, and from GOES east imager to generate daily PM2.5estimations. From several case studies, we show that the PM2.5estimations from AOD using this LUT are more accurate than those using a fixed ratio between AOD and PM2.5 in both correlation coefficients and RMS errors. Estimating PM2.5 using MODIS and GOES aerosol optical depth retrievals in IDEAHai Zhang (hazhang@umbc.edu)1 , Raymond M. Hoff1 , Shobha Kondragunta21. University of Maryland Baltimore County2. STAR/NOAA NESDIS Figure 4. AOD retrievals from Terra, Aqua and GASP on July 20, 2008. Aqua MODIS Terra Method and dataset We assume that surface PM2.5has a linear relation with AOD: PM2.5 =C1+C2 AOD. The slope (C2) and the intercept (C1) are not constant and vary from region to region and from season to season. In order to make more accurate estimations of PM2.5 from AOD, we analyzed a matchup dataset between hourly surface PM2.5 and MODIS AOD during 2005 and 2006 (version 4.0.1 and version 5.2.6 for Terra, and version 5.2.6 for Aqua). We investigated the PM-AOD relation over each of the ten EPA-defined geographical regions (Figure 1). Figure 2. Correlation coefficients and slopes for different seasons over ten EPA regions. Terra MODIS & GASP Figure 5. Daily PM2.5 estimation from Terra, Aqua, MODIS(combining Terra & Aqua), MODIS & GASP combined AOD, and daily PM2.5 in situ measurements. The use of multiple satellite data can increase the spatial coverage of PM2.5 estimation. MODIS MODIS Figure 3. Seasonal variations of average AOD and average PM2.5 over ten EPA regions. Figure 1. Ten EPA defined geographical regions used as regional division for PM2.5-AOD relation study and distribution of hourly PM2.5 stations (blue dots). MODIS & GASP MODIS & GASP • Summary of PM-AOD relation (Figure 2 and 3) • Strong seasonal variations in eastern and central regions: good correlation in summer and fall (0.6-0.7), but worse correlation in winter. • Average AOD vary in the same seasonal pattern as average PM2.5 over eastern and central regions. • Southeast (region 4) has the highest correlation. • The western regions have poor correlations in all the seasons. • Slopes vary a lot from season to season in range of 20-50 g/m3, which are well below the previous ratio used in IDEA (62 g/m3). • Intercepts are not zero (not shown here) and range between 3 and 14 g/m3. Figure 6. Scatter plot of estimated PM2.5 vs in situ PM2.5. The fixed ratio estimation uses 62:1 between PM and AOD. The inclusion of GASP data increases about 70% of matchups than the MODIS only estimation with a slight decrease of accuracy. The fixed ratio estimation tends to over estimate PM2.5 with less accuracy than the linear regression estimation. Daily PM2.5 estimation from AOD We built a LUT with for the PM-AOD regression relation from this study. We apply linear interpolation of the slopes and intercepts to make smooth transition over the areas at region boundaries.PM2.5 is estimated from daily average AOD over the US is generated from MODIS Terra (10:30am over pass), Aqua (1:30pm over pass), and GASP (every half hour during sun-lit time) in near real-time in IDEA. Acknowledgement The project is supported by NOAA grant NA09NES4400010. Reference Zhang, H., Hoff, R.M., Engel-Cox, J.A. 2009: The relation between Moderate Resolution Imaging Spectroradiometer (MODIS) aerosol optical depth and PM2.5 over the United States: a geographical comparison by EPA regions, J.Air & Waste Manage. Assoc., in press.


