Download

1 / 13
130 likes | 200 Views
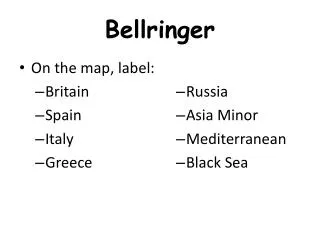
Bellringer. Objectives. Describe how the size and growth rate of the human population has changed in the last 200 years. Define four properties that scientists use to predict population sizes. Make predictions about population trends based on age structure.

E N D
Objectives • Describehow the size and growth rate of the human population has changed in the last 200 years. • Definefour properties that scientists use to predict population sizes. • Makepredictions about population trends based on age structure. • Describethe four stages of the demographic transition. • Explainwhy different countries may be at different stages of the demographic transition.
Studying Human Populations • Demographyis the study of the characteristics of populations, especially human populations. • Demographers study the historical size and makeup of the populations of countries to make comparisons and predictions. • Demographers also study properties that affect population growth, such as economics and social structure.
Studying Human Populations • Countries with similar population trends are often grouped into two general categories: developed and developing countries. • Developed countries have higher average incomes, slower population growth, diverse industrial economies, and stronger social support systems. • Developing countries have lower average incomes, simple and agriculture-based economics, and rapid population growth.
The Human Population Over Time • The human population underwent exponential growth in the 1800s, meaning that the population growth rates increased during each decade. • These increases were mostly due to increases in food production and improvements in hygiene that came with the industrial and scientific revolution. • However, it is unlikely that the Earth can sustain this growth for much longer.
Age Structure • Age structureis the classification of members of a population into groups according to age or the distribution of members of a population in terms of age groups and helps demographers make predictions. • Countries that have high rates of growth usually have more young people than older people. • In contrast, countries that have slow growth or no growth usually have an even distribution of ages in the population.
Age Structure • Age structure can be graphed in a population pyramid, a type of double sided bar graph. • The figure on the following slide shows typical age structures for countries that have different rates of growth.
The Demographic Transition • The demographic transitionis the general pattern of demographic change from high birth and death rates to low birth and death rates, and observed in the history of more-developed countries. • The theory behind the demographic transition is that industrial development causes economic and social progress that then affects population growth rates.
Stages of the Transition • In the first stage of the demographic transition, a society is in a preindustrial condition. The birth rate and the death rate are both at high levels and the population size is stable. • In the second stage, a population explosion occurs. Death rates decline as hygiene, nutrition, and education improve. But, birth rates remain high, so the population grows very fast.
Stages of the Transition • In the third stage, population growth slows because birth rate decreases. As the birth rate becomes close to the death rate, the population size stabilizes. However, the population is much larger than before the demographic transition. • In the fourth stage, the birth rate drops below replacement level, so the size of the population begins to decrease. • It has taken from one to three generations for the demographic transition to occur.