Download
1 / 93
1.19k likes | 2.12k Views
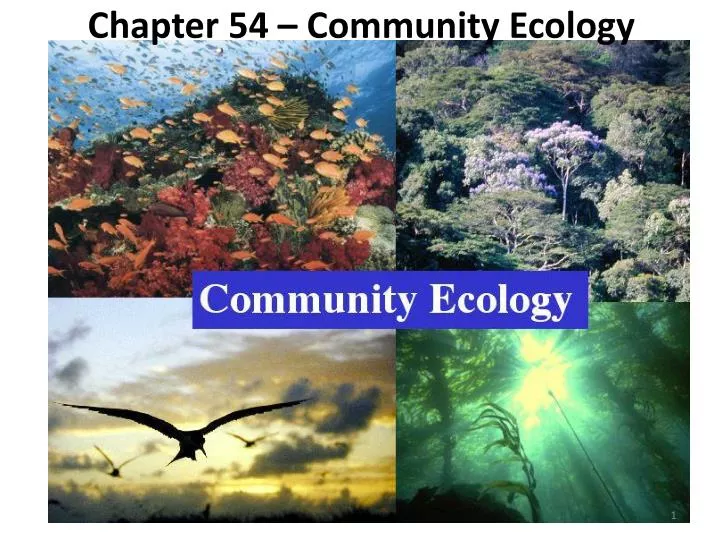
Chapter 54 – Community Ecology. Concept 54.1: Community interactions are classified by whether they help, harm, or have no effect on the species involved. Ecologists call relationships between species in a community interspecific interactions Can you name some examples?

E N D
Concept 54.1: Community interactions are classified by whether they help, harm, or have no effect on the species involved • Ecologists call relationships between species in a community interspecific interactions • Can you name some examples? • How about these: competition, predation, herbivory, symbiosis (parasitism, mutualism, and commensalism), and facilitation • Interspecific interactions can affect the survival and reproduction of each species, and the effects can be summarized as positive (+), negative (–), or no effect (0)
Competition (–/– interaction) : • When one or more individuals depend on the same resource, competition arises. • Competition can be intraspecific (between members of the same species) or interspecific (between different species who rely on the same resource). http://darwinsdarlings.blogspot.com/2013/02/darwins-finches-as-evidence-of.html Intra-specific competition for food led to adaptive radiation of beak shapes in the evolution of the Galapagos finches.
Competitionfor mates is another example of intra-specific competition and another driving force behind evolution. http://www.youtube.com/watch?v=C7HCIGFdBt8 In this video, you can see two male giraffes fighting with their heads. It is thought that the long neck of the giraffe evolved not only as a consequence of reaching higher food (also intra-specific competition with other giraffes), but as an advantage in fights for mates and territory. Longer necks and bigger heads allow for HARDER HITS!!
Competition: • In the rainforest, different types of trees compete for light by growing taller, wider, or producing more foliage. This is at the expense of other smaller species. • Smaller species driven by evolution to be more efficient at lower light intensities. http://rainforests.mongabay.com/0201.htm
Competition: • Competition for food, water, nesting sites, and hunting grounds are also common types of interspecific competition. http://www.youtube.com/watch?v=3IwDHvNxjJo In this video, a cheetah mother protects her young from a lion attack. The cheetah and lion compete with each other for food, though the lion will try to kill the young of other big cats if possible.
Competitive Exclusion • Strong competition can lead to competitive exclusion, local elimination of a competing species • The competitive exclusion principle states that two species competing for the same limiting resources cannot coexist in the same place
Competitive exclusion principle: • “No two species can occupy the same niche for extended periods of time” • If two species share a niche, this leads to inter-specific competition for resources. • Inevitably, one species will have an advantage over the other. • The less well adapted species will struggle to survive and reproduce. • It will inevitable be eliminated by: compete or total extinction, or population may migrate
Competitive exclusion principle example: The Eurasian red squirrel (S. vulgaris) has suffered competitive exclusion due to the introduction of the Eastern grey squirrel (S. carolinensis) to the UK from the USA. S. Carolinensis is larger, stronger, and can store more fat in winter, making it better able to survive and reproduce. It is more tolerant of habitat change than S. vulgaris The red squirrel is now protected in many areas.
Ecological Niches and Natural Selection • The total of a species’ use of biotic and abiotic resources is called the species’ ecological niche • An ecological niche can also be thought of as an organism’s ecological role • Ecologically similar species can coexist in a community if there are one or more significant differences in their niches
The Niche Concept: • A niche is the specialized habitat of an organism including: • Space and territory • Nutrition and feeding habits • Interactions and relationships with other organisms • Reproductive habits • It role and impacts in the habitat or ecosystem. • Only one species or population can occupy the same niche for extended periods of time. • Example:Amphiprionocellaris • Habitat: In specific anemone types only, tropical reefs. • Nutrition: Copepods, plankton & undigested food from anemone (omnivores) • Predators: Larger fish species • Interactions: Mutualism with anemones: • Anemone provides protection and some food • Clownfish provides food (feces), cleans and circulates water around the anemone. • Reproduction: All born male. Dominant male becomes female and lays eggs on flat areas near the anemone.
GF Gause’s experiments into Niches Paramecium is a genus of protists. Gause cultured two species: P. aurelia & P. caudatum When grown alone under ideal conditions (fundamental niche), each population grew to a higher maximum. When grown together under the same conditions, one population would typically dominate and the other would die off. http://ggause.com/gfg05.htm These results are a great example of realized niches vs. fundamental niches and led to the competitive exclusion principal.
Resource partitioning is differentiation of ecological niches, enabling similar species to coexist in a community • Niche partitioning can be spatial (dividing up space), morphological (different shapes or structures), or temporal (different times of the day or year).
A. distichus perches on fence posts and other sunny surfaces. A. insolitus usually perches on shady branches. Figure 54.2 A. ricordii A. insolitus A. aliniger A. christophei A. distichus A. cybotes A. etheridgei
A species’ fundamental niche is the niche potentially occupied by that species. The full range of environmental and social conditions under which it could potentially survive and reproduce. • A species’ realized niche is the niche actually occupied by that species with the limitations of other species being present. • As a result of competition, a species’ fundamental niche may differ from its realized niche • For example, the presence of one barnacle species limits the realized niche of another species
EXPERIMENT Figure 54.3 High tide Chthamalus Chthamalus realized niche Balanus Balanus realized niche Ocean Low tide RESULTS High tide Chthamalus fundamental niche Ocean Low tide
The common spiny mouse and the golden spiny mouse show temporal partitioning of their niches • Both species are normally nocturnal (active during the night) • Where they coexist, the golden spiny mouse becomes diurnal (active during the day) The golden spiny mouse (Acomysrussatus)
Character Displacement • Character displacement is a tendency for characteristics to be more divergent in sympatric populations of two species than in allopatric populations of the same two species • An example is variation in beak size between populations of two species of Galápagos finches
G. fuliginosa G. fortis Figure 54.4 Beak depth Los Hermanos 60 40 G. fuliginosa, allopatric 20 0 60 Daphne 40 G. fortis, allopatric Percentages of individuals in each size class 20 0 Sympatric populations 60 Santa María, San Cristóbal 40 20 0 8 10 12 14 16 Beak depth (mm)
Predation • Predation (+/– interaction) refers to an interaction in which one species, the predator, kills and eats the other, the prey • Some feeding adaptations of predators are claws, teeth, fangs, stingers, and poison
Predation: • A consumer kills and eats another consumer. • Predators have evolved adaptations to best equip it for finding, chasing, catching, killing and eating or digesting its prey. Crocodiles hunt wildebeest http://www.youtube.com/watch?v=PiG3yokCOug http://www.arkive.org/collared-anteater/tamandua-tetradactyla/image-G81304.html The giant anteater has an extended nose and a VERY long tongue for foraging for ants and termites.
Prey display various defensive adaptations • Behavioral defenses include hiding, fleeing, forming herds or schools, self-defense, and alarm calls • Animals also have morphological and physiological defense adaptations • Cryptic coloration, or camouflage, makes prey difficult to spot Sea Horses
Figure 54.5 (a) Cryptic coloration (b) Aposematic coloration Canyon tree frog Poison dart frog (c) Batesian mimicry: A harmless species mimics a harmful one. (d) Müllerian mimicry: Two unpalatable species mimic each other. Hawkmoth larva Cuckoo bee Yellow jacket Green parrot snake
Animals with effective chemical defense often exhibit bright warning coloration, called aposematic coloration • Predators are particularly cautious in dealing with prey that display such coloration Poison dart frog (b) Aposematic coloration
In some cases, a prey species may gain significant protection by mimicking the appearance of another species • In Batesian mimicry, a palatable or harmless species mimics an unpalatable or harmful model (c) Batesian mimicry: A harmless species mimics a harmful one. Hawkmoth larva Green parrot snake
Herbivory • Herbivory (+/– interaction) refers to an interaction in which an herbivore eats parts of a plant or alga • It has led to evolution of plant mechanical and chemical defenses and adaptations by herbivores
Symbiosis • Symbiosis is a relationship where two or more species live in direct and intimate contact with one another. • Can you name some of the types?
Parasitism • In parasitism (+/– interaction), one organism, the parasite, derives nourishment from another organism, its host, which is harmed in the process • Parasites that live within the body of their host are called endoparasites • Parasites that live on the external surface of a host are ectoparasites
Parasitism: • A symbiotic (co-living) relationship. • Parasites gain an advantage at the cost of the host which may be killed. • We usually consider only eukaryotes as parasites. Bacteria and viruses we count as infections diseases. Jewel wasps turn cockroaches into ‘zombies’ and lay their eggs inside them http://www.youtube.com/watch?v=9fO0zHiAIG8
Parasitism: • Some common human examples are tapeworms, roundworms, and malaria (caused by Plasmodium falciparum) Loa loafilariasis (african eye worm) Hookworms – Intestinal mucosa The hookworm is much smaller than a tapeworm. These parasites are rarely more than a centimeter long, and burrow into your small intestine to feast on your blood. Since hookworms latch onto your small intestine and divert nutrients away from the bloodstream, they're actually more problematic than tapeworms. Hookworm infection can lead to anemia, slower cognitive growth, and malnutrition.
Mutualism • Mutualistic symbiosis, or mutualism (+/+ interaction), is an interspecific interaction that benefits both species • A mutualism can be • Obligate, where one species cannot survive without the other • Facultative, where both species can survive alone Clownfish and Sea anemone Ant Army Defends Tree
Figure 54.7 (a) Acacia tree and ants (genus Pseudomyrmex) (b) Area cleared by ants at the base of an acacia tree
Commensalism • In commensalism (+/0 interaction), one species benefits and the other is neither harmed nor helped • Commensal interactions are hard to document in nature because any close association likely affects both species
Facilitation • Facilitation (/ or 0/) is an interaction in which one species has positive effects on another species without direct and intimate contact • For example, the black rush makes the soil more hospitable for other plant species Number of plant species (a) Salt marsh with Juncus (foreground) With Juncus Without Juncus
Concept 54.2: Diversity and trophic structure characterize biological communities • In general, a few species in a community exert strong control on that community’s structure • Two fundamental features of community structure are species diversity and feeding relationships
Species Diversity • Species diversity of a community is the variety of organisms that make up the community • It has two components: species richness and relative abundance • Species richness is the number of different species in the community • Relative abundance is the proportion each species represents of all individuals in the community
Figure 54.10 A B C D Community 1 Community 2 A: 25% B: 25% C: 25% D: 25% A: 80% B: 5% C: 5% D: 10%
Diversity and Community Stability • Ecologists manipulate diversity in experimental communities to study the potential benefits of diversity • For example, plant diversity has been manipulated at Cedar Creek Natural History Area in Minnesota for two decades Figure 54.12
Communities with higher diversity are • More productive and more stable in their productivity • Better able to withstand and recover from environmental stresses • More resistant to invasive species, organisms that become established outside their native range
Trophic Structure • Trophic structure is the feeding relationships between organisms in a community • It is a key factor in community dynamics • Food chains link trophic levels from producers to top carnivores Shark Eating Seal
Figure 54.13 Quaternary consumers Carnivore Carnivore Tertiary consumers Carnivore Carnivore Secondary consumers Carnivore Carnivore Primary consumers Zooplankton Herbivore Primary producers Phytoplankton Plant A terrestrial food chain A marine food chain
Food Webs Figure 54.14 Humans • A food web is a branching food chain with complex trophic interactions Smaller toothed whales Sperm whales Baleen whales Elephant seals Crab- eater seals Leopard seals Fishes Squids Birds Carniv- orous plankton Euphau- sids (krill) Cope- pods Phyto- plankton
Species may play a role at more than one trophic level • Food webs can be simplified by • Grouping species with similar trophic relationships into broad functional groups • Isolating a portion of a community that interacts very little with the rest of the community
Figure 54.15 Juvenile striped bass Sea nettle Fish larvae Fish eggs Zooplankton
Species with a Large Impact • Certain species have a very large impact on community structure • Such species are highly abundant or play a pivotal role in community dynamics
Dominant Species • Dominant species are those that are most abundant or have the highest biomass • Dominant species exert powerful control over the occurrence and distribution of other species • For example, sugar maples have a major impact on shading and soil nutrient availability in eastern North America; this affects the distribution of other plant species
One hypothesis suggests that dominant species are most competitive in exploiting resources • Another hypothesis is that they are most successful at avoiding predators • Invasive species, typically introduced to a new environment by humans, often lack predators or disease
Keystone Species and Ecosystem Engineers • Keystone species exert strong control on a community by their ecological roles, or niches • In contrast to dominant species, they are not necessarily abundant in a community • Observation of sea otter populations and their predation shows how otters affect ocean communities
100 Figure 54.18 80 60 Otter number (% max. count) 40 20 0 (a) Sea otter abundance 400 300 Grams per 0.25 m2 200 100 0 (b) Sea urchin biomass 10 8 Number per 0.25 m2 6 4 2 0 1972 1985 1989 1993 1997 Year (c) Total kelp density Food chain