Download
1 / 15
150 likes | 229 Views
The Latest Stats about computer use. ONS – Internet Access – Households and Individuals Ofcom – The Communications Market Report. 45%. In 2006 of people used a computer daily. 73%. In 2014 this has become. 79%. of 16-24 year olds use a computer daily. 8%.

E N D
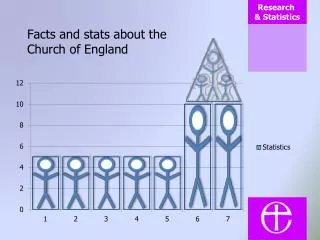
The Latest Stats about computer use ONS – Internet Access – Households and Individuals Ofcom – The Communications Market Report
45% In 2006 of people used a computer daily 73% In 2014 this has become 79% of 16-24 year olds use a computer daily
8% of adults say that they never use a computer of 16-24 year olds say that they never use a computer 1%
35% In 2006 of adults used the Internet daily In 2014 this has become 76% 37.6 million This is people in the UK
13% of adults did not use the Internet in the last 3 months 6.5 million This people in the UK
84% of households have internet access 91% of these households have fixed broadband
58% of adults used their mobile phone to access the internet of 16-24 years olds use their phone to access the Internet 87%
44% of households have a tablet device 14% of households have 2 or more
68% of adults access the Internet ‘on the go’ 96% of 16-24 years olds access the Internet ‘on the go’ More men then women access the Internet ‘on the go’
Internet Activities All 16-24 75% 73% 55% 54% 43% 53% 23% 44% 6% 80% 71% 65% 91% 38% 56% 24% 68% 10% Sending/receiving emails Finding Information Reading online news or magazines Social Networking Travel services Internet Banking Selling Goods Playing games Creating Websites or Blogs
‘Cloud’ Activities All 16-24 35% 16% 35% 49% 26% 61% Store documents Online editors Music or video
Consumers’ relationship with communications technology varies by age, with the highest levels of technological knowledge and confidence found among 14-15 year olds. Children aged 6-15 display a greater enthusiasm and reliance on technology than the adult sample 75% 47%
The average adult in the UK spends over half of their waking hours engaged in media or communications activities. On average, UK adults sleep for in a 24-hour period, while they spend engaged in media or communication activity. 8 hours 21minutes 8 hours 41 minutes
1 hour 24minutes 16-24 year olds who use social media spend on it per day. This compares to per day spent on average by adult social media users. 51 minutes
In adults technology use is in this order TV Laptops/PCs Smartphones With 16-24 year olds this changes to this 16-24 year olds spend on their mobiles 2 hours 36 minutes