Download
1 / 52
530 likes | 661 Views
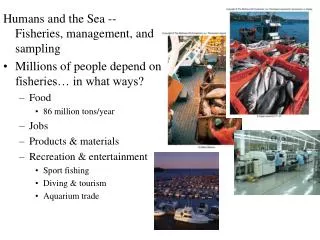
18 Fisheries and Food from the Sea. Notes for Marine Biology: Function, Biodiversity, Ecology By Jeffrey S. Levinton. Fisheries. Relatively primitive form of food acquisition - hunting and gathering

E N D
18 Fisheries and Food from the Sea Notes for Marine Biology: Function, Biodiversity, Ecology By Jeffrey S. Levinton
Fisheries • Relatively primitive form of food acquisition - hunting and gathering • Fishery is potentially a renewable resource - resource exploitation at certain levels need not deplete the resource • Crucial objective is to develop an appropriate management program to avoid overexploitation
Stock - a key concept • Stock - a fishery species is divided into stocks, which are populations that are geographically definable and consisting of individuals responding to similar environmental factors • Stock - is also a fisheries management unit (nursery, feeding area, political boundaries, fishing limits)
Identification of Stocks • Tags - utility depends on rate of recovery, time period that they last, define movement • Biochemical and molecular markers - identify different stocks (analysis important) that have become genetically isolated and distinct • Stock identification important in societal disputes about fishing policy
A striped bass, Morone saxatilis, tagged ventrally with an internal tag
Gulf Coast bands Atlantic bands Mitochondrial DNA markers used to identify stocks of Striped Bass, Morone saxatilis
Life History and Stock Size • The life history of a fishery species and the size of the stock must be understood before sensible planning can be done regarding fishery management • Stock size could be surveyed by scientific surveys, BUT • The size of a stock is mainly assessed by quantity of landings by fishers, which is principally a function of the population size, the spatial variability of the fish, and the amount of fishing effort • Fishing effort is the amount of effort per fish caught, including number of boats and fishers, hours per fisher per unit time, type of gear; fishng effort can also be estimated by fuel consumed
Landings by year of the blue whale, as compared with effort Catch per catcher-day’s work 1931 32 40 47 50 60 1963 Year
Crucial Life History Information Needed • Physiological limiting factors • Spawning/nursery habitat • Feeding areas • Migration routes • Biological information that minimizes unintended mortality during fishing
To produce a good fisheries model, we must account for all contributions to reproduction, growth, and mortality throughout the life cycle of the fishery resource species
Fisheries Model • Model of population change • Must know life history: the mode of reproduction, the number of young produced, the survivorship, growth periodicity (seasonal), rate of growth
Age, Origin - Crucial Data • Age: size distributions, growth bands (otoliths) • Origin - tags, transmittors, trace element chemistry of otoliths (Thorrold et al. 2000 Can J. Fish Aquatic Sci.) 57: 1232-1242 [laser ablation - mass spectrometry - Mn, Sr, Ca variation in various locations]
A cross section of an otolith of the bluehead wrasse Thalassoma bifasciatium that settled from the plankton at a length of 13 mm; growth record reveals the 41-day mark after hatching, when settlement on the bottom occurred (transition between closely spaced lines and relatively broad band); otolith is about 300 μm long
Identification of age classes by size: lobster Panuliris ornatus
Model of Fishery Population The health of a stock can be assayed by its production, which is explained in terms of growth of previous year classes and recruitment into the new year class W = Wt-1- MW t-1 + RW t-1 + GW t-1 W = change of mass M = mortality proportion R = reproduction proportion G = growth proportion
Stock Recruitment Models • Objective: predict recruitment (the number of newly born that enter and are noticed in the first year class - 0+ ) • Prediction from previous year’s stock • Model premise: density dependence - reproduction declines with increasing density • Therefore: recruitment increases with increasing stock size up to a point, then decreases
120 40 80 0 Recruitment Density-dependent effects 0 400 800 1200 1600 Stock in previous year Stock-recruitment model
Logistic model: model that can describe declining recruitment at increasing population density
Maximum Sustainable Yield Model • Based on idea that a fishery stock will grow at a slower rate over a certain stock size • Fish the stock down to the population level where growth is maximal • Leads to management tool to determine fishing pressure • Not much evidence that this approach works, even if the theory makes some sense • Problem might be that factors other than simple density dependence affect stock size
Fishing and Evolutionary Response • Fishing can exert evolutionary changes in life history on fished populations • If there is genetic variation for growth rate, size specific fishing can change genetic variation in population • Harvest larger-sized individuals, get dominance of smaller individuals • Might lead to lower fish production, because of dominance of genotypes causing smaller size/growth rate See Conover and Munch 2002, Science
Fishing Techniques • Hooking fishes individually - e.g., long lines with rows of hooks • Entangling fishes in nets - e.g., large drift nets, nets towed below the surface and kept open with wooden boards • Traps - e.g., baited lobster traps kept on bottom
Bycatch Unintended catch, may be discarded overboard, set aside for other purposes, such as fish meal Constitutes much of world catch Example: sea turtles, trapped in shrimp nets, may drown while netted and brought aboard Solution: turtle-exclusion device (TED), encourages turtles to swim away through escape hatch before being trapped
Stock Reduction - Factors • Environmental change • “Random factors” • Overfishing
Vulnerable Resource Species • Long generation times (e.g., whales) • Low fecundity (e.g., many shark species) • Geographically confined populations (aggregations or geographic range in a confined area) • Easily caught • Top or apex carnivores (less abundant)
Relative declines among shark species are shown by setting starting abundance at 1; coastal shark species: (a) hammerhead, (b) white, (c) tiger, and (d) coastal shark species identified from 1992 onward; oceanic shark species: (e) thresher, (f) blue, (g) mako, and (h) oceanic whitetip
Causes of Stock Reduction • Stock reduction can result from random variation as well as from environmental change; fishing would be superposed on the effects of these factors and appears to cause greater fluctuations than when fishing is absent • Fish stocks characterized by long generation times, small clutches of eggs, and fewer spawnings over time are the most vulnerable to overfishing • Fishing has initiated or accelerated the decline of many stocks
Management Problems • Fisheries managed by a variety of local and federal agencies • Management recommendations not always in best interests of maintaining stock • Some policies backfire - e.g., Magnuson Act of 1976, which extended U.S. coastal fishing zone 200 miles from shore but resulted in extensive deployment of U.S. fishng boats, resulting in overexploitation • Magnuson Act established 8 regional fishing commissions to help regulate domestic fishing - results good in some cases, bad in others
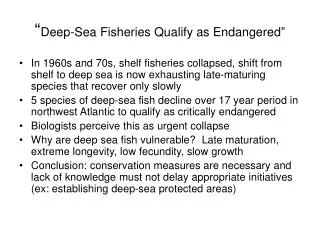
Effects of Overfishing • Great reduction of many stocks, e.g., formerly productive Georges Bank, east of New England • Effects concentrated especially on species with vulnerable life cycles (low fecundity, long generation time, e.g., sharks, whales) • Bycatch • Collateral effects on the bottom, where bottom trawling continually turns over the bottom, killing epibenthic animals • Elimination of species at the tops of food chains, which tend to be lower in abundance and have vulnerable life history characteristics
Georges Bank Stock landings 3 Metric Tons x 10 Cod Atlantic Ocean Haddock Yellowtail Cape Cod Year GEORGES BANK Trends in landings of three major fisheries on Georges Bank on the New England continental shelf, late 1970s to 1990s
Overfishing and Trophic Cascades • Remove top predator from fishing - get reorganization at lower trophic levels • Likely in nearshore fisheries with confined populations • Gulf of Maine Cod removal1990s --> increase in shrimp, snow crab (Frank et al. 2005, Science) • Other cases, North Sea, open Pacific, no evidence for reorganizations
Cures for Overfishing • Better models: more effective fishing approaches use models that show the impact of mortality on different life-history stages. • Closures and Limits: temporary closures and fishing limits allow some fisheries to be sustainable • Quotas: quotas might produce a sustainable fishery.
Some New Management Tools • Individual transferable quota (ITQ) - licenses are limited in number with quotas for each license, which can be sold involves a Total Allowable Catch (TAC) - e.g., rock lobsters, Australia (www.fao.org) • Marine Protected Areas (also may be known as No-Take Areas, Marine Reserves) - some portion of the stock’s geographic range is closed to fishing - protects spawning grounds, nursery grounds, or minimal crucial habitat size to preserve stock even when fishing is too high • Ecosystem-Based Management - consideration of entire ecosystem including human societal needs
Design of no-take areas in a hypothetical fishery; the spawning and juvenile feeding areas and one adult feeding ground are no-take zones, to allow a minimum population to complete a life cycle. other areas might be fished, although quotas might be set on the amount of the take.
Fisheries recap • Necessary knowledge - life history • Estimate of fishery size - stock (prop. to N, fishing effort-landings) • Fisheries models - e.g., Stock Recruitment Model • Over fishing - management problems (e.g., jurisdiction, Magnuson Act, political pressure by fishing groups) • Vulnerable fisheries - life cycle, top predators • Fishing down the food chain, trophic cascades
Whaling and Overfishing • Life cycle of cetacea - extended generation time, small number of young, long gestation • Expansion of range of boats -shore to open ocean • Change in technology Three periods: 12th century - 1820s - shore based small boats 1820s - 1925 - Land based and ships 1926 - present - pelagic (e.g., Antarctic) whaling
Shore-Based Fishing • Long Island - Baymen - coastal fishing • Bay of Biscaye - Biscayan Right Whale eliminated in 1600; by 1700s too few to exploit in N. Atlantic (by 1800s, ships hunted them to near extinction) • California grey whale - hunting began 1851 in nursery grounds, whaling ceased in 1890, 100 left by 1936…today expansion to <10,000
Ship-Based Whaling • 1820s Nantucket station - Atlantic sperm whales hunted to near extinction • 1820s -1850s switched to Pacific (Moby Dick, Essex) • 1860s - cannon-powered harpoon, use of catcher boats and factory processing ship • 1883 - Iceland is a base for whaling • 1890s - Antarctic stocks discovered • 1920s - stern slipway used, factory ships • 1920s - WWII decimation
Whaling management • 1930s - Various agreements signed (without Japan and Germany), 1931 - Blue Whale Unit • 1946 - IWC instituted - objection power • 1946-1969 - management of catch, season, size • 1971 Observers, BWU dropped in Antarctic • 1980s whaling almost ceased in Antarctic (scientific whaling); 1982 moratorium, Japan accepted it in 1987 • Currently pressure to resume whaling (Norway objection), Japan “scientific whaling” Blue Whale Unit (BWU) = 2 fin whales = 2.5 humpbacks = 6 sei whales www.iwcoffice.org
Indian Ocean Whale Sanctuary Southern Ocean Whale Sanctuary
Blue Whale Fin Whale Sei Whale Minke Whale 1900 20 40 60 80 2000 www.mofa.go.jp Antarctic Whale Stocks
Recovery? • Minke whale - pressure to refish • Humpback, Blue whale in eastern Pacific, increasing • Antarctic Blue whale, Northern Right Whale, no increase • Japan scientific whaling - not just Minke whale (Baker and Palumbi 1994)
Mariculture - Important Factors • Desirability as food • Uncomplicated reproduction • Hardiness • Disease resistance • High growth rate per unit area (growth efficiency) • Readily met food and habitat requirements • Monoculture or polyculture • Marketability • Minimal ecological damage
Mussels and Oysters • Mussels usually recruit to ropes and poles • Placement in areas of high phytoplankton density and water flow • Oyster newly settled larvae (spat) collected and then transferred to trays that are suspended from rafts • Problem: bivalve diseases, e.g., MSX in oysters, - amoeboid protozoan
Harmful Algal Blooms (HABs) • A variety of toxins, usually produced by species of phytoplankton • Toxins are consumed, along with phytoplankton cells, by resource bivalves, that sequester toxins • Toxins are then consumed by people • Seasonality allows regulation in some cases (e.g., prohibition of exploitation of coastal mollusks in California from May-August)
Major HAB types 1 • Paralytic Shellfish Poisoning (PSP) - variety of neurotoxins produced by dinoflagellate species of Alexandrium, Gymnodiniums, Pyrodinium; strong neurotoxic effects, respiratory arrest, occasional death • Amnesic Shellfish Poisoning (ASP) - domoic acid produced by species of the diatom Pseudonitszchia; causes amnesia, neurological damage, even death
Major HAB types 2 • Neurotoxic Shellfish Poisoning - caused by brevitoxin, produced by dinoflagellate Gymnodinium breve, can be breathed from aerosols • Pfiesteria piscicida - toxin causes severe neurotoxic effects, one of many life history stages of this species emerges from the bottom and can attack fish
Spread of HABs 1 • Frequency and geographic extent of HABs are increasing • Harmful species often affect shellfish physiology as well as humans and may kill entire populations (e.g., killing of bay scallop Argopecten irradians by “brown tide” organism in waters of New York)
Spread of HABs 2 • Increase may be a result of increasing disturbance and pollution of coastal zone, or more frequent introductions from shipping traffic • Increase results in more frequent closures of shellfish beds, fish kills (Pfiesteria), sickness
Seaweed Mariculture • Nori - derived from red Porphyra spp., rich in protein, used to wrap sushi, spores collected on nets and grown in estuarine areas • Kelps - grown actively in western U.S. coastal waters, harvested for alginates, used in a number of foods • Many others, some harvested directly from shore