Download
1 / 1
10 likes | 68 Views
NRP1 in tumor tissue (n=35). ≧ 1.565. < 1.565. Group III 1.8688 7/7. ERCC1 in tumor tissue (n=28). < 1.2. ≧ 1.2. Group I 0.7164 17/17. Group II 1.4483 10/11. Figure 1. Response. EGFR in tumor tissue (n=35). VEGFR2 in tumor tissue (n=34). ≧ 1.535. < 1.535. ≧ 0.65.

E N D
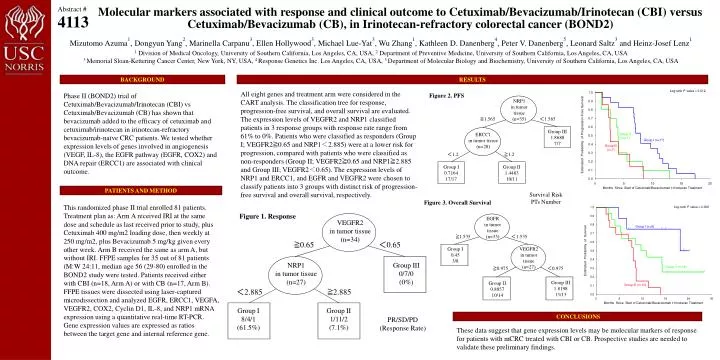
NRP1 in tumor tissue (n=35) ≧1.565 <1.565 Group III 1.8688 7/7 ERCC1 in tumor tissue (n=28) <1.2 ≧1.2 Group I 0.7164 17/17 Group II 1.4483 10/11 Figure 1. Response EGFR in tumor tissue (n=35) VEGFR2 in tumor tissue (n=34) ≧1.535 <1.535 ≧0.65 <0.65 Group I 0.45 3/8 VEGFR2 in tumor tissue (n=27) NRP1 in tumor tissue (n=27) Group III 0/7/0 (0%) ≧0.975 <0.975 Group III 1.8198 13/13 Group II 0.8857 10/14 <2.885 ≧2.885 Group I 8/4/1 (61.5%) Group II 1/11/2 (7.1%) PR/SD/PD (Response Rate) Abstract # Molecular markers associated with response and clinical outcome to Cetuximab/Bevacizumab/Irinotecan (CBI) versus Cetuximab/Bevacizumab (CB), in Irinotecan-refractory colorectal cancer (BOND2) 4113 Mizutomo Azuma1, Dongyun Yang2, Marinella Carpanu3, Ellen Hollywood3, Michael Lue-Yat3, Wu Zhang1, Kathleen D. Danenberg4, Peter V. Danenberg5, Leonard Saltz3and Heinz-Josef Lenz1 1 Division of Medical Oncology, University of Southern California, Los Angeles, CA, USA,2 Department of Preventive Medicine, University of Southern California, Los Angeles, CA, USA 3 Memorial Sloan-Kettering Cancer Center, New York, NY, USA, 4 Response Genetics Inc.Los Angeles, CA, USA, 5 Department of Molecular Biology and Biochemistry, University of Southern California, Los Angeles, CA, USA BACKGROUND RESULTS All eight genes and treatment arm were considered in the CART analysis. The classification tree for response, progression-free survival, and overall survival are evaluated. The expression levels of VEGFR2 and NRP1 classified patients in 3 response groups with response rate range from 61% to 0%. Patients who were classified as responders (Group I; VEGFR2≧0.65 and NRP1<2.885) were at a lower risk for progression, compared with patients who were classified as non-responders (Group II; VEGFR2≧0.65 and NRP1≧2.885 and Group III; VEGFR2<0.65). The expression levels of NRP1 and ERCC1, and EGFR and VEGFR2 were chosen to classify patients into 3 groups with distinct risk of progression-free survival and overall survival, respectively. Phase II (BOND2) trial of Cetuximab/Bevacizumab/Irinotecan (CBI) vs Cetuximab/Bevacizumab (CB) has shown that bevacizumab added to the efficacy of cetuximab and cetuximab/irinotecan in irinotecan-refractory bevacizumab-naïve CRC patients. We tested whether expression levels of genes involved in angiogenesis (VEGF, IL-8), the EGFR pathway (EGFR, COX2) and DNA repair (ERCC1) are associated with clinical outcome. Figure 2. PFS PATIENTS AND METHOD Survival Risk PTs Number Figure 3. Overall Survival This randomized phase II trial enrolled 81 patients. Treatment plan as: Arm A received IRI at the same dose and schedule as last received prior to study, plus Cetuximab 400 mg/m2 loading dose, then weekly at 250 mg/m2, plus Bevacizumab 5 mg/kg given every other week. Arm B received the same as arm A, but without IRI. FFPE samples for 35 out of 81 patients (M:W 24:11, median age 56 (29-80) enrolled in the BOND2 study were tested. Patients received either with CBI (n=18, Arm A) or with CB (n=17, Arm B). FFPE tissues were dissected using laser-captured microdissection and analyzed EGFR, ERCC1, VEGFA, VEGFR2, COX2, Cyclin D1, IL-8, and NRP1 mRNA expression using a quantitative real-time RT-PCR. Gene expression values are expressed as ratios between the target gene and internal reference gene. CONCLUSIONS These data suggest that gene expression levels may be molecular markers of response for patients with mCRC treated with CBI or CB. Prospective studies are needed to validate these preliminary findings.